Abstract
Wind turbine is a clean, renewable and sustainable energy technology that makes it extremely important to promote global energy transformation and achieve low-carbon development. Cracks in wind turbine blades reduce their stability and lifespan and may lead to significant safety hazards. Therefore, a blade for the 5MW wind turbine was modeled with the method of layering by zones and sections, and the dynamic characteristics of cracks at different positions of the wind turbine blade are analyzed. It can be found that the maximum stress is the highest when a crack is located at the root of the blade, and the maximum stress from the crack will gradually decrease from the blade root to the blade tip. At the same time, the cracks at the blade root will propagate towards the blade middle over time. Combined with digital speckle technique and wind tunnel, an experimental platform for dynamic characteristics of wind turbine blades was constructed. The dynamic characteristics and crack propagation trend of cracked blades were analyzed, and the experimental results were compared with the theoretical analysis. It is found that the experimental results are in agreement with the theoretical analysis conclusions.
Highlights
- A blade for the 5MW wind turbine was modeled with the method of layering by zones and sections, and the dynamic characteristics of cracks at different positions of the wind turbine blade are analyzed.
- The analysis shows that the area where the blade is dangerous and prone to cracks is the blade root, and there is a tendency for blade cracks to propagate inward during operation.
- The dynamic characteristics and crack propagation trend of cracked blades were analyzed, and the experimental results verified the correctness of the theoretical analysis.
1. Introduction
Bladed wind turbine is the core component for converting wind energy into electric energy, which is faced with the dual challenges of natural environment and complex loads and is prone to crack initiation. Cracks will affect the dynamic characteristics of the blade, making the vibration frequency and blade amplitude of the blade change, and then this will affect the overall performance and life of the wind turbine. At the same time, when the crack on the blade further expands, it will cause the blade cracking, deboning, and finally the dangerous accident of blade fracture, which will pose a serious threat to engineering safety. Therefore, it is necessary to study the dynamic characteristics of wind turbine blades under crack damage.
Scholars worldwide have explored damage models, crack monitoring, and dynamic characteristics of the wind turbine blades. Castro et al. [1] combined them with the multi-scale structural analysis method, discussed the influence of cracks on the structural response of wind turbine blades. This method combined the cross-section analysis based on two-dimensional finite element with the damage mechanics model and effectively predicted the changes of section stiffness and blade natural frequency with cracks. Montesano et al. [2] coupled the computational micro-mechanics with the continuum damage mechanics framework to establish a multi-scale progressive damage model. Experiments show that it is possible to predict the evolution of damage in key areas of blades, which is of great significance to improve the accuracy of damage tolerance analysis and the verification of composite structures. Yan et al. [3] studied the dynamic characteristics of the blade while changing of the excitation amplitude and frequency under different crack depth and got the detailed dynamic evolution of the blade and the effects of the crack depth on it. McGugan et al. [4] compared various methods of wind turbine blade health monitoring and proposed a wind turbine blade health monitoring method based on the damage mechanism. Tian et al. [5] found that cracks were most likely to appear at the blade root with a frequency of 87.75 %. It can be seen that the previous researches on the surface crack propagation mechanism of wind turbine blades are less concentrated on the cracks propagation dynamic and prediction, so the above research is of great value as a reference for the crack propagation of wind turbine blade.
Herein, in order to study the dynamic characteristics of the blade with cracks, this paper carries out a laminated modeling for a blade, analyzes the dynamic characteristics of its cracks at different positions of the blade, determines the position where the cracks are most likely to occur, and builds a wind tunnel test platform with binocular vision technology, and carries out the wind tunnel test for experimental verification.
2. Research object
In this paper, NREL 5MW wind turbine blade is used as the research object. The blade material is fiberglass reinforced plastic, the density is 2100 Kg/m3, the elastic modulus is 3.9e4, the shear modulus is 3.8E3, and the Poisson’s ratio is 0.28. In the blade lamination design, a stepped transition distribution along the span-wise direction, the method of partition and cross-section lamination is adopted to improve the material performance of the blade are used to ensure the appropriate blade lamination thickness in different areas [6]. The specific layering method of each blade area is shown in Table 1. After the basic fiber and sub layer define the material properties used for laying, the sub layer to stack is selected and laid on the blade entity. The coordinate reference direction points move to the outside of the blade, and the thickness direction is perpendicular to the inside of the blade. The whole blade is divided into five parts, and the skin thickness decreases from 45 mm to 10.8 mm. After paving, the result is as shown in Fig. 1.
Table 1Lamination mode of different areas of blade
Fiber angle: ±45° | Fiber angle: 0° | Fiber angle: 90° | The thickness of envelope / mm | Section |
2×1.8 | 21×1.8 | 2×1.8 | 45.0 | 1 |
2×1.8 | 11×1.8 | 2×1.8 | 27.0 | 2 |
2×1.8 | 6×1.8 | 2×1.8 | 18.0 | 3 |
2×1.8 | 4×1.8 | 2×1.8 | 14.4 | 4 |
2×1.8 | 2×1.8 | 2×1.8 | 10.8 | 5 |
Fig. 1Blade overlay modeling
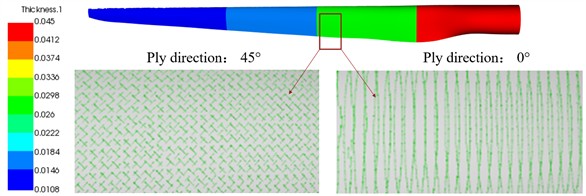
Fig. 2Schematic diagram of crack model
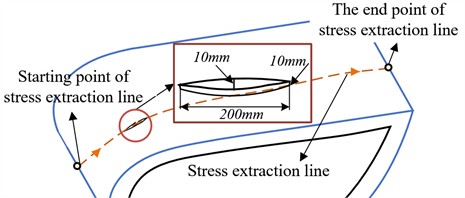
According to the relevant data [7], the length of more than a half of the crack damage is between 200 mm and 400 mm, and the width of the crack is basically less than 10 mm. Therefore, the crack length and width are set to 200 mm and 10 mm respectively, and the crack depth is also set to 10 mm. So, the study employs a crack model with the size of 200 mm×10 mm×10 mm which is established on the windward side and leading edge of the blade, as shown in Fig. 2.
3. Dynamic characteristics analysis of wind turbine blade with cracks
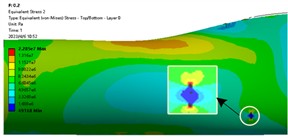
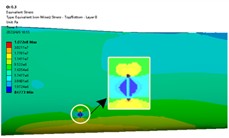
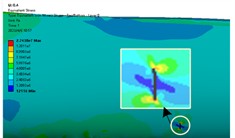
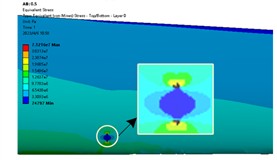
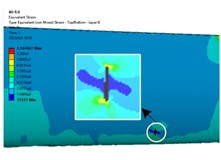
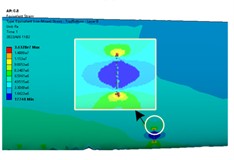
In order to study the effect of crack distribution position on the dynamic characteristics of the blade after crack damage, cracks were embedded into different sections of the wind turbine blade, specifically, the dimensionless radius positions () of the blade were 0.2, 0.3, 0.4, 0.5, 0.6 and 0.8. Because the windward surface is the main load area, the crack distribution is set on the windward surface. Under the steady state wind condition with the rated wind speed of 11.4 m/s, the stress distribution nephogram of the blade at different crack locations is shown in Fig. 3. The stress curve along the blade circumference at different crack locations is shown in Fig. 4.
Fig. 3Stress nephogram of cracked blade
a) 0.2
b) 0.3
c) 0.4
d) 0.5
e) 0.6
f) 0.8
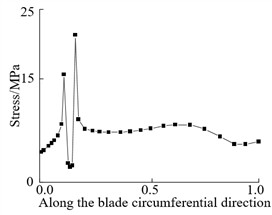
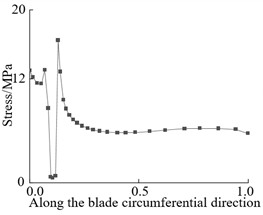
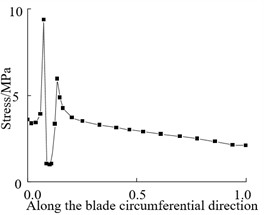
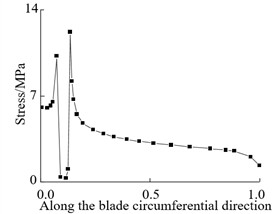
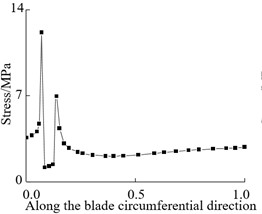
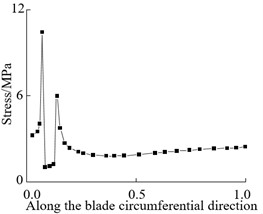
Fig. 4Circumferential stress curve along blade at crack
a) 0.2
b) 0.3
c) 0.4
d) 0.5
e) 0.6
f) 0.8
From Fig. 3 and Fig. 4, it can be seen that the stress at both ends of the crack is the maximum and the stress at the crack edge is the minimum after the crack damage occurs. When the crack appears at the blade root and tip, the maximum crack stress is 21.4 MPa (root) and 11.73 MPa (tip). It can be seen that the maximum stress at the tip of the mutual crack generally decreases with the crack distribution from the blade root to the blade tip. It can also be seen that when the crack is located at the blade root, the stress on the crack tip near the middle of the blade is larger than that on the crack tip near the leading edge. When the crack is located in the middle and tip of the blade, the stress near the crack tip in the middle of the blade is smaller than the stress near the edge, which indicates that the crack at the blade root will expand to the middle of the blade after the cracked blade is stressed. This increases the likelihood of blade cracking, which is also the root cause that the wind turbine blade is often broken near the blade root.
4. Experiment for determining crack position on blade
In order to verify the correctness of the theoretical analysis, the binocular stereo vision technology was applied to build an experimental platform to measure the maximum stress position of the blade and the dynamic characteristics of the cracked blade. The experimental platform is composed of experimental blade, low speed DC wind tunnel, 3D digital speckle strain measurement system, data acquisition part (CCD high-speed camera, triangular support and light compensation lamp) and data processing part (control box, workstation and special post-processing software XTDIC), as shown in the Fig. 5. Blades are produced by 3D printing using SLA resin photo-curing, with a total length of 0.9 m.
Fig. 5Schematic diagram of crack model
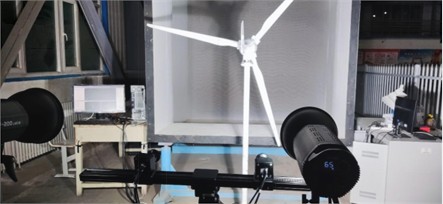
The CCD high-speed camera, baler acA2000-340 km, with a resolution of 2048×1088 was applied for image acquisition. The quality of the finished speckle image acquisition product is affected by the shooting environment, and the overexposure will lead to poor image sampling, so the aperture needs to be significantly tuned during the day, so the experiment is suitable for the dark environment. The two led white light source headlights are used to carry out the up and down staggered lighting mode on the format captured by the camera, avoiding the color difference and reflection caused by the blade rotation, so that the lighting rays can complement each other [8]. Two cameras are installed at the tripod pan tilt, and are connected with an equipment cable to the control box expansion interface, and then the control box is connected to the workstation.
Before the experiment, the camera is turned on to warm up for 15 minutes. The soft trigger mode shall be activated during the camera turning-on. After preheating, set the corresponding parameters are set, the measurement distance, camera angle, camera focal length and aperture are adjusted. After that, the eight-step method of plane template is used to calibrate the camera. The calibration is the process of obtaining and matching the internal and external parameters of the camera. Once the camera is calibrated, that is, the images in eight different directions are collected under the standard measurement distance of the system, including the standard facing, the left facing camera, the right facing camera, the tilt up, the rotation of 90°, the rotation of 180°, and the standard facing distance of ±10 % of the standard distance. The deviation sigma result displayed in the calibration result column is within the area of 0.02-0.05, and the angle is about 25°, indicating that the calibration is successful, and then the experimental data can be collected.
After the test, the blade displacement is calculated by using the digital image correlation method through the special post-processing software XTDIC. XTDIC is a full-field, non-contact optical measurement method, which is widely used in material deformation measurement in various fields because of its high measurement accuracy, simple experimental equipment, wide measurement range and other advantages [9-12].
As shown in the Fig. 6, in a fixed plane rectangular coordinate system, if is the displacement field from the measured surface before the object moves, it can be separated into a two-dimensional matrix , and the displacement field on the measured surface after the object moves is , which can be discretized into a two-dimensional matrix [13].
Fig. 6The model of digital speckle correlation
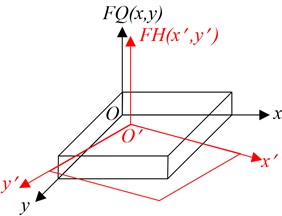
The matrix and matrix are the same as the -order square matrix, and the data acquisition resolution is . If the displacement of plane motion is , then:
The matrix obtained by plane motion transformation of matrix according to the above formula is represented by . And the displacement of plane motion in direction and direction are represented by and respectively, the rotation angle is represented by . Then the cross-correlation function is:
The necessary condition for the cross-correlation of continuous function to obtain the extreme value is:
The necessary conditions for the cross-correlation function of discrete functions to obtain extreme values is:
where and are integers, and , , .
According to the above conditions, , and corresponding to the maximum value of the cross-correlation function can be calculated to obtain the motion displacement of the plane, as follows:
5. Experiment results allocation on diagram
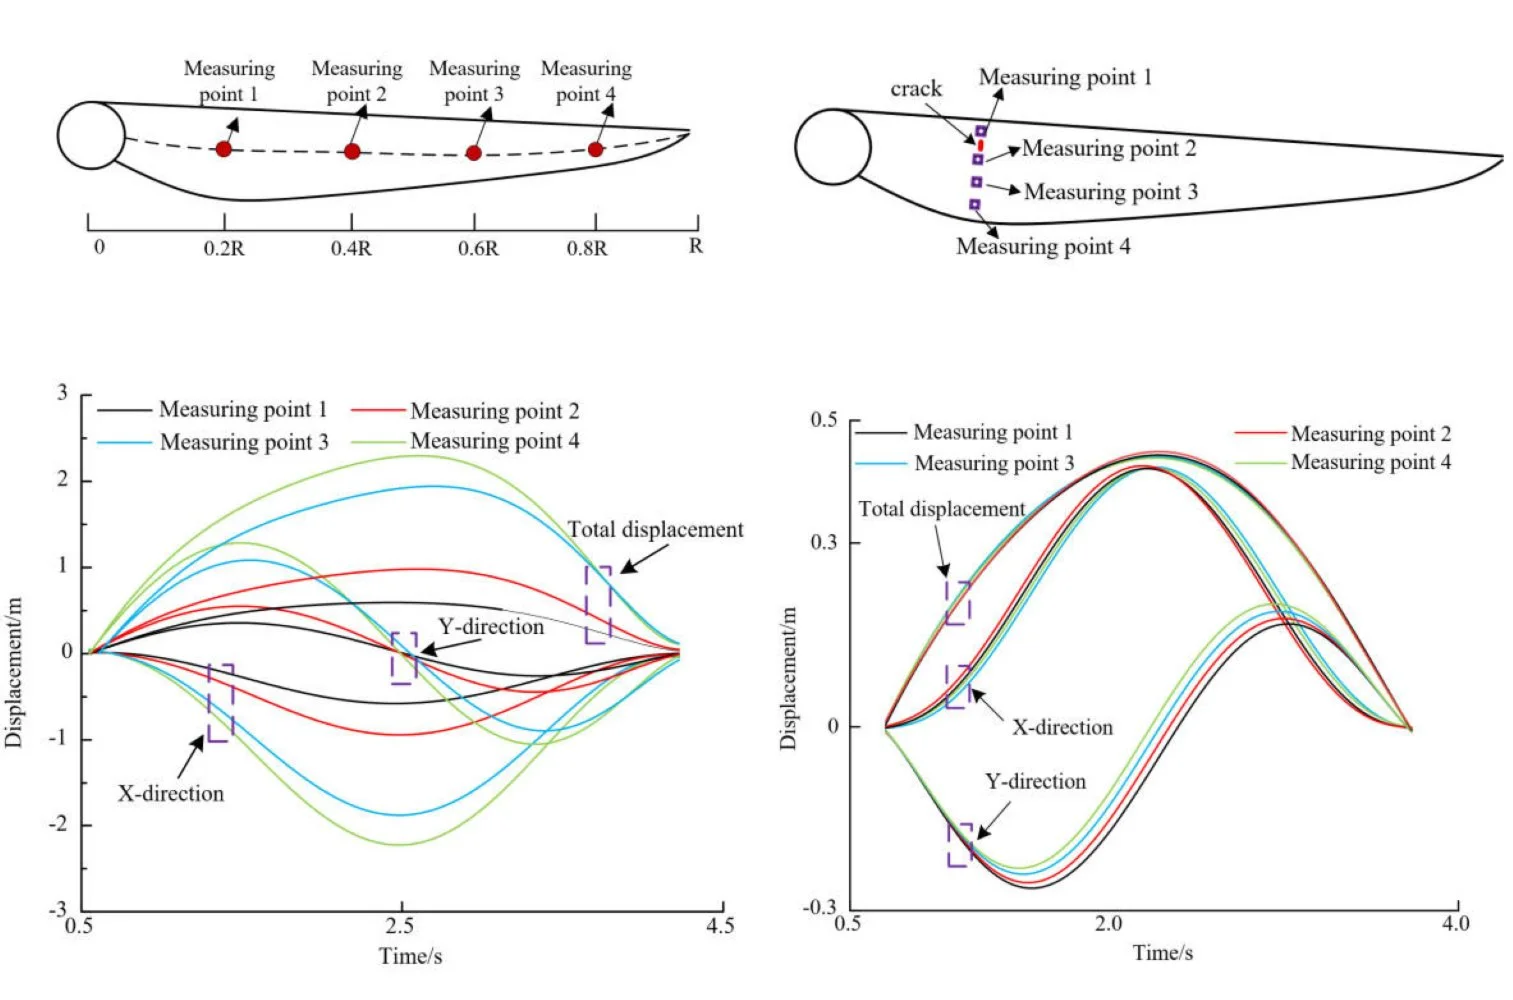
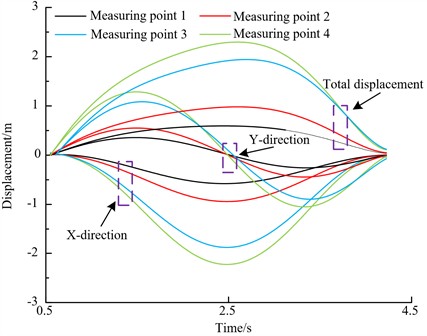
In order to measure the position where cracks are most likely to appear on the wind turbine blade, the measuring points are distributed along the blade span-wise direction, as shown in Fig. 7. The time domain diagram with the displacement of the blade measuring points in one rotation cycle under the steady wind condition with the wind speed of 3 m/s is shown in Fig. 8. It can be seen that the maximum displacement of measuring point 1 is 8.7 %, the maximum displacement of measuring point 2 is 8.3 %, the maximum displacement of measuring point 3 is 4.1 %, and the maximum displacement of measuring point 4 is 8.3 %. It can be seen that there are large strains at the b blade root, and the maximum strain at the blade root, that is, the area where the blade is dangerous and prone to crack is at the blade root. The experimental results are the same as those from theoretical analysis, and the conclusion is consistent with the results of reference [5].
Fig. 7Distribution of measuring points on blade
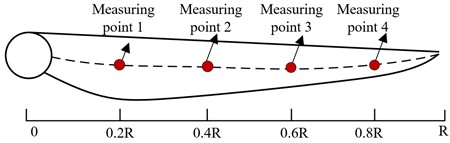
Fig. 8Time domain displacement curve of each measuring point
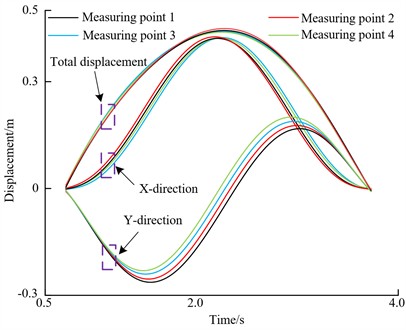
According to the above conclusion, a 13 mm×1 mm crack is preset at the area of 0.2 along the span-wise direction of the blade, and four measuring points are arranged longitudinally, as shown in Fig. 9. The displacement time-domain curve of each measuring point is shown in Fig. 10.
From Fig. 10, it can be seen that the maximum displacement of measuring point 1 is 1.0 %, the maximum displacement of measuring point 2 is 1.1 %, the maximum displacement of measuring point 3 is 0.6 %, and the maximum displacement of measuring point 4 is 0.6 %. The displacement of measuring point 1 and measuring point 2 is the most obvious, indicating that the strain effect caused by crack damage is greater than that caused by rotation. Since the displacement of measuring point 2 is greater than that of measuring point 1, it indicates that the blade crack has a tendency to expand into the blade, which is consistent with the theoretical analysis results.
Fig. 9Distribution of measuring points and crack on blade
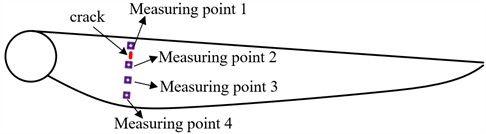
Fig. 10Comparison diagram of simulation and experimental strain
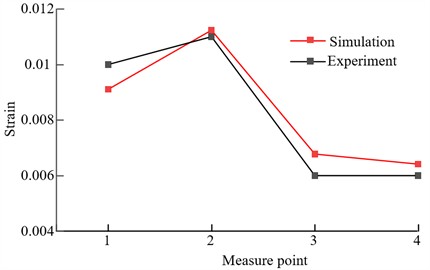
The dynamic characteristics of the experimental blade with cracks are simulated and analyzed, and the strain of each measuring point on the blade can be measured. The simulation analysis results are compared with the experimental results, as shown in Fig. 11. It can be seen that the strain test results of each measuring point after the crack damage at the blade root are consistent with the theoretical analysis results, and the strain near the crack middle is greater than that near the leading edge of the blade.
Fig. 11Comparison diagram of simulation and experimental strain
6. Conclusions
5 MW wind turbine blade was modeled by the method of zonal and cross-sectional layering. The size of blade crack is determined to be 200 mm×10 mm×10 mm which is located on the windward side and leading edge of the blade.
The dynamic characteristics of cracked blade were analyzed. The results indicate that when a crack occurs at the root of the blade, the maximum stress attains its peak value, reaching up to 21.4 MPa. Additionally, it can be observed that the crack at the blade root will propagate towards the middle of the blade, eventually leading resulting blade fracture.
Based on the binocular vision technology and in combination with a wind tunnel, an experimental platform for dynamic characteristics of wind turbines was established to verify the correctness of the theoretical analysis. It was found that the blade root is the area of the blade that is at high risk and prone to cracking. Moreover, during operation, there is a tendency for blade cracks to propagate inwards. The experimental results are in accordance with the theoretical ones. Thus, when designing blades, the crucial issue of the high likelihood of cracks emerging at the blade root should be taken into account.
References
-
O. Castro and K. Branner, “Effect of tunneling cracks on structural property degradation of wind turbine blades,” Composite Structures, Vol. 268, p. 113914, Jul. 2021, https://doi.org/10.1016/j.compstruct.2021.113914
-
J. Montesano, H. Chu, and C. V. Singh, “Development of a physics-based multi-scale progressive damage model for assessing the durability of wind turbine blades,” Composite Structures, Vol. 141, pp. 50–62, May 2016, https://doi.org/10.1016/j.compstruct.2016.01.011
-
D. Yan, Y. Zheng, W. Wang, and Q. Chen, “Modeling and dynamic analyses of the bulb turbine blade with crack fault,” Applied Mathematical Modelling, Vol. 89, pp. 731–751, Jan. 2021, https://doi.org/10.1016/j.apm.2020.08.005
-
M. Mcgugan and L. Mishnaevsky, “Damage mechanism based approach to the structural health monitoring of wind turbine blades,” Coatings, Vol. 10, No. 12, p. 1223, Dec. 2020, https://doi.org/10.3390/coatings10121223
-
K. Tian, L. Song, Y. Chen, X. Jiao, R. Feng, and R. Tian, “Stress coupling analysis and failure damage evaluation of wind turbine blades during strong winds,” Energies, Vol. 15, No. 4, p. 1339, Feb. 2022, https://doi.org/10.3390/en15041339
-
X. M. Rui, Z. Y. Ma, and C. M. Kang, “Design method of blade wing for large wind turbine units,” (in Chinese), Transactions of the Chinese Society for Agricultural Machinery, No. 2, pp. 192–194, 2008.
-
N. P. Jiao, L. Song, Y. Y. Chen, X. F. Jiao, R. Feng, and R. Tia, “Stress coupling analysis of blades with crack damage under shear flow,” (in Chinese), Acta Energiae Solaris Sinica, Vol. 44, No. 1, pp. 203–210, 2023.
-
Y. J. Dai, C. Guo, B. H. Li, J. B. Jiang, and C. Wang, “Influence of centrifugal force and aerodynamic load on strain characteristics of wind turbine blades,” (in Chinese), Journal of Drainage and Irrigation Machinery Engineering, Vol. 41, No. 6, pp. 576–582, 2023.
-
Y. T. Dai, Z. N. Chen, F. P. Zhu, and X. Y. He, “Measurementb of Lüders band in small size low carbon steel specimen by 3D digital image correlation method,” (in Chinese), Chinese Journal of Theoretical and Applied Mechanics, Vol. 47, No. 1, pp. 119–126, 2015.
-
M. Flores, D. Mollenhauer, V. Runatunga, T. Beberniss, D. Rapking, and M. Pankow, “High-speed 3D digital image correlation of low-velocity impacts on composite plates,” Composites Part B: Engineering, Vol. 131, pp. 153–164, Dec. 2017, https://doi.org/10.1016/j.compositesb.2017.07.078
-
R. Wu, H. Wu, D. Arola, and D. Zhang, “Real-time three-dimensional digital image correlation for biomedical applications,” Journal of Biomedical Optics, Vol. 21, No. 10, p. 107003, Oct. 2016, https://doi.org/10.1117/1.jbo.21.10.107003
-
O. Jiroušek, I. Jandejsek, and D. Vavřík, “Evaluation of strain field in microstructures using micro-CT and digital volume correlation,” Journal of Instrumentation, Vol. 6, No. 1, pp. C01039–C01039, Jan. 2011, https://doi.org/10.1088/1748-0221/6/01/c01039
-
W. Z. Huang, “Research on model and arithmetic of DSCM for tiny displacement measurement,” (in Chinese), Chinese Journal of Digital Technology and Application, No. 8, pp. 9–10, Aug. 2011.
About this article

This paper was created as per the Research Program supported by the Xinjiang University scientific research fund (BS190220), the Talent Youth Doctoral Program of Youth Doctoral (51052300553) and the Research and Development of Key Technologies for Digital Design and Intelligent Manufacturing of Wind Power Equipment (ZYYD2025JD07).
The datasets generated during and/or analyzed during the current study are available from the corresponding author on reasonable request.
Li Cao: conceptualization, project administration, resources, writing-review and editing, resources. Hui Jin: data curation, formal analysis, methodology, validation, writing-original draft preparation. Wenlei Sun: funding acquisition, software, resources.
The authors declare that they have no conflict of interest.
