Abstract
As the forces applied on the wind turbine blade are irregular, the deformation and concentrated stress of the blade may vary with the load and excitation. And the lamination of composite materials is critical to blade design, it directly affects the performance and power of wind power plants. In this paper, the response characteristics of the wind turbine blade is analyzed by the application of the harmonic response method under different ply angles. Through the simulation results, the performance of the actual blade is estimated, and the rationality of this design is judged. The results demonstrate that the blade displacement response amplitude is the minimum when ply angle is 45°. It is also found that the maximum displacement response occurs in the direction (i.e. parallel to the flow direction) by analyzing the displacement of each section in the blade, while the maximum stress is located at blade root.
1. Introduction
A wind turbine blade is a hollow composite structure, and it is manufactured from composite materials. Blade is one of the most important structural components of the wind turbine, the force of the blade is complex, and it is affected by aerodynamic force, elastic force and inertial force during the rotation process [1]. As the power of large wind turbines continues to increase, the length and flexibility of wind turbine blades continue to increase, and the blades are prone to vibration. Large amplitude vibrations can cause large dynamic stresses and accelerate the fatigue of the blade material, and even cause blade breakage. Therefore, the analysis of the static structure of the blade should be considered in the analysis, as well as the dynamic response of the blade [2, 3]. The research of its vibration characteristics has become the focus of wind turbine development.
Wind turbine blades are usually made by fiber reinforced plastic (FRP). Its specific production process determines the performance. The lamination of composite materials is critical to blade design, it directly affects the performance and power of wind power plants, and also determines the cost of wind power. In order to ensure the structural safety of the blade, in the design of the blade, it is necessary to calculate the maximum load of each section of the blade under load conditions and check the strength of the blade section layup material under this load. The three key parameters of the composite layup are the ply angle, the ply thickness and the ply order [4, 5]. Hayat and Ha [6] studied of unbalanced tri-axial non-crimp fabrics laminates typically used in the blade skin layup. They found that the highest bend-twist coupling up to 0.56 was achieved when all three kinds of unbalances (i.e. ply-angle, ply-material and ply-thickness unbalances) were simultaneously presented in the laminates. Albanesi et al. [7] presented a novel methodology to design wind turbine blades using the Inverse Finite Element Method. Wang et al. [8] designed a wind turbine blade made by fiber reinforced polymer composites, in which the local structural stiffness is enhanced while the local stability of the blade is improved.
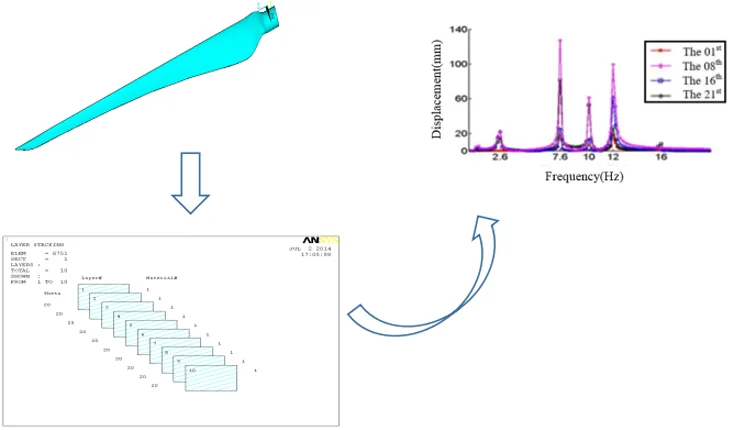
In this paper, through the simulation results, the performance of the actual blade is estimated, and the rationality of this design is judged. Considering the blade under different ply angles, its response characteristics is analyzed under the simple harmonic load of known frequency by using harmonic response method. Harmonic response is an analytical technique for analyzing the steady-state response of a structure under simple harmonic varying loads over time. The amplitude-frequency characteristic curve of the structure displacement versus frequency can be obtained by analysis [9]. The harmonic dynamic response analysis results can predict the continuous dynamic characteristics of the structure. Therefore, it can be judged whether the design can overcome the harmful effects caused by resonance, fatigue and other forced vibrations. And ply parameters have a significant effect on the performance of blades [10, 11]. Using the above method, the effects of different ply angles on the vibration displacement are studied, and the dynamic response characteristics of the blade structure in the optimal ply mode are obtained.
2. Dynamic equation of harmonic response analysis
The dynamic equation of linear system vibration [12] is:
where, [] is the mass matrix, [] is the damping matrix, and [] is the stiffness matrix, , , is the node acceleration vector, velocity vector, and displacement vector. is the complex excitation force vector.
Initial displacement and speed are expressed as:
where, and are abbreviated initial displacement and initial velocity.
According to the characteristics of harmonic response analysis, Since the incentive is simple, so, the steady-state vibration of the system is also a simple harmonic vibration. So:
where, is the displacement response of the th excitation, and are the real and imaginary parts of .
Substituting Eq. (3) into (1), the kinetic equation corresponding to the th excitation force is:
In order to decouple the dynamic Eq. (1) represented by the physical coordinates, it must be converted to a modal coordinate system, so the equation is expressed as [11]:
where, , , are the main mass corresponding to the th mode, and the main coordinate and the exciting force of the th mode under the th excitation, is the circular frequency of the th mode, is the damping ratio.
The initial displacement and velocity in modal coordinates are:
where, is the initial displacement in the modal coordinate system, is the initial velocity in the modal coordinate system. In steady-state intermittent vibration, modal displacement and modal excitation can be expressed as:
where, , are respectively expressed as the excitation amplitude and response amplitude in the th mode.
Substituting Eqs. (7) and (8) into (5), so:
Therefore, the steady state displacement response corresponding to each mode is:
where, is the feature vector of the th mode under the th excitation.
The steady-state displacement response corresponding to the th excitation is:
According to the superposition principle of the linear system, the total steady-state displacement response corresponding to the excitations is:
In the process of solving, using harmonic response analysis method to analyze the response of each harmonic excitation in this time period [13]. Then superimpose all the stimulus responses, get the total response during this time period. Finally, the harmonic response analysis method is used to solve the vibration response solutions of other time regions, get the vibration response solution over the entire area [14].
The frequency range of the harmonic response analysis is mainly based on the natural frequency of the blade. From the modal analysis, calculating the frequency range of 0-20 Hz, and the response value of the blade is calculated every 0.2 Hz.
3. Simulation analysis of harmonic response of wind turbine blades
Using the 3D software solid works to build a 3D model of the wind turbine blade, and through the ANSYS composite module to achieve the layering design of the blade, Then, the dynamic stress analysis is carried out by harmonic response analysis method to calculate the displacement and stress of the structure.
3.1. Blade model
In this paper, taking a 2 MW wind turbine blade as an example, its design parameters are given as shown in Table 1. The wind speed is set to 11 m/s, and the rated speed of the blade is 19 r/min [15].
Table 1The design parameters of a 2 MW wind turbine blade
Power (MW) | 2 |
Diameter(m) | 84 |
The number of blades | 3 |
Blade speed range (rpm) | 6.5-25 |
Rated speed (rpm) | 19 |
The rated wind speed (m/s) | 11 |
3.2. Finite element analysis of blades by ANSYS
According to the chord length and torsion angle values in different cross-section of the blade, a three-dimensional model may be established. And importing it into ANSYS to get the finite element model. as shown in Fig. 1.
The material glass steel is chosen for blade, and material properties are shown in Table 2.
Table 2Material properties of blade
(GPa) | (GPa) | (GPa) | (kg/m3) | |
62.5 | 16.5 | 5.5 | 0.2 | 1.7 |
Fig. 1Model of the wind turbine blade
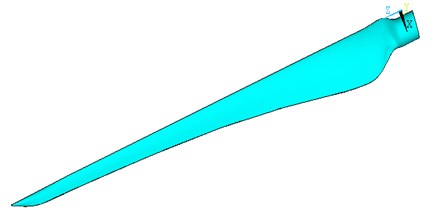
a)
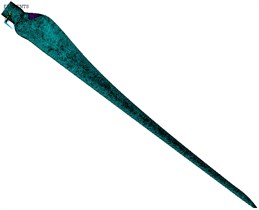
b)
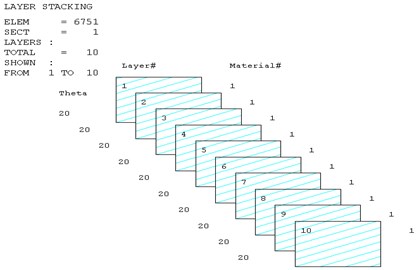
The SHELL181 unit is used in the finite element analysis of the blade. The SHELL181 unit section definition uses “shell section”. The cell section is defined as shown in Fig. 2 and Fig. 3.
Fig. 2SHELL181 unit section definition

Fig. 3The display of blade’s layer
The root of the blade is embedded in the hub, in the course of the analysis, it is assumed that the root portion is fixed, so that a fixed constraint of displacement is applied to the three directions of the blade root.
3.2.1. Effects of ply angles on the harmonic response
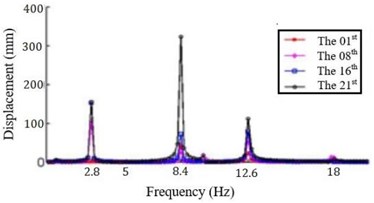
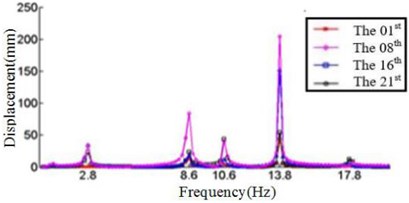
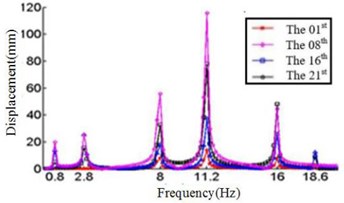
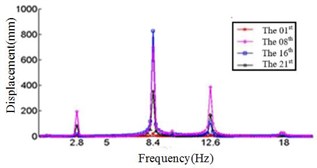
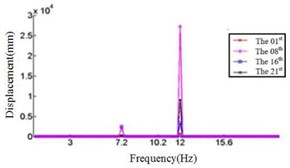
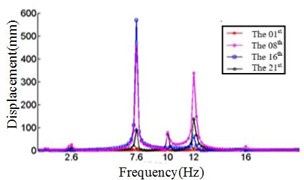
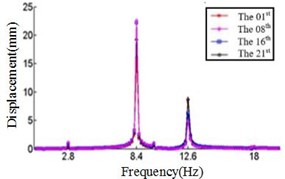
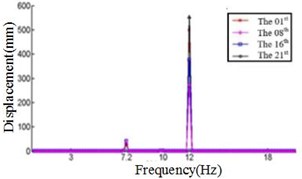
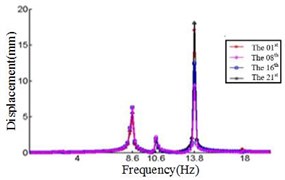
In this study, six cases where the ply angles are –45°, 0°, 20°, 45°, 60° and 90° are selected. A coordinate system on the blade should first be created, in which the -axis is the direction along the length of the blade, the -axis direction is the direction along the chord length, and the -axis direction is perpendicular to the chord length. We divide the blade into 21 sections and discuss the displacement response of the first, the eighth, the sixteenth and the twenty-first section. The relationship between the displacement response and the frequency in , , direction are shown in Fig. 4, Fig. 5 and Fig. 6, respectively.
Fig. 4Relationship between the displacement and frequency in X direction
a) Displacement response at –45° ply angles
b) Displacement response at 0° ply angles
c) Displacement response at 20° ply angles
d) Displacement response at 45°ply angles
e) Displacement response at 60° ply angles
f) Displacement response at 90° ply angles
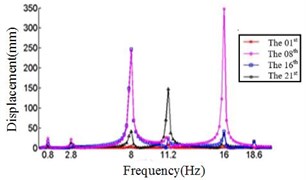
Fig. 4 shows that each section of the blade has a plurality of displacement response peaks at different ply angles, and the displacement peak of the different cross-section corresponding to the same frequency. When the ply angle is 0°, the peak of the displacement response is several times than others. The displacement peak at –45°, 20° and 60° is higher than that at 45° and 90°, at same time, the response peaks at 90° ply angle appear at 0.8Hz, 2.8 Hz, 8 Hz, 11.2 Hz, 16 Hz and 18.6 Hz, respectively, in which the blades would be no resonance. The first four orders natural frequencies of the blade are less than 2.8 Hz, and the displacement response peak occurs twice when the frequency is less than 2.8 Hz at 90° ply angle. So, the blade performance in the direction is optimal when the ply angle is 45°.
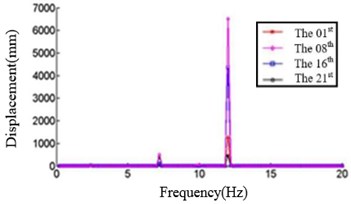
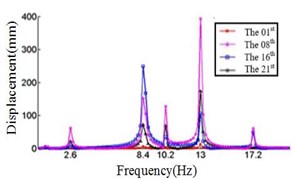
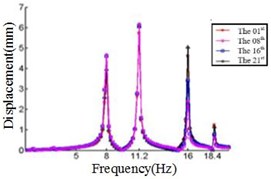
Fig. 5Relationship between the displacement and frequency in Y direction
a) Displacement response at –45° ply angles
b) Displacement response at 0° ply angles
c) Displacement response at 20° ply angles
d) Displacement response at 45° ply angles
e) Displacement response at 60° ply angles
f) Displacement response at 90° ply angles
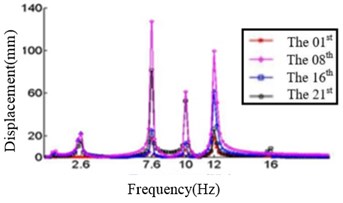
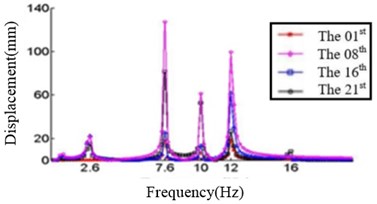
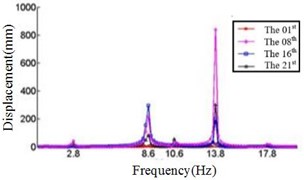
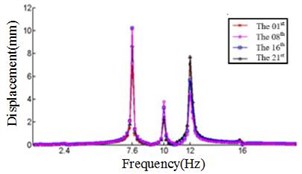
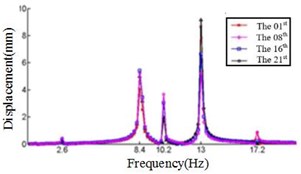
Fig. 6Relationship between the displacement and frequency in Z direction
a) Displacement response at –45° ply angles
b) Displacement response at 0° ply angles
c) Displacement response at 20° ply angles
d) Displacement response at 45° ply angles
e) Displacement response at 60° ply angles
f) Displacement response at 90° ply angles
Comparing Fig. 4, Fig. 5 and Fig. 6, it can be found that the displacement peaks of the blade in the , and direction have the same frequency at same ply angle, and the largest displacement response in three directions occurred at 0° ply angle. When the ply angle is 45° and 90°, the displacement response peak is relatively small. For all three directions, there is no frequent occurrence of low-frequency displacement response peak at 45° ply angle, and the peak of the displacement response is ideal.
3.2.2. Displacement analysis at 45° ply angle
The displacement response for each section is analyzed when the ply angle is set to 45°. The displacement response peak is mainly considered at frequency 2.6 Hz, 8.4 Hz, 10.2 Hz, 13 Hz and 16.2 Hz, respectively. In particular, the largest displacement response in the , and directions are analyzed.
The response in the direction and the corresponding section are shown in Table 3. From Table 4, it can be seen that the displacement response of the blade in the direction has the following characteristics: (a) the maximum response for all frequencies is located at blade tip except 16.2 Hz; (b) the maximum displacement response of the blade is the largest when the frequency is 13 Hz; (c) the 10th order natural frequency of the blade is higher than 16.2 Hz, so the deformation will be relatively large when the frequency is 16.2 Hz, and the blade will appear to reverse and shimmy coupling deformation, so the maximum deformation of the location is different from others.
Table 3The maximum response in the X direction and the corresponding section
Frequency (Hz) | The section of the maximum displacement | Displacement maximum (mm) | The section of the minimum displacement | Displacement minimum (mm) |
2.6 | 21 | 46.71 | 1 | 0.28 |
8.4 | 21 | 71.51 | 4 | 10 |
10.2 | 21 | 56.26 | 15 | 0.82 |
13 | 21 | 119.3 | 12 | 3.16 |
16.2 | 5 | 79.14 | 17 | 0.21 |
Table 4The maximum response in the Y direction and the corresponding section
Frequency (Hz) | The section of the maximum displacement | Displacement maximum (mm) | The section of the minimum displacement | Displacement minimum (mm) |
2.6 | 21 | 62.15 | 1 | 0.2 |
8.4 | 16 | 248.8 | 1 | 5.76 |
10.2 | 21 | 128.3 | 1 | 2.92 |
13 | 21 | 394.1 | 12 | 3.16 |
16.2 | 18 | 93.2 | 14 | 0.13 |
Table 4 shows the displacement response of the blade in the direction. It is obviously observed in Table 3 that: (a) the displacement response at 13 Hz is the largest; (b) the largest response is all located at the end of the blade for all frequencies; (c) the minimum displacement at 2.6 Hz, 8.4 Hz and 10.2 Hz occur at the first cross section (i.e., the root of the blade).
As the direction is the length of the blade, the variation of vibration response amplitude is small. Then the displacement response is relatively simple. In direction, the displacement peaks only appeared at 2.6 Hz, 8.4 Hz, 10.2 Hz and 13 Hz. The corresponding displacement data of the blade is shown in Table 5.
Comparing Table 3, Table 4 and Table 5, it can be seen that the maximum displacement response peak usually occurs in the and direction. As the response in the direction is the smallest, the displacement in the -axis direction is negligible. For all frequencies, the maximum displacement responses are located at the tip of the blade, and the displacement response of the blade tip is increasing with the increase of the frequency, that is, the vibration amplitude of the blade tip is increasing.
Table 5The maximum response in the Z direction and the corresponding section
Frequency (Hz) | The section of the maximum displacement | Displacement maximum (mm) | The section of the minimum displacement | Displacement minimum (mm) |
2.6 | 21 | 0.44 | 1 | 0.15 |
8.4 | 13 | 5.5 | 1 | 4.05 |
10.2 | 21 | 3.68 | 2 | 1.2 |
13 | 7 | 9.21 | 21 | 5.22 |
4. Conclusions
The application of the harmonic response method to analyze the vibration characteristics of a 2 MW blade under different ply angle has been presented. The study demonstrates that the ply parameters have a significant effect on the vibration response performance of the blade. The displacement peaks of the blade in the , and direction have the same frequency at same ply angle, and the largest displacement response in three directions occurred at 0° ply angle. For all three directions, there is no frequent occurrence of low-frequency displacement response peak at 45° ply angle, and the peak of the displacement response is ideal. For all frequencies, the maximum displacement responses are located at the tip of the blade, and the displacement response of the blade tip is increasing with the increase of the frequency.
Harmonic response analysis can determine whether the design can overcome the harmful effects caused by resonance, fatigue and other forced vibrations, and improve the blade structure. (1) When the blade’s ply angle is 45°, the aerodynamic performance of the blade is optimal. (2) The vibration displacement at the tip of the blade is the largest, which is easy to cause the blade to break. Therefore, the airfoil at the tip of the blade should be improved. In subsequent analysis blade model will be improved, and the aerodynamic performance of the blade when it is loaded will be analyzed.
References
-
Monte A. D., Betta S. D., Castelli M. R., Benini E. Proposal for a coupled aerodynamic–structural wind turbine blade optimization. Composite Structures, Vol. 159, Issue 3, 2017, p. 144-156.
-
Johnson D. A., Gu M., Gaunt B. Wind turbine performance in controlled conditions: BEM modeling and comparison with experimental results. International Journal of Rotating Machinery, Vol. 23, Issue 5, 2016, p. 5460823.
-
Fagan E. M., Flanagan M., Leen S. B., et al. Physical experimental static testing and structural design optimization for a composite wind turbine blade. Composite Structures, Vol. 164, Issue 32, 2017, p. 90-103.
-
Kulkarni P. A., Hu W., Dhoble A. S., Padole P. M. Statistical wind prediction and fatigue analysis for horizontal-axis wind turbine composite material blade under dynamic loads. Advances in Mechanical Engineering, Vol. 9, Issue 9, 2017, https://doi.org/10.1177/1687814017724088.
-
Asl M. E., Niezrecki C., Sherwood J., Avitabile P. Similitude analysis of thin-walled composite I-beams for subcomponent testing of wind turbine blades. Wind Engineering, Vol. 41, Issue 5, 2017, p. 297-312.
-
Hayat K., Ha S. K. Load mitigation of wind turbine blade by aeroelastic tailoring via unbalanced laminates composites. Composite Structures, Vol. 128, Issue 3, 2015, p. 122-133.
-
Albanesi A., Fachinotti V., Peralta I., Storti B., Gebhardt C. Application of the inverse finite element method to design wind turbine blades. Composite Structures, Vol. 161, Issue 25, 2017, p. 160-172.
-
Wang Y. J., Zhu S. R., Wang J. J. The ply optimum design of composites wind turbine blade based on the local stability. Advanced Materials Research, Vol. 988, 2014, p. 445-448.
-
Gangele A., Ahmed S. Modal analysis of S809 wind turbine blade considering different geometrical and material parameters. Journal of The Institution of Engineers, Vol. 94, Issue 3, 2013, p. 225-228.
-
Philippe M., Babarit A., Ferrant P. Modes of response of an offshore wind turbine with directional wind and waves. Renewable Energy, Vol. 49, Issue 1, 2013, p. 151-155.
-
Tran T. T., Kim D. H. A CFD study into the influence of unsteady aerodynamic interference on wind turbine surge motion. Renewable Energy, Vol. 90, Issue 3, 2016, p. 204-228.
-
Huang X. D., Hse C. Y., Shupe T. F. Evaluation of the performance of the composite bamboo/epoxy laminated material for wind turbine blades technology. Bioresources, Vol. 10, Issue 1, 2015, p. 660-671.
-
Bagherpoor T., Li X. Structural optimization design of 2MW composite wind turbine blade. Energy Procedia, Vol. 105, Issue 2, 2017, p. 1226-1233.
-
Rocha I. B. C. M., Raijmaekers S., Nijssen R., et al. Hygrothermal ageing behaviour of a glass/epoxy composite used in wind turbine blades. Composite Structures, Vol. 174, Issue 13, 2017, p. 110-122.
-
Lu En, Li Wei, Yang Xuefeng, Wang Yuqiao, Liu Yufei Dynamic modeling and analysis of a rotating piezoelectric smart beam. International Journal of Structural Stability and Dynamics, Vol. 18, Issue 1, 2018, p. 1850003.
About this article

This work was partly supported by the National Natural Science Foundation of China (Grant No. 11472103, 11572125 and 51775182) and Hunan Provincial Department of Education Research Project (Grant No. 17C0398).
