Abstract
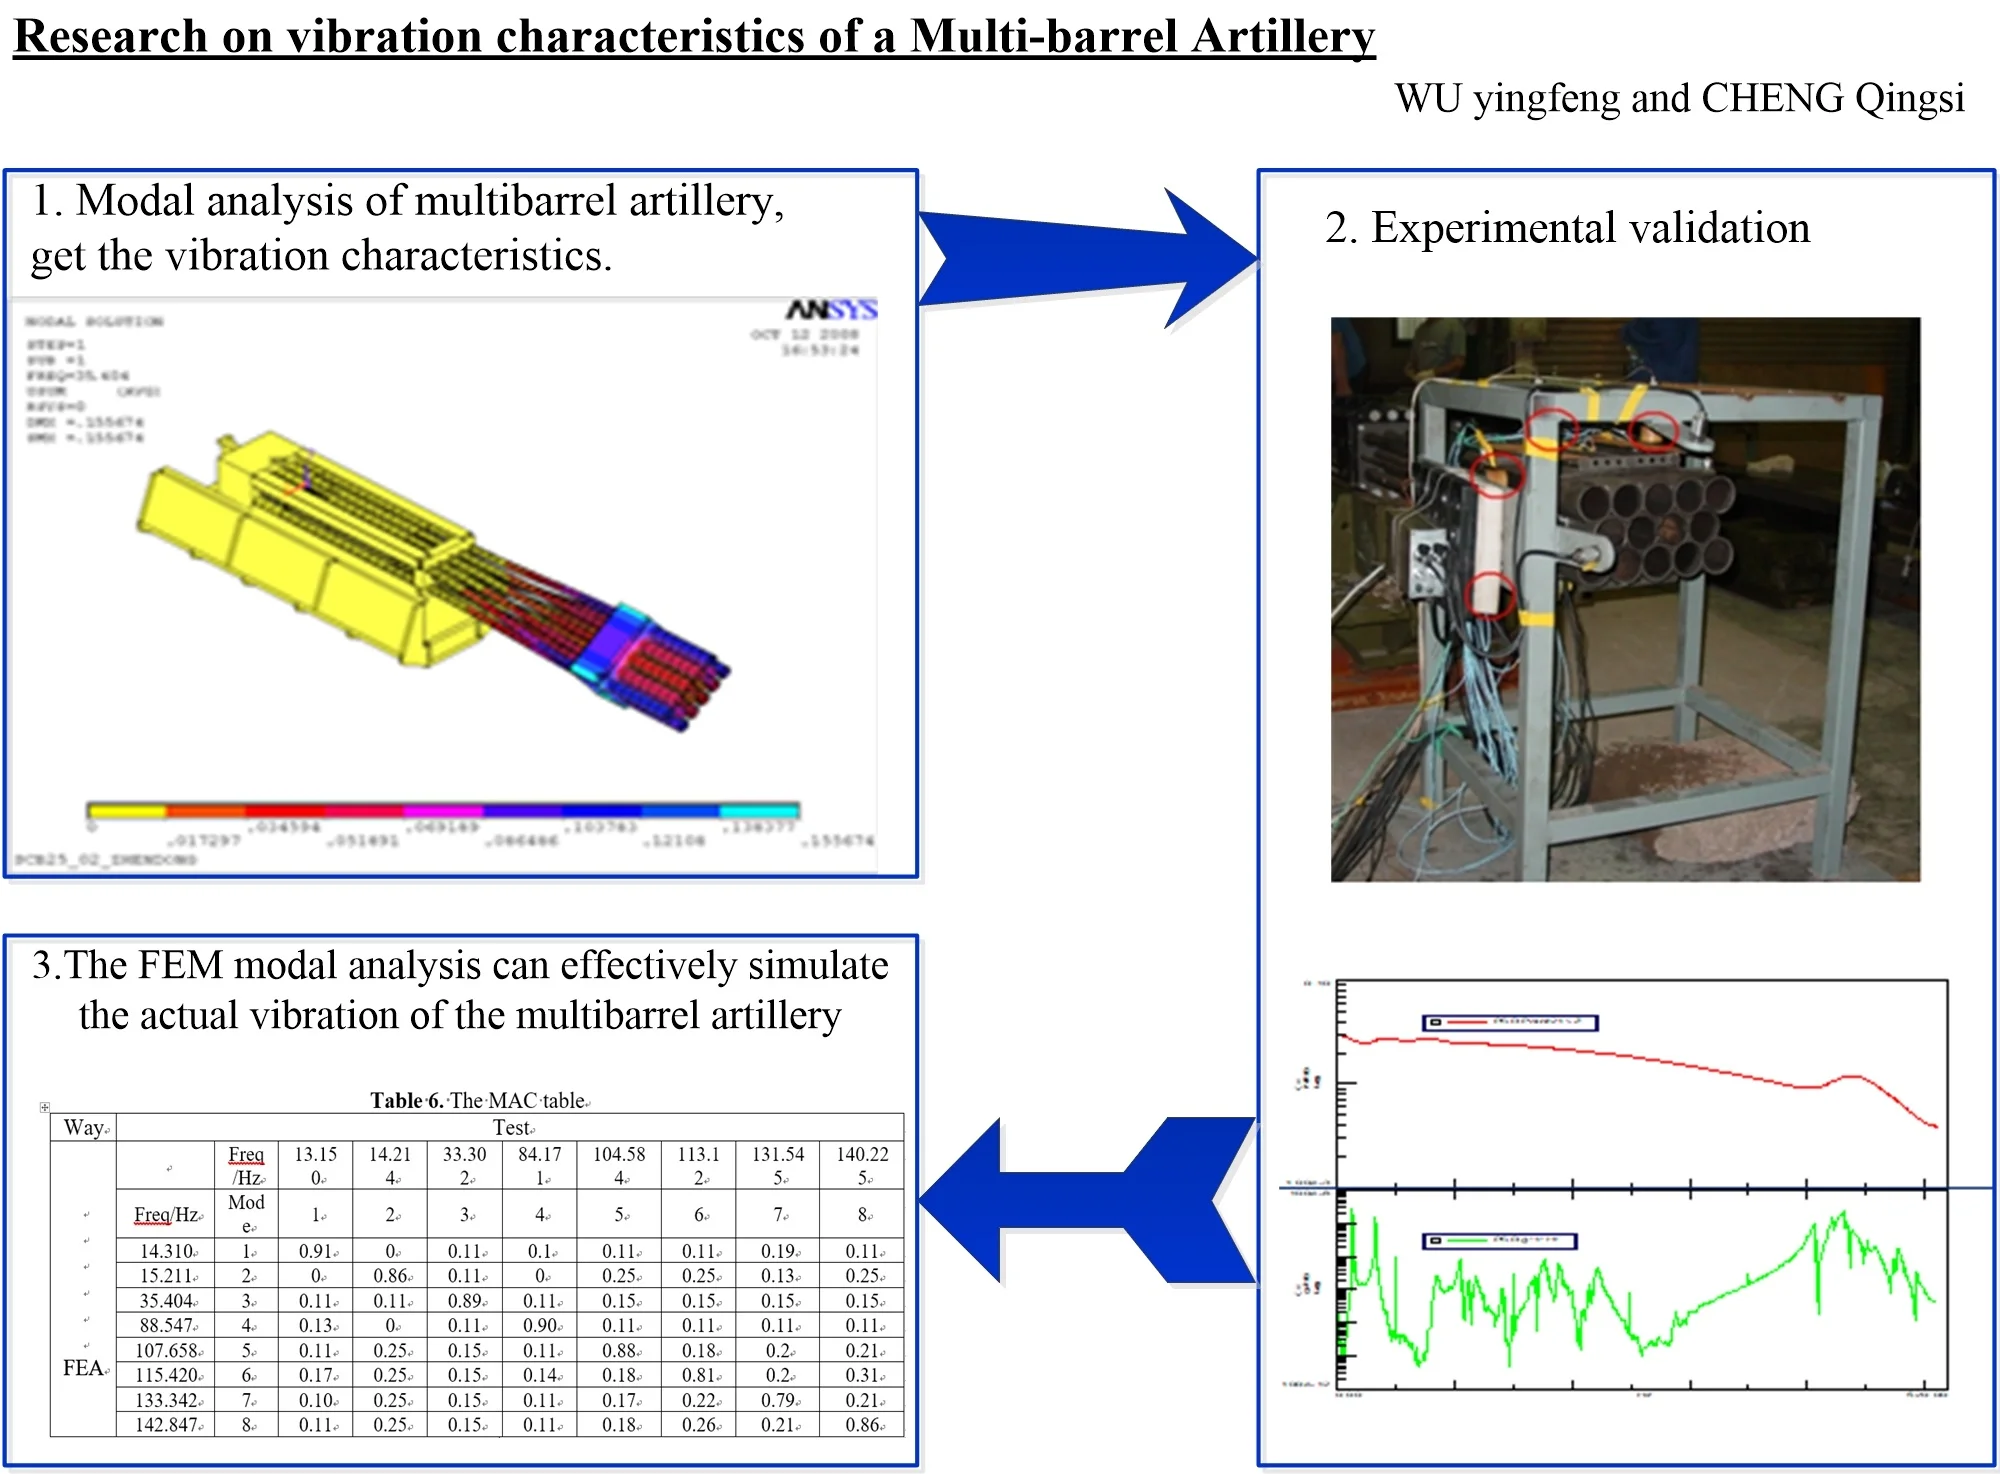
The vibration of the barrel, induced by the interaction with a high-speed moving projectile, has a considerable influence on the shooting accuracy of a weapon. The finite element model of a multi-barrel was established with the goal to investigate its vibration characteristics in this paper, and the natural frequency and mode shape were analyzed by finite element method. To verify the result of finite element modal analysis (FEMA), a modal testing system basis on SC310W multi-path data-collecting system and hammer hitting method was set up. Results show that the low order vibrations of the multi-barrel artillery were mainly vertical, horizontal and torsional vibration, but the local vibration at high orders. The error of natural frequencies between the results obtained by simulation and test was 8.82 % in the first mode frequency and 1.37 % in the eighth. The FEMA can effectively simulate the actual vibration of the multi-barrel artillery.
Highlights
- The low order vibration frequencies, which mainly affect the firing accuracy of the multifubular artillery, were between 14.310 and 35.404.
- The low order vibration of the multifubular was mainly vertical, horizontal and torsional vibration with a large displacement, but the local vibration at high orders.
- The FEM modal analysis can effectively simulate the actual vibration of the multibarrel artillery.
1. Introduction
As a new type of artillery, the multi-barrel artillery has the advantages of high firing frequency, efficient mutilate ability, largest kill area, et al. which make it a hotspot in present research on artillery field. Compared with single-barrel weapons, the multi-barrel artillery has a more complicated yet richer structure, thus the vibration caused by the interaction with a high-speed moving projectile is also more complex. The vibration of barrel has a significant effect on firing accuracy, which has been a classical problem concerned for long time due to particularity of the shock excitation and complexity of the mechanism system [1-5].
In recent years, much research has examined the vibration characteristics of multiple tube launcher. Wei et al. [6] studied the relationship between the vibration and intensity of the launcher based on theory and practice. Lee [7] described the relationship between barrel vibration and projectile dispersion. To study the influence of structure parameters of the launcher on muzzle vibration, Ma [8] simplified the launcher to a 9 DOF system with five parts, and the effect of structure parameters on muzzle vibration displacement was discussed then. In fact, the dynamic equation of multi-body system should be established to analyze the structure parameters of the launcher on muzzle vibration. Chen and Yang et al. [9, 10] established the 24 DOF kinematics model by using Kane method. Rui [11] studied the vibration characteristics of long range multiple launch rocket system by using transfer matrix method of multi-body system. Cui [12] developed the rigid-flexible coupling model of the multiple rocket launcher and proposed a technical scheme to reduce the vibration of directors. Wang [13] acquired the dynamic features of main component and multi-tube rocket launcher and determined the component which has greatest contribution to reduce initial disturbance.
In previous studies, the vibration characteristics of multi-barrel artillery have been largely limited. Therefore, the vibration characteristics of multibarrel artillery were investigated based on theory and test in this paper. The organization of the paper is as follows. The mode analysis theory is introduced in Section 2. Modeling and simulation of the multi-barrel artillery are presented, and then the results are analyzed in Section 3. A detailed description of modal testing and analysis of test results are provided in Section 4. Finally, the conclusions are summarized in Section 5.
2. Theory of modal analysis [14-18]
The FRF matrix describes the multiple-input/multiple-output relationship of a structure at each spectral line. In the modal analysis area, assuming linear and time invariant systems, the FRF matrix of an -degree of freedom system can be expressed as:
where , and are × mass matrix, damping matrix and stiffness matrix, respectively. , and represent the acceleration, victory, displacement of the note and time-dependent force.
By using the orthogonality of the mode shapes, Eq. (1) can be transformed into the form of uncoupling between the coordinates:
where is the mode shape matrix, the displacement column vector of the modal coordinate. Substituting Eq. (2) into Eq. (1):
The motion equation of th mode coordinate is:
In modal coordinates, the variables of the differential equation are separated, and each equation is equivalent to a single-degree-of-freedom equation of motion. The Eq. (4) can be rewritten as follows:
It is assumed that the force only acts on the physical coordinate degree of freedom, that is:
The Eq. (5) can be expressed as:
The Fourier transformation of Eq. (6) is described as:
where is the modal frequency, the modal damping ratio, , are Fourier transform of and respectively:
Combining with Eq. (2) and Eq. (8), the Fourier transform of the response at the th DOF of the physical coordinates is:
where is the Fourier transform of .
The frequency response function of point with the excitation at p point derived from Eq. (9) is:
The frequency response function matrix of the structural system can be obtained by combination the frequency response function between any two physical coordinate degrees of freedom:
The Eq. (11) contains the all the modal parameters of the system. Hence, we can identify all the modal parameters as long as the frequency response function matrix of any row or column is measured.
3. Numerical examples
3.1. The finite element model
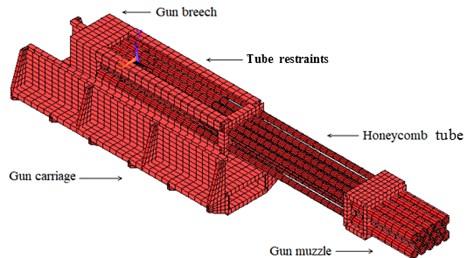
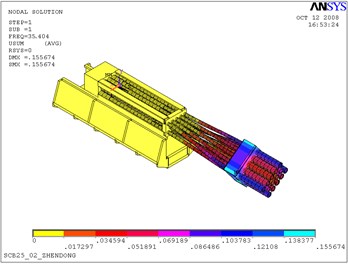
The multi-barrel artillery model mainly includes parallel barrels, barrel restrains, gun muzzle, breech and carriage. The model analyses were performed using finite element package ANSYS [19-21]. The finite element mesh is shown in Fig. 1.
Fig. 1The FE model of multi-barrel artillery
3.2. Simulation results
The modal analysis of the multi-barrel artillery model was carried out, the first 8 natural frequencies and modal shapes were obtained, as shown in Table 1.
From Table 1 and Fig. 2, it is clear that the first three natural frequency is low, and theoretical calculated values are, respectively, 14.310 Hz, 15.211 Hz, 35.404 Hz. The first three mode shapes are vertical vibration, horizontal vibration and torsional vibration, respectively. These three types of vibrations have a significant influence on the firing accuracy of artillery. Thus, the firing frequency of artillery should avoid these three frequencies. The vibrations above fourth order appear as the high order vibration and the local vibration whose influence on the muzzle disturbance is relatively small.
Table 1First 8 natural frequencies and modal shapes
Mode | Frequency / Hz | Modal shape |
1 | 14.310 | Vertical vibration |
2 | 15.211 | Horizontal vibration |
3 | 35.404 | Torsional vibration |
4 | 88.547 | 2nd vertical vibration |
5 | 107.658 | High order vibration |
6 | 115.421 | Local vibration |
7 | 133.342 | Local vibration |
8 | 142.847 | Local vibration |
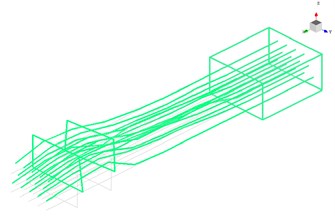
Fig. 2The first 3 modal shapes
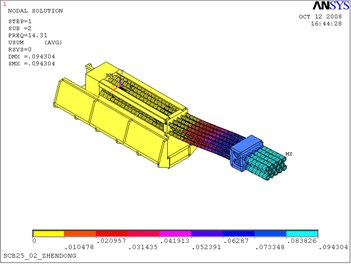
a) The first modal shape
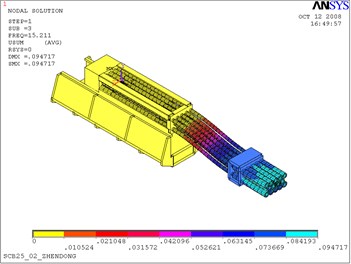
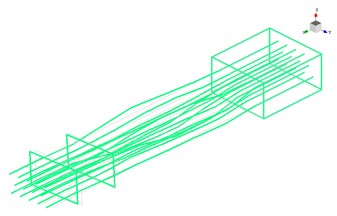
b) The second modal shape
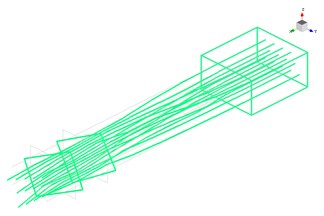
c) The third modal shape
4. Experimental validation
4.1. Modal test scheme
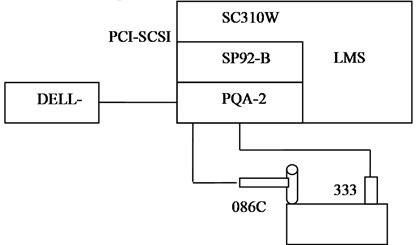
The hammering method was used in the modal analysis of a multi-barrel artillery, and the modal analysis system is shown in Fig. 3.
The modal test system of the artillery consists of SC310W multi-path data-collecting system, PCB333B30 accelerometer, 086C04 hammer, A/D converter, SP92-B signal processing module, PQA-2 signal conditioner, PCI-SCSI interface card and DELLP490 workstation, etc.
Fig. 3Block diagram of modal experimental system of a multi-barrel artillery
PCB333B30 accelerometers were installed at the predetermined point of the artillery, 143 test points were selected and 20 accelerometers deployed in turn, as shown in Fig. 4. The predetermined excitation points on the artillery were hit by hammer. To save testing time, the impact point was a fixed position. The response signals and spectra of impacting prompt power and vibration acceleration and their frequency response functions were obtained by “LMS desktop” data acquisition and modal analysis software. The sampling parameters of modal test were showed in Table 2.
Fig. 4Distribution of test points
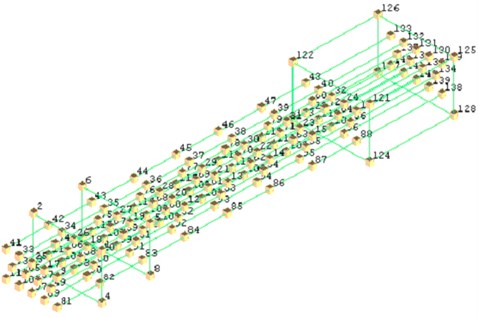
Table 2Sampling parameters of modal test
Parameters | Value |
Spectral range | 512 Hz |
Sample frequency | 1024 Hz |
Sample interval | 0.996 ms |
Number of sample | 2048 |
Sample length | 2 s |
Frequency resolution | 1/ 0.5 Hz |
Number of spectral line | 1024 |
Average number | 4 |
Exciting point | 1 point |
The vibration test scheme for multi-barrel artillery was designed according to its structure feature. A1, A5, C1, C5 were selected for barrel displacement test by displacement sensors due to the symmetry of the barrel group. Non-contact eddy current displacement sensors were used for muzzle vibration test [22-23], as shown in Fig. 5.
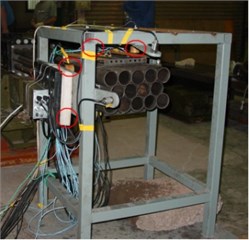
Fig. 6 exhibits the experimental setup, the eddy current displacement sensors were circled in red.
Fig. 5Forced vibration test scheme of multibarrel artillery
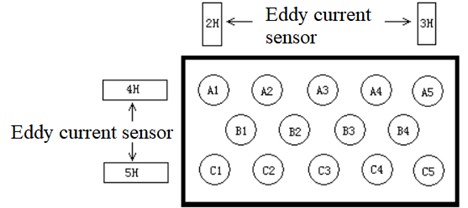
Fig. 6Experimental setup
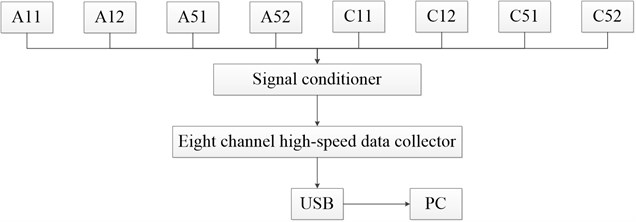
The data were collected in parallel by an eight-channel high-speed data acquisition system, and sampling frequency is 1024 Hz per channel. Fig. 7 illustrates the schematic diagram of data collection.
Fig. 7The schematic diagram of data collection
4.2. Results
Fig. 8 shows the acceleration of vibration between the excitation force signal and a measuring point.
Fig. 8Impacting prompting power (upper) and response of vibration acceleration (lower)
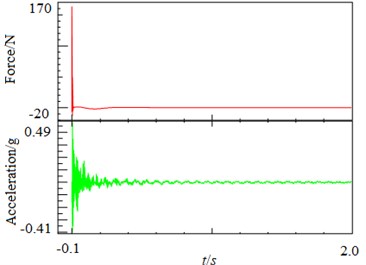
Fig. 9 shows the spectrum of shock excitation force and vibration acceleration response.
The measurement of frequency response function is the key to vibration modal analysis, the coherence function should always be checked in the measurement of frequency response function. Generally, the frequency response function measured is considered valid when the coherence function near the frequencies is above 0.9. Fig. 10 presents the amplitude-frequency and the coherence function of the frequency response function, the result shows that the test data is acceptable.
According to the frequency response data obtained from measurement, the steady-state parameters of the artillery structure were obtained based on the software of LMS desktop. Then the vibration frequencies were predicted according to the stability principle and test results. And finally, the modal parameters of each order were identified by using the method of real modal integral curve fitting based on the modal frequencies predicted. The first 8 natural frequencies and first 3 modal shapes were obtained by this method, as shown in Table 3 and Fig. 11.
Fig. 9Spectrum of impacting prompting power (upper) and response spectrum of vibration acceleration (lower)
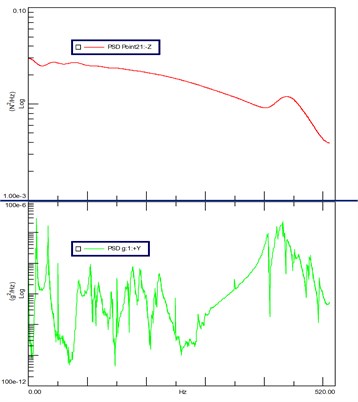
Fig. 10Amplitude-frequency curve of frequency response function (upper) and the coherent function (lower)
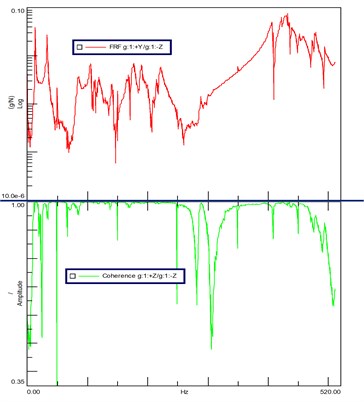
Table 3First 8 natural of test results
Mode | Frequency / Hz | Modal shape |
1 | 13.150 | Vertical bending vibration |
2 | 14.214 | Horizontal vibration |
3 | 33.302 | Torsional vibration |
4 | 84.171 | 2nd vertical bending vibration |
5 | 104.584 | Local vibration |
6 | 113.129 | Local vibration |
7 | 131.545 | Local vibration |
8 | 140.225 | Local vibration |
Table 4Comparison of first 8 natural frequencies between FEMA and test results
Mode | Frequency / Hz | Relative error | |
FEA | Test | ||
1 | 14.310 | 13.150 | 8.82 % |
2 | 15.211 | 14.214 | 7.01 % |
3 | 35.404 | 33.302 | 6.31 % |
4 | 88.547 | 84.171 | 5.2 % |
5 | 107.658 | 104.584 | 2.94 % |
6 | 115.421 | 113.129 | 2.02 % |
7 | 133.342 | 131.545 | 1.37 % |
8 | 142.847 | 140.225 | 1.87 % |
From Fig. 11 it clear that the first three mode shapes identified by modal test are agreement with the simulation results. The comparison of first 8 natural frequencies between FEMA and modal test demonstrates in Table 4. It is obvious that the relative error decreases with the increase of modal orders, the relative error is 8.82 % in the first mode frequency and 1.37 % in the eighth. The results of simulation agree well with that of tests.
Further analysis of the natural frequency error between FEMA simulation and modal test by introducing modal assurance criteria (MAC), which can be expressed as:
The data were analysed by the Eq. (12), and the MAC table are given in Table 6.
Fig. 11First 3 modal shapes based on test results
a) The first modal shape
b) The second modal shape
c) The third modal shape
Table 6The MAC table
Way | Test | |||||||||
FEA | – | Frequency / Hz | 13.150 | 14.214 | 33.302 | 84.171 | 104.584 | 113.12 | 131.545 | 140.225 |
Frequency / Hz | Mode | 1 | 2 | 3 | 4 | 5 | 6 | 7 | 8 | |
14.310 | 1 | 0.91 | 0 | 0.11 | 0.1 | 0.11 | 0.11 | 0.19 | 0.11 | |
15.211 | 2 | 0 | 0.86 | 0.11 | 0 | 0.25 | 0.25 | 0.13 | 0.25 | |
35.404 | 3 | 0.11 | 0.11 | 0.89 | 0.11 | 0.15 | 0.15 | 0.15 | 0.15 | |
88.547 | 4 | 0.13 | 0 | 0.11 | 0.90 | 0.11 | 0.11 | 0.11 | 0.11 | |
107.658 | 5 | 0.11 | 0.25 | 0.15 | 0.11 | 0.88 | 0.18 | 0.2 | 0.21 | |
115.420 | 6 | 0.17 | 0.25 | 0.15 | 0.14 | 0.18 | 0.81 | 0.2 | 0.31 | |
133.342 | 7 | 0.10 | 0.25 | 0.15 | 0.11 | 0.17 | 0.22 | 0.79 | 0.21 | |
142.847 | 8 | 0.11 | 0.25 | 0.15 | 0.11 | 0.18 | 0.26 | 0.21 | 0.86 | |
From Table 6, it is clear that the MAC value on the diagonal line is 1, which indicates that the two methods have a good linear relationship in the same order, that is, the finite element model can better approximate the real situation of the test system and reflect the actual vibrational state. The FEMA can effectively simulate the actual vibration of the multi-barrel artillery.
5. Conclusions
The 3D finite element model of a multi-barrel artillery was established, and its natural frequency and mode shape were simulated. A modal testing system basis on SC310W multi-path data-collecting system and hammer hitting method was set up to verify the simulation results. Conclusions are as follows:
1) The low order vibration frequencies, which mainly affect the firing accuracy of the multifubular artillery, were between 14.310 Hz and 35.404 Hz. The low order vibration of the multifubular was mainly vertical, horizontal and torsional vibration with a large displacement, but the local vibration at high orders.
2) The FEM modal analysis can effectively simulate the actual vibration of the multibarrel artillery, and has higher accuracy in high order vibration frequency.
References
-
He J. Analysis of Firing Stability of a Self-Propelled Antiaircraft Gun. Nanjing University of Science and Technology, 2007.
-
Bi S., Li X., Rong, et al. Dynamics of multiple rocket launching system taking into consideration flexibility of the directional tube. Acta Armamentarii, Vol. 21, 2000, p. 2-5.
-
Zhang H., Di C. Analysis of vibration modal of a multibarrel cannon. Acta Armamentarii, Vol. 29, Issue 12, 2008, p. 1514-1517.
-
Wang L., Ma D., Yu C., et al. Study on improvement firing density of multiple rocket launcher. Fire Control and Command Control, Vol. 37, Issue 4, 2012, p. 18-20.
-
Xu L., Zhang G., Zhang B., et al. The modal analysis of a MLRS based on FEM. Journal of Projectile and Guidance, Vol. 30, Issue 6, 2010, p. 110-111.
-
Jones N. W. Application of simulation to the evolution of weapon system performance. Summer Computer Simulation Conference, 1986.
-
Kim S. S., Haug E. J. A recursive formulation for flexible multibody dynamics, part 1: open-loop systems. Computer Methods in Applied Mechanics and Engineering, Vol. 71, Issue 3, 1988, p. 293-314.
-
Ma C., Sun F., Li K., et al. A prediction on the dispersion accuracy of the gun-vehicle system in self-propelled AAA on fire. Acta Armamentarii, Vol. 23, Issue 2, 2002, p. 251-254.
-
Chen Y., Yang G. Research on Kane method modeling of self-propelled gun dynamics. Journal of Gun Launch and Control, Vol. 1, 1996, p. 1-4.
-
Cai W., Chen Y., Yang G. Impacts of structural parameters on muzzle disturbance for a vehicle mounted howitzer. Journal of Nanjing University of Science and Technology, Vol. 29, Issue 6, 2005, p. 658-661.
-
Rui X., Wang G., Yun L., et al. Study of the vibration characteristics of LRMLRS. Journal of Vibration and Shock, Vol. 24, Issue 1, 2005, p. 8-12.
-
Cui E., Yu C., Chang J. Research on reducing vibration of directors of multiple rocket launcher during launching. Machine Building and Automation, Vol. 44, Issue 2, 2015, p. 14-17.
-
Wang G., Li Z., Wei H. Study on the match of natural frequency for certain type multi-tube rocket launcher. Ordnance Industry Automation, Vol. 33, Issue 12, 2014, p. 18-21.
-
Fu Z., Hua H. Theory and Application of Modal Analysis. Shanghai Jiao Tong University, 2000.
-
Reynders E., Roeck G. D. Subspace identification for operational modal analysis. New Trends in Vibration Based Structural Health Monitoring, Vol. 520, Issue 4, 2010, p. 55-106.
-
Reynders E. System Identification methods for (operational) modal analysis: review and comparison. Archives of Computational Methods in Engineering, Vol. 19, Issue 1, 2012, p. 51-124.
-
Maia N. M. M. Theoretical and experimental modal analysis. BMC Public Health, Vol. 13, Issue 1, 1997, p. 1-5.
-
Sun J. The Research of Experimental Modal Analysis Methods Based on Ambient Vibration. Harbin Institute of Technology, 2006.
-
Boyi APDL Parameters Finite Element Analysis Technology and Its Application Case. China Hydraulic, 2004.
-
Gong S., Xie G. ANSYS Operation Command and Parametric Programming. China Machine, 2004.
-
Ye X., Shi Y. ANSYS Engineering Analysis Software Application Examples. THU Tsinghua University, 2003.
-
He Y., Luo F., Pan M., et al. Defect edge identification with rectangular pulsed eddy current sensor based on transient response signals. NDT&E International, Vol. 43, Issue 5, 2010, p. 409-415.
-
Engelberg T., Mesch F. Eddy current sensor system for non-contact speed and distance measurement of rail vehicles. WIT Transactions on The Built Environment, Vol. 50, 2000, p. 1261-1270.
About this article

This work is supported by the program of Hubei Superior and Distinctive Discipline Group of “Mechatronics and Automobiles” (Grant No. XKQ2019011)
