Abstract
Aiming at large-scale offshore wind turbine blades, governing equations in fluid domain and motion equations in structural domain with geometric nonlinearity were built by the aid of ALE method. A three dimensional model under fluid-structure interaction (FSI) was established by using UG software and Geometry module, and numerical calculation for FSI vibration characteristics of wind turbine blades under the effects of wind shear and fluctuating wind was carried out based on ANSYS Workbench. The results indicate that the contribution of the combined action to displacement and Mises stress chiefly derives from the wind shear effect, which not only causes a comparatively larger increase for the maximum displacement and Mises stress, but also becomes bigger and bigger with the increase of average wind speed, and the fluctuating wind effect is insignificant. The maximum value of Mises stress in the blade section appears at the relative wingspan of 0.55, the maximum Mises stress varying with relative span length decreases progressively from the middle to both sides of the blade, and the contribution of wind shear effect alone, the combined action or wind speed increment to stress also shows the same change rule. Furthermore, in the maximum stress section along wingspan, Mises stress along the direction of blade thickness or chord length respectively presents two distribution laws, and reaches the maximum on the blade surface.

Highlights
- A theoretical model including FSI was established for wind turbine rotating blades.
- The dynamic responses under four conditions were analyzed.
- Dynamic characteristics under the combined action or only wind shear were carried out.
- Results provide references for reliability operation and optimal design of blades.
1. Introduction
The core part of the wind turbine to capture wind energy is regarded as the blade, which is a kind of flexible slender body with long wingspan and short wing chord. Hence, the blade subjected to wind load is prone to fluid-structure interaction (FSI) vibration and even destruction [1]. With the large-scale development of offshore wind turbines, the load acting on the blades will increase dramatically, and within the scope of blade diameter, wind shear formed by the friction between barriers like sea wave and tower foundation, etc., vortex, and atmospheric viscosity will be further obvious, as well as atmospheric turbulent motion, which brings more uncertainty to the reliable operation of wind turbine blades [2]. Therefore, it is of great practical significance to explore the dynamic characteristics of blades under wind shear and fluctuating wind.
For wind-induced vibration characteristics of wind turbine blades under different wind loads, some researches were conducted by a variety of methods. Kim et al. [3] used a numerical method to analyze the effects of blade flexibility on aerodynamic noise by considering FSI. Jeong et al. [4] described the torsional stiffness effects on the dynamic stability of the wind turbine blades under FSI. Toshimitsu et al. [5] explored the effects of turbulent intensity on performance of a horizontal axis wind turbine by wind tunnel tests. Tran et al. [6] aimed at a floating offshore wind turbine experiencing platform to reveal the unsteady aerodynamic characteristics of the rotating blades with the platform pitching and yawing motions. Nilay et al. [7] investigated the effect of steady and transient freestream wind shear on the wake structure and performance characteristics of a horizontal axis wind turbine rotor. Dai et al. [8] proposed a set of calculation method of aerodynamic loads for large scale wind turbines under the condition that some influence factors such as wind shear, tower, tower and blade vibration were considered. Wang et al. [9] discussed the effects of wind shear and wind shear coefficients on the near wake of a wind turbine. Kou et al. [10] focused on the change of vibration stress of a real fan blade when its rotational speeds are at and nearby critical speeds. Zhang et al. [11] made a contrastive analysis on the contribution of unidirectional FSI and bidirectional FSI to dynamic response of offshore wind turbine blades under wind shear effect.
It can be found by the analysis of the above literature that the research on wind-induced vibration characteristics of wind turbine blades under FSI is still in a preliminary stage so far. There are some researches involved in wind shear effect or turbulence effect, but in most of those, the operation condition of the blade is simplified to the static one, which cannot accurately reflect the dynamic characteristics of wind turbine blades under actual working condition. In view of this, the influences of wind shear and fluctuating wind on the vibration characteristics of offshore large-scale wind turbine blades are studied in this work, which can provide a theoretical basis for reliability operation and optimal design of wind turbine blades.
2. Theory model
2.1. Physical model under FSI
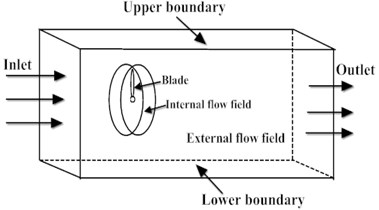
In order to effectively avoid the deficiency that wind tunnel test can only be based on scale model, and really reflect the interaction between the blade structure of wind turbine and the surrounding flow field, a FSI physical model at the same proportion with the actual blades was established in this work. When considering the rotating state of blades, a rotating internal flow field was set in the blade periphery. Meanwhile, due to the influence of upstream wind turbine on the downstream one, the length of inflow region in external flow field is twice that of the blade, and the length of wake region is six times that of the blade, as shown in Fig. 1.
Fig. 1Physical model under FSI
2.2. Governing equations of fluid domain and structure domain
In the numerical calculation of FSI, Lagrange coordinate system focuses on the motion of material points in solid mechanics and Euler coordinate system concentrates on the state of space points in fluid mechanics. In order to solve the disunity problem of coordinate system at motion interface between fluid domain and solid domain, is represented as the universal variable, which stands for the velocity components , , in three-dimensional coordinates, so the fluid governing equations built by ALE method can be written as [12]:
where is the air density. For the continuity equation, 1. For the momentum equation, , where and stand for speed components in each direction, and the indexes of , range from 1 to 3. For the two-equation - turbulence model, . and , which are ascertained according to , are respectively the generalized diffusion coefficient and generalized source term.
With FSI and wind shear effect taken into account, Eq. (1) is solved by iteration computation to obtain the velocity field which satisfies with the continuity equation, so that the wind pressure distribution on the blade surface is calculated.
In consideration of FSI, the blade motion equations with geometrical nonlinearity can be expressed as [13]:
where , , are the stress tensor, displacement vector and material density respectively, and is a vector related to the wind pressure distribution.
The constitutive equation and geometric equation for a geometrically nonlinear elastomer can be respectively written as:
where , are respectively represented as the shear modulus and Lame coefficient, and is the unit tensor.
2.3. Calculation of wind shear and fluctuating wind speed
Wind shear refers to the wind variation rule and characteristics in the vertical direction in the field of wind power application. Generally, the exponential distribution of experience is used to describe the changing law of the average wind speed near surface layer with the height, and distribution function is defined as [14]:
where is the wind speed at a vertical height above ground, and 120 m 183 m in this work is obtained by assuming that the height from ground to wheel hub is 120 m and the blade length is 63 m. is the average wind speed at the standard reference height , and is generally set as 10 m. is the empirical shear coefficient associated with atmospheric stability and surface roughness, with a general value of 0.12 for offshore seas, islands, coasts, lakeshore and desert regions [15].
The instantaneous wind speed replaced by random fluctuating one is employed to simulate atmospheric turbulence motion. The wind speed (, , , ) at any point (, , ) on the structure can be expressed by the sum of fluctuating wind speed (, , , ) and average one , namely:
Davenport spectrum adopted widely in engineering is applied to reveal the characteristics of fluctuating wind, and the expressions of power spectrum density are given as [16]:
where is the power spectrum density of fluctuating wind at the pulsating frequency , is the average wind speed at the standard reference height of 10 m, and is the ground roughness coefficient which is selected as 0.0042 according to empirical shear coefficient [17].
The speed Fourier spectrum is obtained by using the speed power spectrum and the coherent function of a point, and then the values of fluctuating wind speed are eventually computed by inverse transformation. According to the calculation formula of Davenport spectrum, fluctuating wind speed is simulated by the programming of user defined function (UDF) in MATLAB software. When the frequencies of fluctuating wind with 11.4 m/s and 19.8 m/s are taken as 0.01 Hz and 0.015 Hz respectively, the time-history responses of instantaneous wind speed are shown in Fig. 2.
Fig. 2Time-history responses of instantaneous wind speed
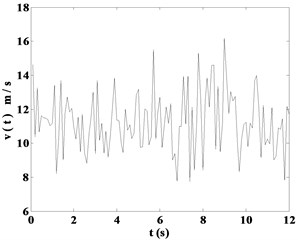
a) 11.4 m/s
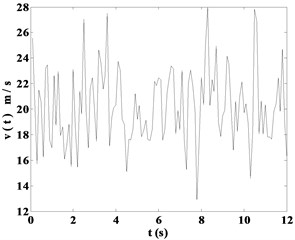
b) 19.8 m/s
3. Entity modeling and mesh generation
3.1. Entity modeling and parameter setting
Considering the wind field condition of large-scale offshore wind turbines, external flow field model at the same proportion with the actual wind field was established in this work. The three-dimensional model of the blade and fluid domain was built by using UG and Geometry module, as displayed in Fig. 3.
3.2. Grid division and independent validation
Grid generation of entity model is the process of discretization of the solution area, and lays the foundation for numerical solution. The shape, size and method of grid generation have a direct impact on the grid quality, thus affecting the accuracy of the numerical calculation process. Based on the actual computational requirements, the tetrahedral mesh is adopted, and the finite element grids of fluid domain were obtained by dynamic mesh technique with ICEM software, as shown in Fig. 4.
Fig. 3Three-dimensional model of fluid domain and structure domain
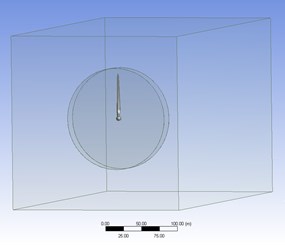
Fig. 4Grid generation of fluid domain
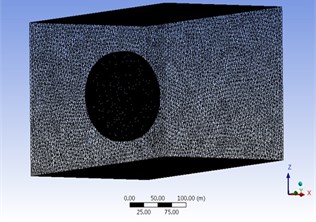
a) External flow field
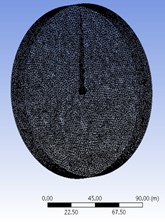
b) Internal flow field
Here to validate the mesh independence of 3D FSI model under rated conditions, the results are listed in Table 1. It can be seen that accurate results can be obtained by using 862496 meshes in fluid domain and 61522 meshes in structure domain, thereby this kind of mesh division is used here to save computational resources.
Table 1Grid-independent validation of computational domain
Region | Grid unit number | Grid node number | Maximum displacement (m) | Relative error (%) |
Structure domain | 61522 | 17448 | 1.74375 | – |
129747 | 35409 | 1.72751 | 0.93 | |
281797 | 78817 | 1.7115 | 0.93 | |
Fluid domain | 862496 | 1216773 | 1.74375 | – |
1239714 | 1749178 | 1.7719 | 1.61 | |
1829900 | 2579888 | 1.78223 | 0.58 |
4. Reliability validation
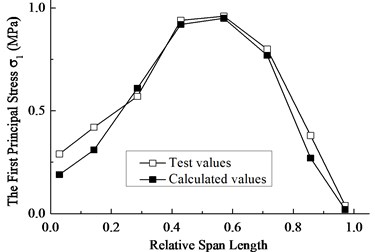
In order to verify the reliability of theoretical and numerical models, the wind tunnel test for the scale model of a 5 MW wind turbine blade was conducted, and then the scale model was introduced into the bidirectional FSI calculation program of this study. At the wind speed of 15 m/s, the distribution of the first principal stress on the blade surface along the wingspan is compared with the experimental result, as shown in Fig. 5. As can be seen, the calculated values are in good agreement with the experimental ones, thus ensuring the precision of the subsequent numerical calculation of the FSI.
Fig. 5Comparison of the first principal stress along the wingspan at 15 m/s
5. Numerical results and discussions
5.1. Wind shear effect
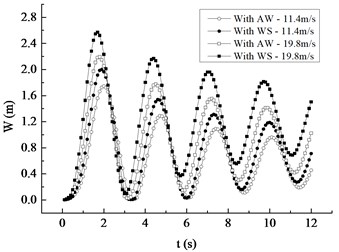
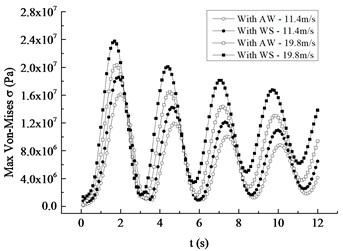
For the blade under the rated rotating speed and the average wind speed of 11.4 m/s or 19.8 m/s, the comparisons of displacement response and stress response with the wind shear considered or not are respectively carried out, and the corresponding four kinds of working conditions are recorded as Condition I, II, III and IV. Fig. 6 depicts comparative response curves of maximum displacement and Mises stress along the blade wingspan under four conditions. The following can be easily concluded.
1) Response curves of displacement and stress under four conditions all present a nonlinearly attenuation trend. The decay rates of the response curves of Condition I and Condition II are similar, and Condition III and Condition IV are also the case, indicating that the influence of wind shear on the attenuation of the vibration curve is small.
2) From Condition I to IV, the maximum displacement and stress occur at the time of 2.0 s, 1.9 s, 1.8 s and 1.7 s respectively, and the corresponding maximum values of displacement are respectively 1.74 m, 2.00 m, 2.19 m and 2.57 m, while the ones of stress are respectively 16.11 MPa, 18.56 MPa, 20.32 MPa and 23.75 MPa, showing that wind shear effect causes the maximum values of displacement and stress to advance by 0.1 s and the increase of average wind speed makes them occur ahead of 0.2 s.
3) The maximum displacement and Mises stress under Condition II increase by 14.94 % and 15.21 % respectively compared with those under Condition I. Meanwhile, the maximum displacement and Mises stress under Condition IV increase by 17.35 % and 16.88 % respectively compared with those under Condition III. The two sets of data both show that wind shear contributes a lot to the vibration characteristics of wind turbine blades, so wind shear effect should be paid more attention to during the design of large-scale offshore wind turbines.
4) By comparing the first and second sets of data in 3), it can be seen that as the wind speed increases from 11.4 m/s to 19.8 m/s, the contribution of wind shear to maximum displacement increases from 14.94 % to 17.35 %, and the contribution to maximum Mises stress increases from 15.21 % to 16.88 %, implying that the wind shear effect becomes more remarkable with increasing average wind speed.
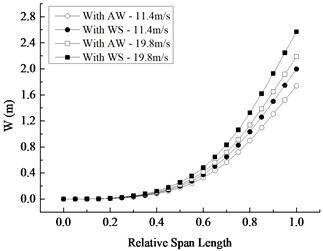
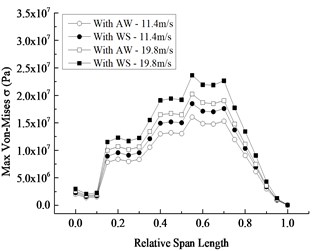
At the corresponding moments when the displacement and Mises stress under four conditions reach the maximum respectively, the maximum displacement and Mises stress of the blade section along the wingspan are displayed in Fig. 7. It is clear that:
1) The maximum displacement along the wingspan increases nonlinearly and reaches the maximum at the blade tip, and the maximum Mises stress at the relative wingspan of 0.55 runs up to the maximum and reduces basically towards each end of the blade.
2) On account of the existence of stress concentration on the joint between wheel hub and blade, the extreme stress value occurs in the blade root. From the relative wingspan of 0.15 to 0.7, the blade stress is comparatively large and multiple stress extremes appear, owing to the fact that DU airfoils with different thickness result in the change of flexural section coefficients. While from the relative wingspan of 0.7 to 1.0, Mises stress along wingspan decreases smoothly, which is attributed to using airfoil named NACA64_A17 in this region.
3) After comparing Condition I with II and comparing Condition III with IV, it is identified that displacement difference increases in the direction of the wingspan and reaches the maximum at the blade tip, while stress difference is up to the maximum near the blade central section and basically decreases along both sides of the blade, meaning that the contribution of wind shear to displacement is further greater along wingspan and the contribution to stress from the middle to each end of the blade generally decreases gradually. Furthermore, both the displacement difference and the stress difference with wind shear effect or not increase with wind speed, which also suggests that wind shear effect is more apparent when the average wind speed is larger.
4) By comparing Condition I with III and comparing Condition II with IV, it is found that whether wind shear effect is considered or not, the displacement difference and the stress difference both present the same rule with those described in (3), indicating that the contribution of wind speed increment to displacement increases along wingspan and the contribution to stress reduces from the blade middle to each end. In addition, the displacement difference and the stress difference with wind shear are both greater than those without wind shear, showing that the increase of average wind speed in consideration of wind shear effect contributes more to displacement and stress.
Fig. 6Comparative curves under four conditions
a) Displacement response
b) Mises stress response
Fig. 7Changing curves with relative span length
a) Maximum displacement distribution
b) Maximum Mises stress distribution
5.2. The combined action of wind shear and fluctuating wind
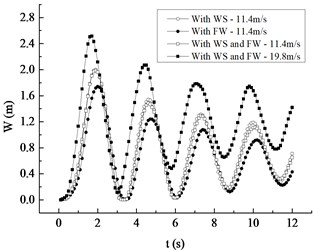
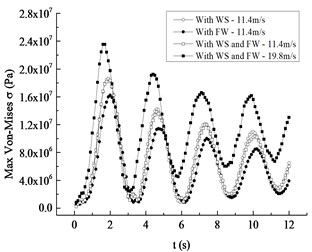
Aiming at the rated rotating speed, response curves of displacement and Mises stress for the blade under average wind speed of 11.4 m/s with the wind shear alone, the fluctuating wind alone or the combined action and under average wind speed of 19.8 m/s with the combined action are respectively plotted in Fig. 8, and the corresponding four working conditions are renamed Condition I, II, III and IV. It is not difficult to see that:
1) Response curves of displacement and Mises stress under four conditions all show a fluctuating attenuation tendency and the decay rates are nearly the same, implying that the effects of wind shear, fluctuating wind or the combined action on vibration attenuation are almost equal.
2) From Condition I to IV, the moments when displacement and stress are up to the maximum are 1.9 s, 2.0 s, 1.9 s and 1.7 s respectively, the maximum values of displacement are 2.00 m, 1.74 m, 1.99 m and 2.52 m respectively, and the ones of stress are respectively 18.56 MPa, 16.24 MPa, 18.60 MPa and 23.55 MPa. In contrast to Fig. 6, it can be observed that the combined action makes the maximum displacement and stress advance by 0.1s compared with those under only average wind speed effect.
3) The maximum displacement and Mises stress under Condition I increase by 13.00 % and 12.50 % by comparing with those under Condition II, which indicates the effect of wind shear on vibration characteristic is larger than that of considering fluctuating wind separately under the same average wind speed. Besides, the maximum displacement and Mises stress under Condition IV increase by 26.63 % and 26.61 % compared with Condition III, which implies that the increase of average wind speed makes the maximum displacement and Mises stress under the combined action increase comparatively obviously.
4) The maximum displacement, the maximum Mises stress and the response curves during the whole time history under Condition I are very close to those under Condition III, which reveals that the fluctuating wind included in the combined condition has a quite limited effect on the maximum value of displacement and Mises stress. The maximum displacement and Mises stress under Condition III increase by 12.56 % and 12.69 % compared with Condition II, meaning the wind shear included in the combined condition has a relatively evident effect on them.
Fig. 8Comparative curves of the maximum value
a) Displacement response
b) Mises stress response
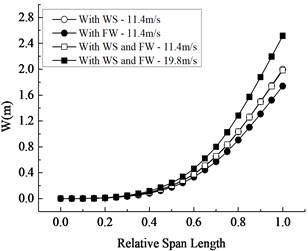
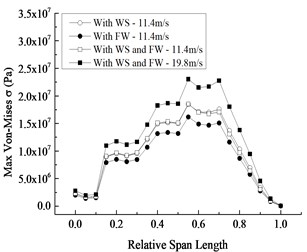
At the moments corresponding to the maximum values of the response curves under four conditions, the maximum displacement and Mises stress in blade section along the wingspan are depicted in Fig. 9, and it can be easily found that:
1) Distribution trends of the maximum displacement and Mises stress in blade section along the wingspan under Conditions III and IV do not change greatly compared with those under Conditions I and II, that is to say, the maximum displacement in the blade section along wingspan increases nonlinearly and reaches the maximum at the tip, and the maximum Mises stress occurs at the relative wingspan of 0.55 and reduces nonlinearly along both sides of the blade, indicating that the combined action has no effect on the distribution trends of displacement and stress.
2) The displacement difference between Condition I and Condition II increases along the wingspan and the corresponding stress difference decreases from the middle to each blade end, showing the effect of wind shear in the whole span is greater than that of fluctuating wind alone. Moreover, by comparing Condition IV with Condition III, it is not difficult to find that the contribution of wind speed increment to the displacement under the combined action increases along the wingspan, while the contribution to the stress decreases gradually from the blade middle to both sides.
3) The distribution curves of the maximum displacement and Mises stress in the blade section along the wingspan under Condition I are almost coincided with those under Condition III, implying that the influence of fluctuating wind in the combined action on the distribution of displacement and stress along the wingspan is very small. Furthermore, by comparing Condition II with Condition III, the displacement difference increases along the wingspan and the stress difference decreases nonlinearly from the middle to each blade end, which reveals that the effect of wind shear in the combined action on the displacement distribution and Mises stress distribution is more obvious.
Fig. 9Variation curves along the wingspan
a) Displacement distribution
b) Mises stress distribution
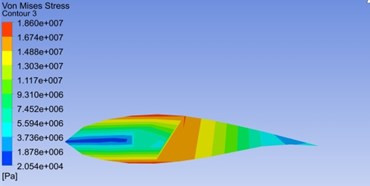
The maximum Mises stress locates at the relative wingspan of 0.55, so the corresponding blade section was selected to carry out the comparative analysis for Mises stress distribution under two kinds of average wind speeds. Under Conditions III and IV, distribution cloud pictures at the moment when Mises stress is up to the maximum are given in Fig. 10, and it can be obtained that:
1) In cross section, one can set the part from the leading edge to the centre as the front half section, and the rest is the back half section. Figs. 10(a) and (b) both show that Mises stress of the front half section presents a gradient distribution in blade thickness direction and reaches the maximum on the blade surface, while the one of the back half section shows a gradient distribution in the blade chord direction and achieves the maximum near the center of chord length, indicating that the front half section is mainly influenced by the wind load in the flapping direction and the back half section is mainly subjected to the wind load in the torsion direction.
2) In the maximum stress section, the corresponding distribution trends of Mises stress under the two wind speeds are nearly accordant, and the maximum value increases with wind speed.
Fig. 10Distribution cloud pictures of Mises stress in the blade cross section
a) 11.4 m/s
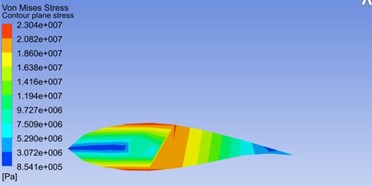
b) 19.8 m/s
6. Conclusions
In this work, the dynamic characteristics of 5 MW offshore wind turbine blades under the combined action of wind shear and fluctuating wind or wind shear alone were simulated and analyzed with FSI and blade rotation considered. The followings can be summarized.
1) Wind shear effect results in a larger increase for the maximum displacement and Mises stress, and grows with average wind speed, while the contribution of the combined action to displacement and Mises stress mostly comes from the wind shear effect.
2) Whether only wind shear effect or the combined action, in the direction of the wingspan, the maximum displacement appears at the tip, while Mises stress reaches the maximum at the relative wingspan of 0.55 and reduces step by step towards both sides of the blade.
3) The contribution of wind shear effect alone or the combined action to displacement increases along the wingspan, the contribution to stress decreases gradually from the middle to each blade end, and in this case, the contribution of wind speed increment to displacement or stress presents the same change rule respectively, while the contribution of fluctuating wind effect can be neglected.
4) Mises stress presents two kinds of stress varying gradient in the maximum stress section along wingspan, and the maximum occurs on the blade surface.
References
-
Muzamil M., Siddiqui M. A., Wu J. Numerical and experimental investigation of wind loadings on vertical axis wind turbine blade deflection. Journal of Mechanical Science and Technology, Vol. 30, Issue 12, 2016, p. 5555-5563.
-
Zhang S. C., Dong X. Q., Wang J. W., Gao Z. Y., Chen T. G., Yang C., Guan F. Experimental research on the pulsation characteristics of wind turbine wake velocity field. Journal of Engineering Thermophysics, Vol. 37, Issue 7, 2016, p. 1432-1437.
-
Kim H., Lee S., Son E., Lee S., Lee S. Aerodynamic noise analysis of large horizontal axis wind turbines considering fluid-structure interaction. Renewable Energy, Vol. 42, Issue 1, 2012, p. 46-53.
-
Jeong M. S., Lee I., Yoo S. J., Park K. C. Torsional stiffness effects on the dynamic stability of a horizontal axis wind turbine blade. Energies, Vol. 6, Issue 4, 2013, p. 2242-2261.
-
Toshimitsu K., Narihara T., Kikugawa H., Akiyoshi A., Kawazu Y. Experimental study of improved HAWT performance in simulated natural wind by an active controlled multi-fan wind tunnel. Journal of Thermal Science, Vol. 26, Issue 2, 2017, p. 113-118.
-
Tran T. T., Kim D. H. The aerodynamic interference effects of a floating offshore wind turbine experiencing platform pitching and yawing motions. Journal of Mechanical Science and Technology, Vol. 29, Issue 2, 2015, p. 549-561.
-
Nilay S. U., Oguz U. Effect of steady and transient wind shear on the wake structure and performance of a horizontal axis wind turbine rotor. Wind Energy, Vol. 16, Issue 1, 2013, p. 1-17.
-
Dai J. C., Hu Y. P., Liu D. S., Long X. Aerodynamic loads calculation and analysis for large scale wind turbine based on combining BEM modified theory with dynamic stall model. Renewable Energy, Vol. 36, Issue 3, 2011, p. 1095-1104.
-
Wang H. P., Zhang B., Qiu Q. G. Numerical study of the effects of wind shear coefficients on the flow characteristics of the near wake of a wind turbine blade. Proceedings of the Institution of Mechanical Engineers Part a-Journal of Power and Energy, Vol. 230, Issue 1, 2016, p. 86-98.
-
Kou H. J., Lin J. S., Zhang J. H. Numerical study on vibration stress of rotating fan blade under aerodynamic load at critical speed. Proceedings of the Institution of Mechanical Engineers Part G: Journal of Aerospace Engineering, Vol. 230, Issue 6, 2015, p. 1044-1058.
-
Zhang J. P., Guo L., Wu H., Ren J. X. The influence of wind shear on vibration of geometrically nonlinear wind turbine blade under fluid-structure interaction. Ocean Engineering, Vol. 84, Issue 4, 2014, p. 14-19.
-
Zhang J. P., Zhang K. G., Zhou A. X., Zhou T. J., Hu D. M., Ren J. X. Analysis of nonlinear dynamic response of wind turbine blade under fluid-structure interaction and turbulence effect. Journal of Engineering for Gas Turbines and Power Transactions of the ASME, Vol. 136, 2014, https://doi.org/10.1115/1.4027965.
-
Zhang J. P., Li Z. N. Dynamic instability of magnetoelastic coupling interactions of cantilever conductive thin plates. Journal of Zhejiang University, Vol. 40, Issue 3, 2006, p. 414-418.
-
Part 1: Design Requirements IEC 61400-1 Wind Turbines. International Electrotechnical Commission (IEC), Germanischer Lloyd, Hamburg, Germany, 2005.
-
Building Structures Specification GB50009-2001. Chinese National Standards (CNS), Building Industry Press, Beijing, China, 2002.
-
Davenport A. G. The spectrum of horizontal gustiness near the ground in high winds. Quarterly Journal of the Royal Meteorological Society, Vol. 188, Issue 376, 1962, p. 194-211.
-
He D. X. Wind Engineering and Industrial Aerodynamics. National Defense Industry Press, Beijing, 2006.
Cited by
About this article
This work was financially sponsored by various research funds including the Program of National Natural Science Foundation of China (11572187); Foundation of Science and Technology Commission of Shanghai Municipality (15110501000, 14DZ2261000, 11DZ2281700).
Jianping Zhang established the theoretical and numerical model of the study. Liang Guo achieved the numerical simulation. Jianping Zhang and Zhen Gong carried out the analysis with constructive discussions and wrote the paper. Xing Zhang and Danmei Hu reviewed and edited the manuscript. All authors read and approved the manuscript.
