Abstract
For the 5MW offshore wind turbine blade, the control and discrete equations of the fluid domain and structural domain were established respectively, and the calculation formulas of blade loads and damping coefficient were given. Furthermore, the blade entity modeling was completed by using UG and ANSYS Workbench. Based on it, the numerical calculation of blade vibration characteristics under different wind and rotating speeds was carried out, and the reliability verification was conducted by the wind tunnel test. The results of calculation indicate that the numerical results of the first principal stresses at the blade surface along the span-wise direction are consistent with the results of wind tunnel test, which verifies the reliability of the theory and numerical models. Both the influences of the bidirectional fluid-structure interaction (BFSI) and the rotation effect on the characteristics of blade vibration should be underlined. The increase of wind or rotating speed results in the nonlinear increase of the maximum span-wise displacement of the blade and of the Mises-stresses. Under different wind or rotating speed, the blade’s maximum displacement occurs at its tip, its maximum Mises-stresses appear at the relative wingspan of 0.55, and the contribution of rotating speed and average wind speed to the displacement or Mises-stress along the span-wise direction is similar.
1. Introduction
As the core component of the wind turbine, the slender and flexible blade is prone to vibration and even large deformations under the wind load, which may cause damage or failure of the blade. Under the rotating condition of a wind turbine, it is more difficult to accurately describe the vibration characteristics of the blade due to the coupling action of its gravity, centrifugal force and aerodynamic force. Therefore, it is of great significance to explore the vibration characteristics of the rotating blade of a large wind turbine under the fluid-structure interaction.
The researchers used different methods to study the aeroelastic coupling effect and vibration characteristics of wind turbine blades, in order to reveal the vibration characteristics of the wind turbine under different loads. Rafiee et al. [1] used modified Blade Element Momentum theory and Computational Fluid Dynamics method to determine the influence of the blade deformation on power performance, and investigated the dynamic instability at high wind speed. Kumar et al. [2] presented complete modeling and simulation for BFSI for large deformation composite propeller blades using commercial solvers based on mesh mapping and grid deformation method. Wang et al. [3] investigated the data mapping between non-matching meshes and geometries in fluid-structure interaction and assessed mapping algorithms for surface meshes including nearest element interpolation, the standard mortar method and the dual mortar method comparatively. Lee et al. [4] provided fluid and structural models that shared the associated interface topology to perform an FSI analysis and based on it, the skeletal model development and verification process for the National Renewable Energy Laboratory (NREL) Phase VI wind turbine were presented. Hogeon et al. [5] applied the numerical method named as fluid-structure interaction to examine the change in the noise strength due to blade flexibility. Staino et al. [6] used a Lagrangian approach to establish the multi-modal mathematical model describing the dynamics of flexible rotor blades and their interaction with the turbine tower, and investigated the impact of realistic changes in the rotational speed on the edgewise vibration of the blades. Liu [7] calculated the natural frequency of blade-cabin-tower coupling system and analyzed the wind vibration under random wind load. Macphee et al. [8] used a finite volume fluid-structure interaction algorithm to simulated a rigid VAWT, which was with good agreement with existing experimental data, and then was compared to several other geometrically identical morphing designs with varying material flexibility. Zhou et al. [9] investigated the static and fatigue properties of the composite wind turbine blade under random ocean loads.
It is worth noticing that nowadays the diameter of large wind turbine blade is getting bigger, and many scholars have simplified the operating conditions to the static state in order to save computing resources and improve the calculating speed. On the other hand, under the effect of the bidirectional fluid-structure interaction (BFSI), the influences of the blade rotating speed and the inflow wind speed on the vibration characteristics of the blade have not been studied deeply. In view of this, the BFSI and rotation effects on the 5 MW offshore wind turbine blade were analyzed in this article, and the vibration characteristics of blades under different rotating and wind speeds were revealed, which provide a theoretical basis and technical guidance for the operation security and reliability design of the wind turbines.
2. Theoretical model
2.1. Fluid-structure interaction physical model
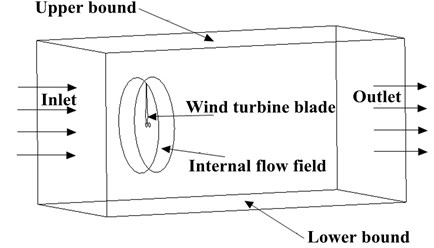
In order to avoid the deficiency of the wind tunnel test which can only be based on the scaling experiment and truly reflect the effect of the structure of the wind turbine blade and the surrounding flow field, the fluid-structure interaction physical model of the wind turbine blade with the same proportion was established in this work. For the sake of the rotating operation condition of the blade, a rotating inner flow field was arranged at the periphery of the blade to simulate the rotation of the wind turbine blade. At the same time, in order to avoid the influence of the upper wind turbine on the downstream wind turbine, the length of the flow field in the external flow field is 2 times as long as that of the blade and the length of the wake region is 6 times as long as that of the blade. Based on it, the fluid-structure interaction physical model is shown in Fig. 1.
Fig. 1Fluid-structure interaction physical model
2.2. Theoretical model of fluid domain
Lagrange coordinate system is accustomed to being used in solid mechanics and only focuses on the movement of material point. In fluid mechanics, the Euler coordinate system is used and focuses only on the state of the space point. In the numerical calculation of the fluid-structure interaction, in order to solve the problem of moving interface coordination caused by the incongruous coordinates of fluid and solid domains, the ALE method is established to describe the fluid control equations. The letter is the general variable, and the governing equations of the fluid domain can be expressed as [10]:
where is the air density; for the continuity equation, 1; for the momentum equation, , and are speed components in each direction; for the two-equation - turbulence model, ; , are the generalized diffusion coefficient and the generalized source term, which are respectively determined according to .
The finite volume method is used to discretize the governing equations, and the integral operation is applied to the control volume and time step . By combining the Gauss divergence theorem, the general form of the discrete equations can be given as [10]:
here, and are coefficients; is the function to be solved; is the grid points for the value of the function; is the adjacent node.
2.3. Calculation of wind load
Considering the fluid-structure interaction, the relation between wind speed and wind pressure from Bernoulli equation can be converted to the calculation formula of wind-load as [11]:
where, is the wind load; is the wind pressure distribution coefficient, and is defined as , where represents the total pressure at the mainstream inlet, is the local static pressure, and denotes the static outlet pressure [12]; is the action area; is the vibration velocity in the blade flapping direction.
2.4. Theoretical model in the structural domain
For the blade, the geometric nonlinear motion equation under the fluid-structure interaction is expressed as [13]:
where, is the stress tensor; is the displacement vector of the blade; is the material density of the blade; is the vector for wind pressure distribution.
The constitutive equations and the relations between displacement and strain which the geometric nonlinear elastic body meets are respectively described as [13]:
where, , and is shear modulus, Lame coefficient and unit tensor respectively.
In the rotating state, the governing equations of the wind turbine blade at a time is the geometrically nonlinear discrete differential equations of motion, which can be written as:
where and are respectively the mass matrix and the damping matrix; and are respectively the speed and the acceleration of the blade at a time , ; is the load column-vector related with the blade wind pressure distribution; is the stiffness matrix of the rotating blade under the fluid-structure interaction, which can be expressed as:
where is the stress stiffness matrix generated by the mutual coupling between the blade rigid motion and its elastic deformation; is the geometric stiffness matrix resulted from the in-plane deformation which is caused by the centrifugal inertia force.
For Eq. (7), the displacement, the velocity and the acceleration at corresponding to the dynamic response of the blade were calculated by Newmark and Newton-Raphson iterative methods.
2.5. Structural damping calculation
In this work, the influence of structural damping is considered when calculating the dynamic response of the blade. Rayleigh damping model is widely used to describe the orthogonal damping model of the structure damping, whose expression is as follows:
where is the coefficient proportion to mass and can be ignored in actual engineering; is the coefficient proportional to the stiffness matrix, which can be expressed as:
Here, is the structural damping ratio, and its value is 0.477 % for this blade [14]; is the primary response frequency of the structure and the first order natural frequency of the blade 0.37559 Hz is chosen.
In engineering, the damping coefficient is obtained by the method of exponential decay, which is generally based on the displacement of any point of the structure [15]. Set the displacement response of the maximum displacement point for the blade as , the dynamic equation of the equivalent dynamic system can be expressed as:
where is the damping coefficient with respect to the displacement response; is the natural frequency of the blade; and represent the maximum displacements of two adjacent periods . Accordingly, the exponential attenuation coefficient can be expressed as:
3. Entity model and element mesh generation
The 5 MW offshore wind turbine [10] designed by the America National Renewable Energy Laboratory (NREL) was chosen as the research object, and its main parameters of the blade are shown in Table 1.
Table 1Main parameters of the wind turbine blade
Parameter | Rated power | Length | Cut-in wind speed | Rated wind speed | Cut-out wind speed | Rated speed |
Value | 5 MW | 63 m | 3 m/s | 11.4 m/s | 25 m/s | 12.1 rpm |
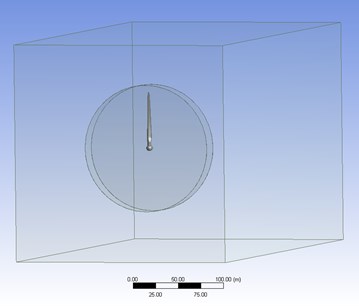
Based on the airfoil design and analysis software Profili, three-dimensional coordinate data of the blade elements were obtained through the coordinate transformation, and the entity model of the blade was established in the 3D modelling software UG. The blade model was further introduced into the Geometry module of ANSYS Workbench software, and the blade’s 3D model and corresponding fluid field model were established successively, as shown in Fig. 2 and Fig. 3 respectively.
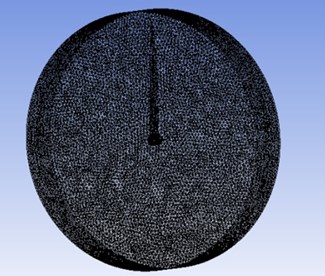
Fig. 2Entity model and mesh generation of the blade
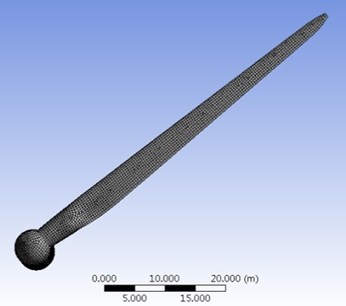
Fig. 3Model of the fluid domain
Given that the glass reinforced plastic(GRP) material has the advantages of lightweight, good stiffness, high strength and corrosion resistance, it has been widely used in large wind turbine blades. In this work, a 45° bi-axial GRP composite material is used as the blade material, whose main performance parameters [14] are shown in Table 2.
Table 2Material parameters of the blade
Material | Elastic modulus (GPa) | Poisson ratio | Density (g/cm3) |
GRP | 17.60 | 0.17 | 1.70 |
The mesh generation of the entity model is the discretization process of the solution area, which lays the foundation for the numerical solution. The shape, size and method of generated mesh have a direct impact on its quality, and thus affect the accuracy of numerical calculation. According to the actual calculation demand, the tetrahedral mesh was used and the finite element mesh of the structural and fluid domains was obtained based on the ICEM technology, as shown in Fig. 2 and Fig. 4 respectively.
Fig. 4Mesh generation of fluid domain
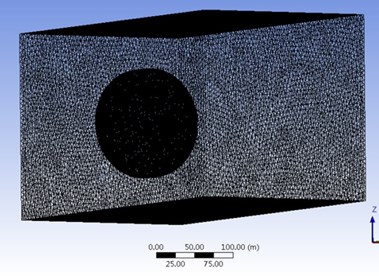
a) Outflow field
b) Internal flow field
Also, the mesh spacing directly affects the calculation accuracy, but the mesh incensement will make computing resource requirements increase exponentially. Ideally, the mesh density that the user needs is the one in which the results will no longer change with the change of mesh density. In this work, the mesh independence of the fluid-structure interaction model under rated condition was verified, and the results were shown in Table 3. It can be seen that the accurate results can be obtained from 862496 mesh in the fluid domain and 61522 mesh in the structural domain. The numerical calculation was carried out through the above method of mesh generation to save computing resources.
Table 3Mesh independence verification
Region | Number of mesh cells | Number of mesh nodes | Maximum displacement(m) | Relative error (%) |
Structural domain | 61522 | 17448 | 1.74375 | – |
129747 | 35409 | 1.72751 | 0.93 | |
281797 | 78817 | 1.7115 | 0.93 | |
Fluid domain | 862496 | 1216773 | 1.74375 | – |
1239714 | 1749178 | 1.7719 | 1.61 | |
1829900 | 2579888 | 1.78223 | 0.58 |
4. Numerical calculation procedure
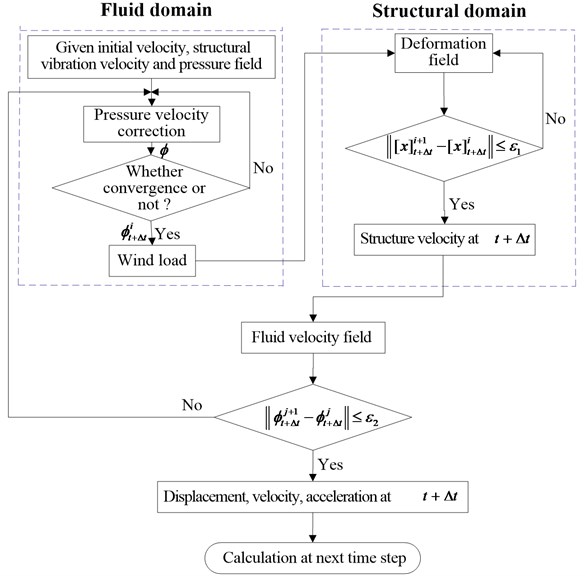
Based on the separation method, the theoretical equation of fluid-structure interaction of the wind turbine blade was solved. Firstly, in the fluid solver, the wind pressure of the fluid-structure interaction surface was calculated based on the given initial conditions. The wind pressure was exerted on the blade surface mesh, causing the deformation of the blade. The blade’s deformation was fed back to the fluid field through the interaction surface, leading to the change of velocity field in the fluid field. Then, the new wind pressure was generated in the surface. The solution of the fluid-structure interaction was realized by reciprocating iteration. The detailed calculation procedure was shown in Fig. 5.
Fig. 5Schematic diagram of fluid-structure interaction numerical calculation procedure
5. Numerical results and discussions
5.1. Numerical reliability verification
In order to verify the reliability of the theory and numerical model, the wind tunnel test was carried out on the scaling model of 5 MW blade. The scaling model was introduced into the BFSI numerical calculation program in this work, and the first principal stress distribution of the blade surface along the span direction was compared with the wind tunnel test results, which was plotted in Fig. 6. It can be seen from the figure that the numerical results agree well with the experimental ones, which verifies the accuracy of the numerical methods used in this work.
5.2. Effect of rotation and fluid-structure interaction on the displacement and stress of the blade
In view of the shutdown condition ( 11.4 m/s and 0 rpm) and the rated condition ( 11.4 m/s and 12.1 rpm), the effects of fluid-structure interaction and rotation on the vibration characteristics of the wind turbine blade were investigated.
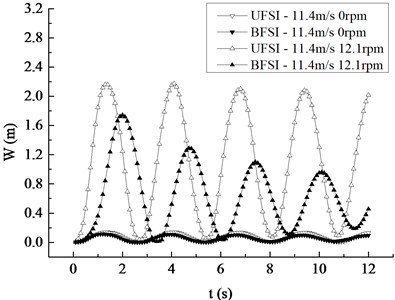
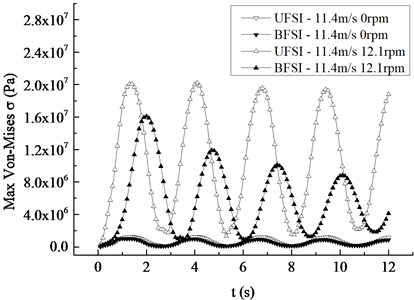
The comparison curves of the maximum displacement and Mises stress response under the conditions of shutdown, rated condition, unidirectional fluid-structure interaction (UFSI) and BFSI were given in Fig. 7. It can be found that the change trends of the maximum displacement and Mises stress are basically the same in four cases. Under the shutdown condition, the maximum displacements of the blade when considering BFSI and UFSI are 0.114 m and 0.139 m respectively, and the maximum Mises stresses are 1.02 MPa and 1.25 MPa. Thus, it can be concluded that the effect of BFSI on the vibration response of the blade makes the maximum values of the BFSI vibration displacement and stress response curves are slightly smaller than that of the UFSI vibration curve. Under the rotating condition, the maximum values of the BFSI vibration displacement and stress of the blade are obviously smaller than that of UFSI. It shows that BFSI has a significant influence on the vibration response of the blade under rotating condition. In addition, the attenuation velocity of BFSI vibration response curves is faster, and the occurrence time of the maximum value is later than UFSI in the way that the first peak is 0.7 s late, which is caused by the additional damping generated by the action of BFSI. Whether in UFSI or BFSI, the peak values of displacement and stress under the rated condition are much larger than the corresponding peak values under static condition, which indicates that the influence of rotation on the vibration response of the blade cannot be ignored.
Fig. 6Comparison between the calculated and experimental first principal stress distribution
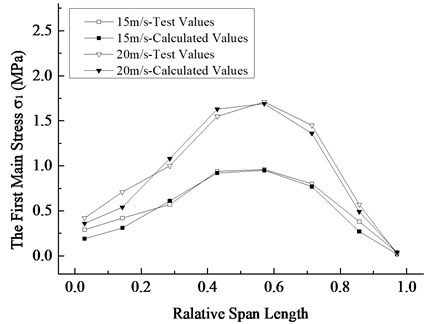
Fig. 7Maximum displacement and Mises stress response curves in the spanwise direction
a) Displacement response
b) Mises stress response
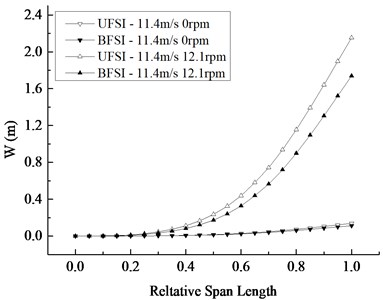
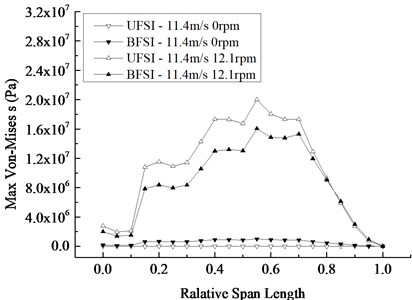
The maximum value of response curves and the distribution curves of the blade section’s maximum displacement and von-Mises stress are depicted in Fig. 8 respectively in four cases. It can be drawn from the curve graphs that the maximum displacement of the blade section in the span-wise direction occurs at the tip, and the maximum stress occurs at the relative wingspan of 0.55. Under the rated condition, the difference of the maximum displacement and von-Mises stress was more significant than that under the static condition, which means the influence of BFSI on the blade’s vibration characteristic under the rated speed is greater than that in the case of a shutdown. The difference between the maximum displacements and stresses under rotating and static conditions in UFSI is bigger than the one in BFSI, which illustrates that the contribution of the rotation under UFSI is more apparent than that of the rotation under BFSI.
Fig. 8Change of maximum displacement and Mises stress of blade section along the span-wise direction
a) Displacement distribution
b) Mises stress distribution
5.3. Effect of rotating speed on the vibration characteristics of the blade
In order to ascertain the influence of the rotating speed on the dynamic response of the blade, four different rotating speeds are compared and analyzed in the 12.1 rpm range of the rated speed, with 2.6 rpm as the speed increment equal.
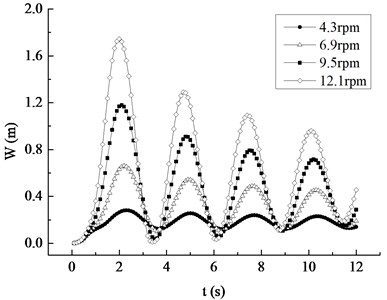
Under the rated inflow wind speed and different rotating speeds, the displacement and Mises stress responses of the blade are shown in Fig. 9. It is not difficult to conclude that the occurrence time of the maximum displacement and stress is 2.3 s, 2.2 s, 2.1 s and 2.0 s. That is, the greater the average wind speed is, the earlier the maximum appears. With the equal increase of rotating speed, the increasing amplitude of maximum values of the displacement peaks are 0.38 m, 0.52 m and 0.56 m respectively, and the increased amplitude of the maximum values of the stress peaks are 3.50 MPa, 4.81 MPa, 5.20 MPa respectively, both presenting the nonlinear increasing trend and indicating that the contribution of rotational speed to displacement and stress increases with the increase of the rotating speed. The displacement and stress response curves at different rotational speeds show a nonlinear decreasing trend, which is more evident with the increase of rotating speed.
Fig. 9Maximum displacement and Mises stress response curves under different rotating speed
a) Displacement response
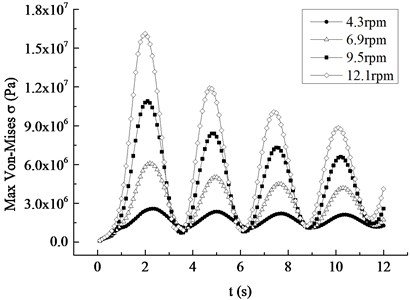
b) Mises stress response
Fig. 10 depicts the distribution of the blade’s displacement at the time when the displacement is maximum in Fig. 9. It can be seen that the maximum displacement region of the blade occurs in the tip position. The displacement of the blade at the first half is relatively small, while the one at the last half is significant. The displacement along the span-wise direction presents the nonlinear growth. The increased amplitude shows the nonlinear increase trend along the span-wise direction under different rotating speed, indicating that the effect of speed on the displacement along the span-wise direction is more and more apparent.
Fig. 10Displacement distribution at the maximum displacement moment under different rotating speed
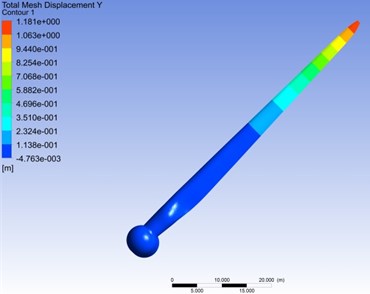
a) Displacement distribution contour
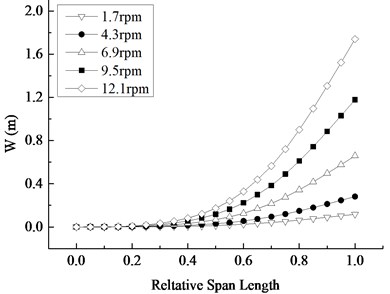
b) Displacement change along the span-wise direction
At the time when the stress is maximum in Fig. 9(b), the distribution of the stress of the blade is shown in Fig. 11. It is well known that the maximum stress region appears in the vicinity of the center of the blade, the stress is greater in the relative wingspan of 0.4-0.7, the maximum Mises-stress appears in the relative wingspan of 0.55. Corresponding to the stress distribution contour, the stress curve has a number of extreme value. With the equal increase of the rotating speed, the increased amplitude of the maximum stress of the blade sections mainly presents the attenuation trend from the central area to both sides. On the whole, the contribution of the rotational speed to the stress is gradually reduced from the centre to both sides of the blade.
Fig. 11Mises stress distribution at the maximum stress moment under different rotating speed
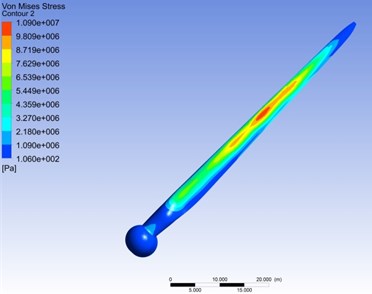
a) Stress distribution contour
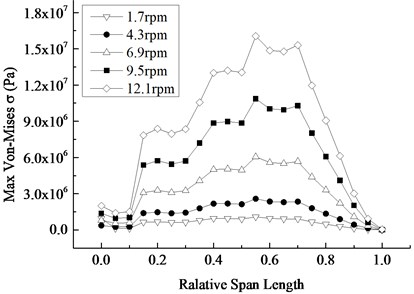
b) Stress change along the span-wise direction
5.4. Effect of inflow wind speed on the vibration characteristics of the blade
Taking 4.2 m/s as the average wind speed increment, 5 kinds of different average wind speeds were compared and analyzed in the range of 19.8 m/s. Under the rated rotating speed, the displacement and Mises stress response curves of the blade to different inflow wind speed are plotted in Fig. 12. It can be found that the occurrence time of maximum values of displacement and stress peak values was 2.2 s, 2.1 s, 2.0 s, 1.9 s and 1.8 s respectively, meaning that the maximum value appears earlier as the average wind speed becomes larger. With the equal increase of the average wind speed, the maximum values of the displacement and stress peak values increase, but the increase amplitude is decreased between adjacent wind velocities. The increase amplitudes of the displacement are 0.69 m, 0.39 m, 0.26 m and 0.19 m in turn and that of the stress are 6.39 MPa, 3.59 MPa, 2.44 MPa and 1.77 MPa respectively, which both present the nonlinear decreasing trend, that is, the contribution of the average wind speed to the displacement and stress decreases with the increase of the wind speed. The displacement and stress response curves of different average wind speeds show the nonlinear attenuation trend, and their attenuation rate increases with the increase of the average wind speed.
Fig. 12Maximum displacement and Mises stress response curves under different average wind speed
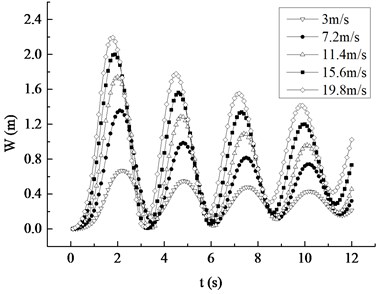
a) Displacement response
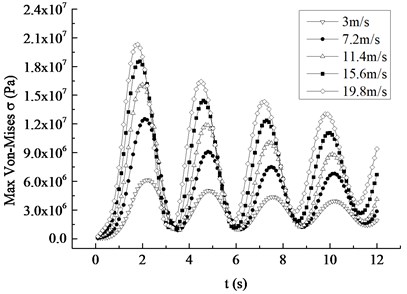
b) Mises stress response
Fig. 13 depicts the displacement distribution of the blade at the time corresponding to the maximum displacement of the blade. It can be observed that the displacement contour showing the displacement from the root to the tip presents a gradual increasing trend. Under the same average wind speed, the displacement along the span-wise direction shows a non-linear increase trend, and this trend is more obvious with the increase of the wind speed. The displacement difference under different wind speed increases along the span-wise direction and reaches the maximum at the tip of the blade, suggesting that the contribution of the average wind speed on the displacement is more and more obvious along the span-wise direction. With the equal increase of the average wind speed, the increased amplitude of the maximum displacement in each section decreases unequally, which means that the influence of the wind speed on the maximum displacement of the blade decreases with the increase of average wind speed.
Fig. 13Displacement distribution at the maximum displacement moment at different average wind speeds
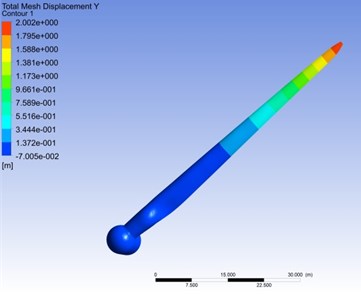
a) Displacement distribution contour at 15.6 m/s
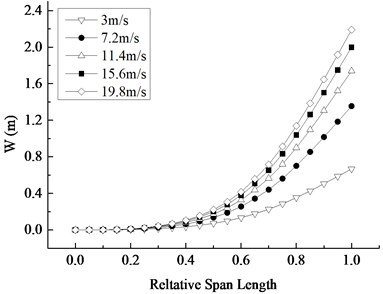
b) Displacement change along the span-wise direction
Corresponding to the maximum stress moment in Fig. 13(b), the stress distribution of blade Mises is shown in Fig. 14. The stress distribution contour indicates that the maximum stress appears in the central region and at the root of the blade. The maximum stress occurred in a relative wing-span of 0.55 under different average wind speed. The difference of the maximum stress of the blade section under different average wind speed descends from the centre of the blade to both sides, showing that the effect of the average wind speed on the stress of the blade is larger in the centre of the blade, and smaller in blade’s both sides. What’s more, similar to the situation in the blade's displacement, the contribution of the average wind speed to the increase of the blade stress decreases with the increase of wind speed.
Fig. 14Mises stress distribution at the maximum stress moment at different average wind speed
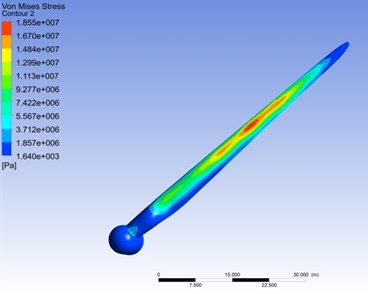
a) Stress distribution contour
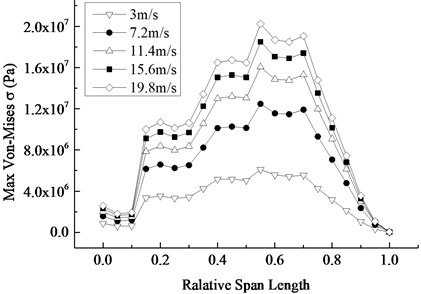
b) Stress change along the span-wise direction
5.5. Determination of equivalent damping coefficients of rotating blades
The maximum displacement attenuation curve of the blade under the rated condition was calculated under BFSI, as shown in Fig. 15. It is not difficult to draw the conclusion that the nonlinear attenuation trend of the blade displacement is quite obvious, and the basic exponential attenuation law is presented. Moreover, under the fluid-structure interaction effect, the blade vibration is experienced 50 s, that is, the maximum displacement response of the blade is stable after 18 cycles.
Fig. 15Attenuation curve of the blade maximum displacement under BFSI effect
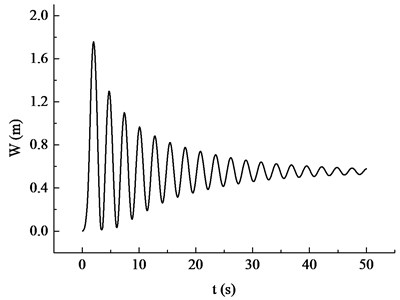
Fig. 16Variation curves of the equivalent damping coefficient with the number of cycles
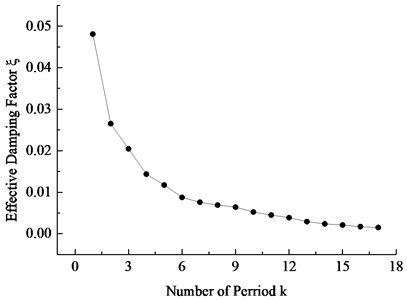
The displacement response data in Fig. 15 was extracted, and the equivalent damping coefficients of GRP blade were calculated by Eq. (12). The variation curve of the equivalent damping coefficients with the number of cycles was plotted in Fig. 16. As can be seen from the graph, the equivalent damping coefficient of the blade presents the nonlinear decreasing trend with the increase of the number of cycles: the decreasing velocity gradually decreases, and the equivalent damping coefficient is gradually close to zero. Based on it, if the damping coefficient is set as a constant, large errors will appear in the blade dynamics calculation under actual engineering. Only taking the damping coefficient change with the vibration cycle number into consideration, can the wind turbine blade dynamic attenuation characteristics be more truly reflected.
6. Conclusions
The following conclusions can be obtained from this study:
1) The maximum value of BFSI vibration displacement and stress of the blade under rotating condition is obviously smaller than that of UFSI. Under the rated condition, whether in the effect of UFSI or BFSI, the peak values of the displacement and Mises stress of the blade are much larger than that of static condition, indicating that the influences of BFSI and the rotational effect on the vibration characteristics of the blade are significant, which can’t be ignored in the numerical calculation.
2) Under the rated wind speed, the maximum displacement and Mises stress in the span-wise direction increase nonlinearly with the increase of the rotating speed, and the growth rate gradually speeds up. Under the rated rotating speed, the maximum displacement and Mises stress of the blade in the span-wise direction also increase nonlinearly with the increase of the wind speed, while the growth rate gradually decreases.
3) Under different rotating and wind speed, the displacement of the blade all nonlinearly increases along the span-wise and reaches the maximum at the tip of the blade. The maximum Mises stress is at the largest near the center of the blade, and reduces nonlinearly to both sides in basic. The contribution of the rotating and wind speed to the displacement of blade are both more and more obvious along the span-wise direction, and the contribution to the stress gradually decreases from the middle to both sides.
4) The equivalent damping coefficient of GRP blades under the action of BFSI presents a nonlinear decreasing trend with the increase of the cycle number. In order to truly reflect the dynamic attenuation characteristics of wind turbine blades actually, the change of damping coefficient with the number of vibration period should be taken into consideration.
References
-
Rafiee R., Tahani M., Moradi M. Simulation of aeroelastic behaviour in a composite wind turbine blade. Journal of Wind Engineering and Industrial Aerodynamics, Vol. 151, 2016, p. 535-558.
-
Kumar J., Wurm F. H. Bi-directional fluid–structure interaction for large deformation of layered composite propeller blades. Journal of Fluids and Structures, Vol. 57, 2015, p. 32-48.
-
Wang T. Y., Wuchner R., Sicklinger S., et al. Assessment and improvement of mapping algorithms for non-matching meshes and geometries in computational FSI. Computational Mechanics, Vol. 57, Issue 5, 2016, p. 793-816.
-
Lee K., Huque Z., Kommalapati R., et al. Evaluation of equivalent structural properties of NREL phase VI wind turbine blade. Renewable Energy, Vol. 86, 2016, p. 796-818.
-
Hogeon K., Seunghoon L. Aerodynamic noise analysis of large horizontal axis wind turbines considering fluid-structure interaction. Renewable Energy, Vol. 42, 2012, p. 46-53.
-
Staino A., Basu B. Dynamics and control of vibrations in wind turbines with variable rotor speed. Engineering Structures, Vol. 56, 2013, p. 58-67.
-
Liu W. Y. The vibration analysis of wind turbine blade-cabin-tower coupling system. Engineering Structures, Vol. 56, 2013, p. 954-957.
-
Macphee D. W., Beyene A. Fluid-structure interaction analysis of a morphing vertical axis wind turbine. Journal of Fluids and Structures, Vol. 60, 2016, p. 143-159.
-
Zhou F., Mahfuz H., Alsenas G. M., et al. Static and fatigue analysis of composite turbine clacks under random ocean current loading. Marine Technology Society Journal, Vol. 47, Issue 2, 2013, p. 59-69.
-
Zhang J. P., Guo L., Wu H., et al. The influence of wind shear on vibration of geometrically nonlinear wind turbine blade under fluid-structure interaction. Ocean Engineering, Vol. 84, 2014, p. 14-19.
-
He D. X. Wind Engineering and Industrial Aerodynamics. First Edition, National Defense Industry Press, Bei Jing, 2006.
-
Chen F. N., Zhang J. Z., Chang H. B., et al. Investigations of film-cooling effectiveness on the squealer tip with various film-hole configurations in a linear cascade. International Journal of Heat and Mass Transfer, Vol. 117, 2018, p. 344-357.
-
Zhang J. P., Li Z. N. Dynamic instability of magnetoelastic coupling interactions of cantilever conductive thin plates. Journal of Zhejiang University (Engineering Science), Vol. 40, Issue 3, 2006, p. 414-418.
-
Jonkman J., Butterfield S., Musial W., et al. Definition of a 5-MW Reference Wind Turbine for Offshore System Development. Technical Report, 2009.
-
Zheng X. J., Zhou Y. H., Kenz M. An analysis of variable magnetic damping of a cantilever beam-plate with end coils in transverse magnetic fields. Fusion Engineering and Design, Vol. 55, 2001, p. 457-465.
Cited by
About this article

The authors wish to acknowledge financial support by various research funds including the National Natural Science Foundation of China (11572187); Training Assistance Program for Shanghai University Youth Teacher (A-0010-17-025-18).
Fengfeng Shi contributed the central idea, designed the study, performed the research, and wrote the initial draft of this manuscript. Zhiyu Wang conducted and improved the experiment, calculated the data and revised some parts of this manuscript. Prof. Jianping Zhang proposed the theoretical calculation model, built the fluid-structure interaction physical model and provided the theoretical guidance. Zhen Gong interpreted the numerical simulation results and made the literature review. Liang Guo developed the idea for the study and made the extraction of the data from the numerical simulation. All authors analysed the data and were involved in writing this manuscript.
