Abstract
Graphene is the material with the highest thermal conductivity, it has a wide range of applications in the fields of energy storage, electronic devices, biological materials, sensing materials and catalyst carriers. However, few people have studied how to accurately measure the thermal conductivity of graphene films. Therefore, a method for measuring thermal conductivity of graphene films is proposed in this paper. The influence of different factors such as surface state, pulse width, sample thickness and measurement direction on the measurement accuracy of the graphene film are also analyzed. The results show that when the surface of the graphene film is sprayed with graphite, the measurement accuracy can be effectively improved. When the measurement technician chooses the appropriate pulse width, measurement thickness and measurement direction, the measurement accuracy of the graphene film can be effectively improved. The research produced data que will contribute to improve the measurement accuracy of graphene products and the level of operation of the technicians as well as contribute in the high-quality development of graphene industry.
Highlights
- The thermal conductivity of graphene film is studied.
- The measurement accuracy can be improved.
- A method for measuring thermal diffusivity of graphene films is proposed.
1. Introduction
Graphene has excellent optical, electrical, and thermal properties, and is considered a revolutionary material for the future [1-3]. Thus, graphene films made from graphene nanoparticles have also been widely used in many fields in recent years, such as heat dissipation film [4-6], electromagnetic shielding [7, 8], electrochemical energy storage [9-11], and photoelectrocatalysis [12]. Currently, the preparation technology of graphene films can be divided into two types of methods. The first method is to assemble the film directly using the graphene dispersion. This method can obtain high-quality graphene films with fewer defects and optimize its electrical and thermal conductivity. In recent years, consumer electronics have gradually developed in the direction of thinness, high performance and multi-function. The performance of electronic products is becoming more and more powerful, and the integration and assembly density are becoming higher, resulting in the increase of power consumption and heat output. The second method is prepared by the reaction of graphite with strong acid liquid or strong oxidation liquid. This method has lower cost, but the preparation quality is poor, and the graphene structure has more defects. The thickness of the graphene film is between 25 μm and 210 μm, which is relatively thin compared to traditional heat-conducting materials. This thin and light property makes graphene films a good choice for smartphones, ipads, tablets and other portable devices [13-15].
In recent years, the measurement of thermal conductivity of thin films has attracted extensive attention from relevant scholars, and thermal conductivity measurement methods are mainly divided into steady-state method and unsteady-state method [16]. The steady-state method is mainly used to measure thin film materials with low thermal conductivity and is not suitable for measuring graphene films with high thermal conductivity. The unsteady state method mainly includes laser flash method [17-19]. The laser flash method has a short test time and requires little energy, and Parker W J often uses its measurement results as a reference standard for other methods [20]. Sun Jianping used the laser flash method to correct the heat leakage of the material’s thermal diffusivity [21]. Troitsky O. Y. simulated the laser flash method to evaluate the thermal diffusivity of thin film materials [22]. Although some people use laser flash methods to evaluate the thermal conductivity of thin films, few researchers have analyzed the reasons that affect the accuracy of thermal conductivity measurement results. Thermal diffusion coefficient is an important parameter to evaluate the thermal conductivity of graphene composite films. According to the formula of , thermal diffusivity, density and specific heat are the three main parameters that affect thermal conductivity. Since the specific heat and density can be obtained by looking at the table, the thermal diffusion coefficient is one of the most important parameters that affect the thermal conductivity of graphene films.
Therefore, a method for measuring thermal diffusivity of graphene films is proposed in this paper. The in-plane thermal diffusivity and out-of-plane thermal diffusivity of the graphene films are accurately measured. The influence factors that affect the measurement results of graphene films are also analyzed in detail. Uncertainty analysis is also used to evaluate the accuracy of test results of measurement methods. This study is conducive to solving the problem that the thermal diffusion coefficient of graphene radiators and related products cannot be accurately measured, ensuring the better application of graphene films in electronic devices, LED lighting equipment, new energy vehicles, batteries and other fields, to promote the development of graphene industry.
2. Method
2.1. Measurement principle
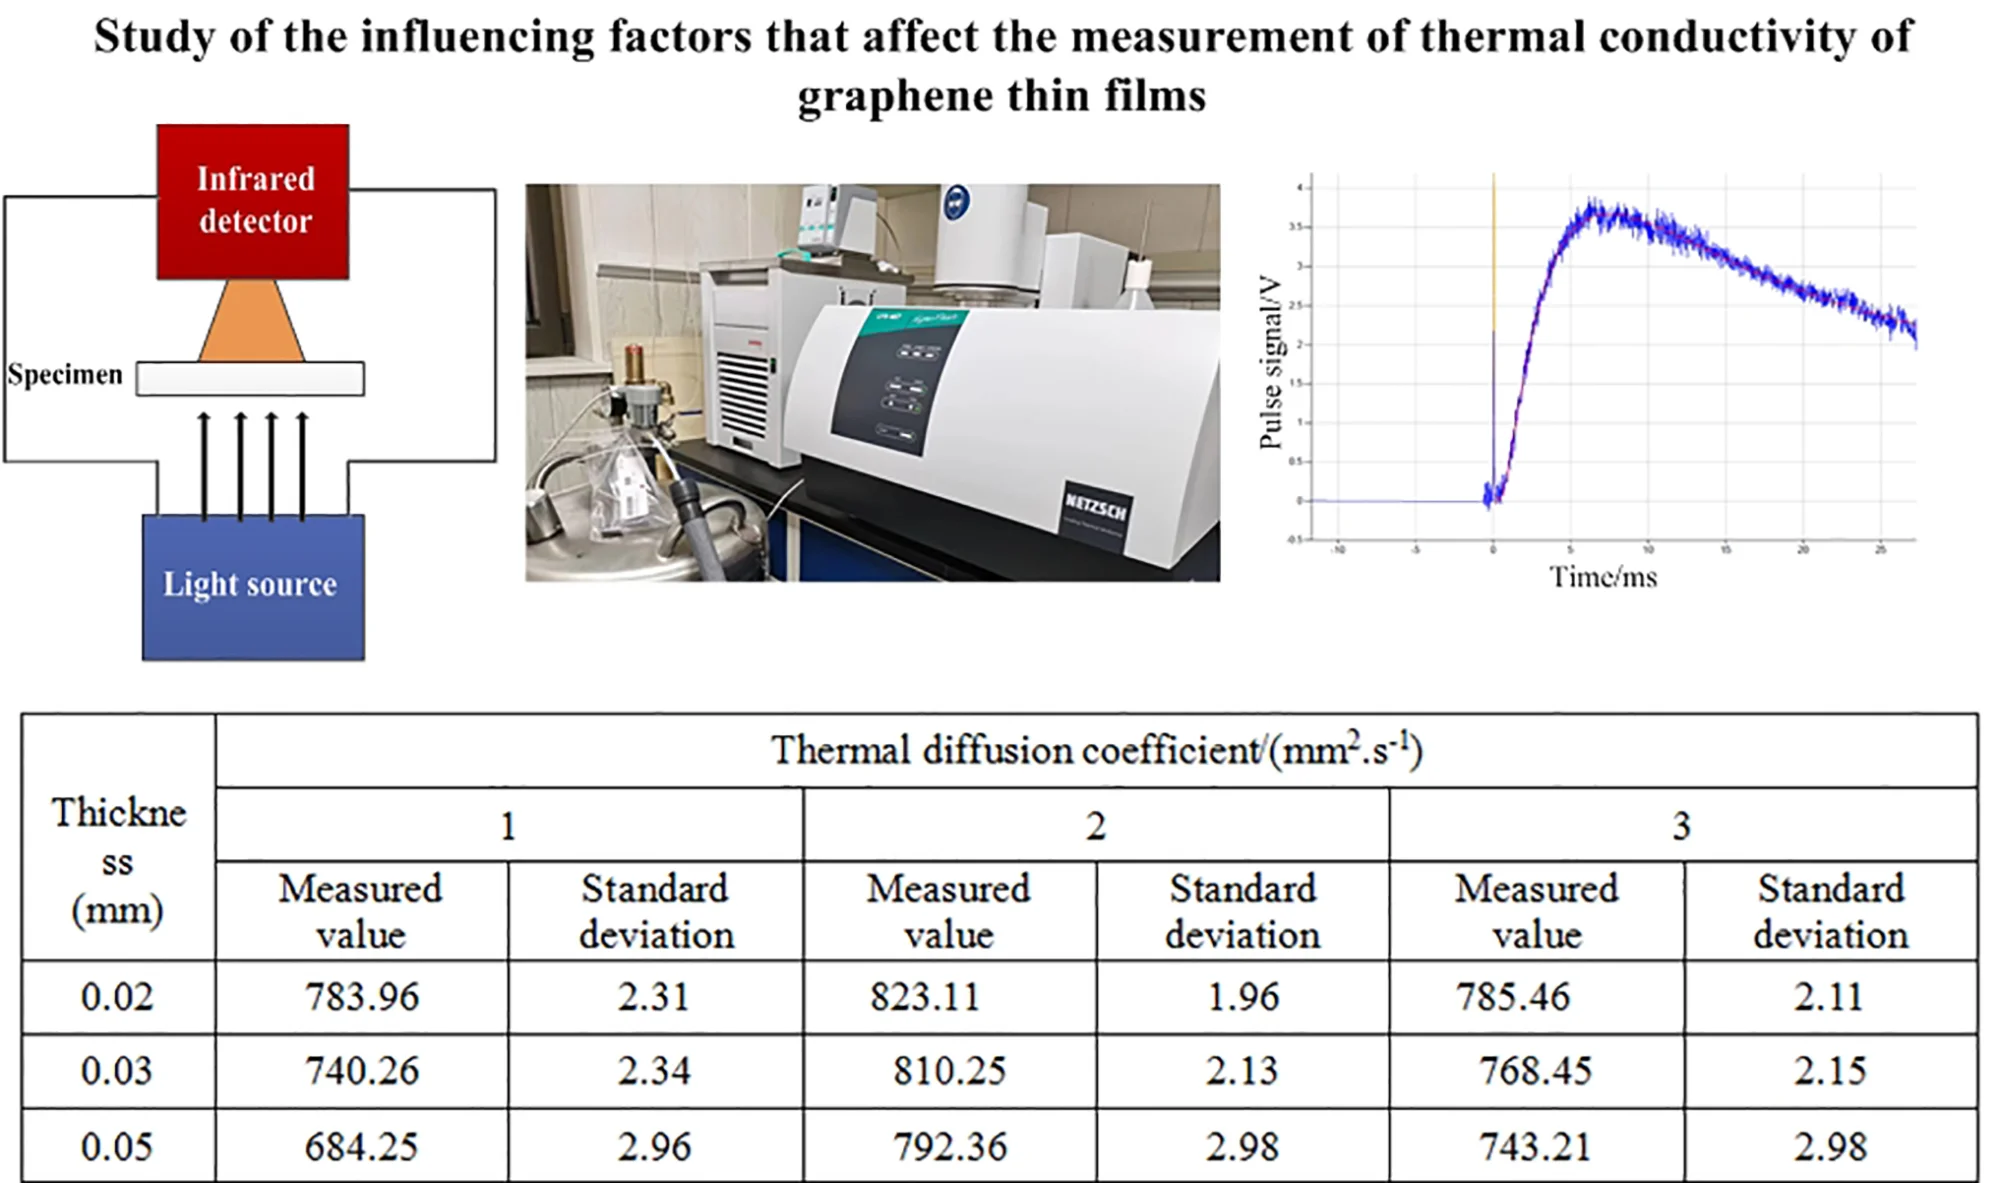
The thermal diffusivity of graphene films can be measured directly by using laser flash method. The light source emits a pulse instantaneously and uniformly irradiates on the lower surface of the graphene film, causing the temperature to rise instantaneously after the surface layer absorbs energy. The energy is then propagated to the upper surface of the graphene film by one-dimensional heat conduction. The corresponding heating process of the center part of the upper surface of the graphene film is continuously recorded with an infrared detector, and the change curve of the temperature detection signal with time is obtained. The time (half heating time) required for the upper surface temperature of the graphene film to rise to half of the maximum temperature appreciation can be obtained. The measurement principle diagram is shown in Fig. 1.
Fig. 1Schematic diagram of thermal diffusion coefficient test for graphene films
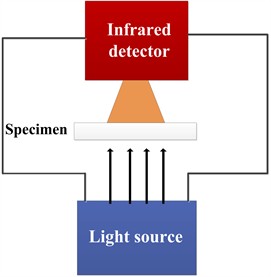
a) Schematic diagram of instrument
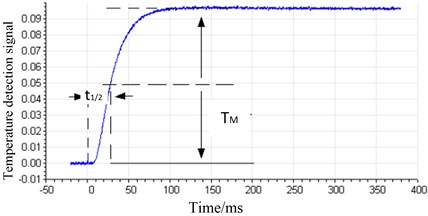
b) Temperature curve
The thermal diffusivity of the material is calculated according to Fourier heat transfer equation, as shown in Eq. (1):
where, is expressed as the thermal diffusivity, mm2/s; is the thickness of the sample, mm; is the half heating time, s.
The thermal conductivity can be calculated from Eq. (2):
where, is expressed as thermal conductivity, is the specific heat; is the density.
2.2. Measurement method
The ambient temperature of the laboratory is 20 °C, the ambient humidity is 50 % RH, and there is no obvious vibration and shock around the instrument. The technical requirements of instruments and supporting equipment used in the test process can be shown in Table 1 and Fig. 2.
Fig. 2Testing instrument
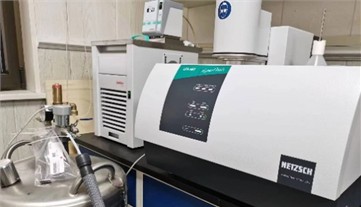
Table 1Technical requirements for instruments and supporting equipment
Number | Device | Technical requirements | Purpose |
1 | Thermal physical parameter tester/Flash thermal conductivity tester | Temperature range: (–100-500) ℃ Thermal diffusion coefficient: (0.01-1000) mm2/s Detector frequency: ≧ 2 MHz | Measure the thermal diffusivity |
2 | Micrometer | Measuring range: (0-25) mm Maximum permissible errors: ±4 μm | Measure the thickness of the graphene film |
3 | Water bath | Temperature range: (–35-200) ℃ Temperature stability: ±0.02 ℃ | Maintain a constant temperature |
The test process is operated according to the national standard GB/T22588-2008 “Flash method to measure the thermal diffusion coefficient or thermal conductivity” and JJF145-2024 “Technical norm for measurement of thermal diffusivity of graphene heat sinks”, which can ensure the accuracy and repeatability of the experimental data. The testing process can be described in detail as follows:
Turn on the device and stabilize it for 10 minutes or meet the requirements of its instruction manual; The surface of the graphene film should be flat, and the parallelism error should be within 0.5 % of the thickness. And the surface of the film is not allowed to have any sand holes, scratches, streaks defects.
Firstly, the thickness of the graphene film is measured 3 times by micrometer, then the arithmetic mean value L of the measured result is taken as its thickness value.
Secondly, the upper and lower surfaces of the graphene film are sprayed with thin and uniform graphite to cover the surface luster of the graphene film.
Thirdly, Set the laser voltage, pulse width and sample thickness in the instrument to ensure that the temperature rise curve height should be in the range of (3-10) V.
Finally, the measurement of the graphene film is repeated 3 times, and the average value is taken as the final measurement value.
In subsequent experiments, the influence of different factors such as spray graphite, pulse width, thickness, and measurement direction on measurement accuracy will be carefully analyzed. The parameter settings in different subsequent experiments can be shown in Table 2.
Table 2Parameter setting in the experiment
Case | Influencing factor | Laser voltage | Pulse width | Thickness | Measurement direction |
1 | Graphite spray | 260 V | 50μs | 0.2 mm | In-plane |
2 | Pulse width | 260 V | 20 μs, 50 μs, 100 μs, 250 μs | 0.25 mm | In-plane |
3 | Thickness | 260 V | 50 μs | 0.02 mm, 0.03 mm, 0.05 mm, 0.10 mm | In-plane |
4 | Measurement direction | 260 V | 50 μs | 0.020 mm, 0.025 mm, 0.030 mm, 0.035 mm, 0.040 mm | In-plane/ Out-plane |
The formula for calculating the thermal diffusion coefficient of the graphene heat sink is as follows:
where is the average thermal diffusion coefficient of graphene film; is the measured value of the thermal diffusion coefficient of the ; is number of measurements.
The repeatability of the thermal diffusion coefficient is expressed by the standard deviation, and the calculation formula is shown as follows:
where is repeatability/Standard deviation, mm2/s; is average value of thermal diffusivity, mm2/s; is measurement results of thermal diffusivity for the time, mm2/s; is number of measurements.
2.3. Uncertainty measurement method
The uncertainty measurement model is shown as follows:
where is the thickness of the graphene film, mm; is thermal diffusivity, mm2/s; is the time when the temperature of the upper surface of the graphene film rises to half the maximum time.
The main sources of thermal diffusivity uncertainty include the following items:
(1) The relative repeated uncertainty introduced by thermal diffusivity .
(2) The relative uncertainty introduced by thickness .
(3) The relative uncertainty introduced by the half-heating time .
The relative synthetic uncertainty of the thermal diffusivity is expressed as follows:
3. Results
3.1. Effect of graphite spray on measurement results
Six graphene film samples were selected to test their thermal diffusivity under two conditions: graphite spray and no graphite spray. Experimental parameters are set according to case 1 in Table 3. The test results are shown as follows.
Table 3Measurements of six samples without graphite
Number of samples | Measured value-1 mm2/s | Measured value-2 mm2/s | Measured value-3 mm2/s | Mean value mm2/s | Standard deviation mm2/s |
1 | 792.564 | 785.581 | 770.832 | 782.9923 | 9.058913 |
2 | 875.019 | 882.203 | 889.901 | 882.3743 | 6.076759 |
3 | 778.853 | 787.485 | 793.594 | 783.7667 | 6.948974 |
4 | 772.714 | 785.557 | 791.658 | 783.3097 | 7.895428 |
5 | 785.590 | 796.941 | 779.976 | 787.5023 | 7.056702 |
6 | 880.005 | 888.172 | 878.758 | 882.3117 | 4.175036 |
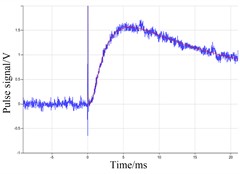
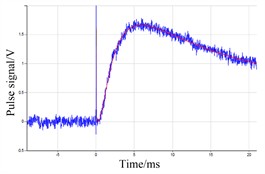
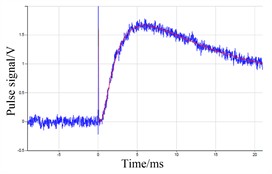
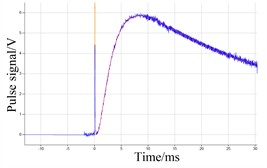
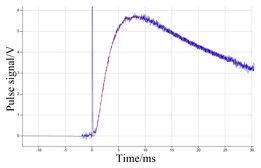
Fig. 3Signal fitting curve of six samples without graphite
a)
b)
c)
d)
e)
f)
From Fig. 3 and Table 3, it can be seen that when the samples are not coated with graphite, the standard deviation measured by the six samples is a little large, and the corresponding fitted signal will have a large signal to noise ratio (SNR). The thermal diffusivity of the six samples are 782.9923 mm2/s, 882.3743 mm2/s, 882.3743 mm2/s, 783.3097 mm2/s, 783.3097 mm2/s, 882.3117 mm2/s, respectively. The standard deviations of the six samples ranged from 4 to 9. The appearance of the SNR is due to the fact that the sample surface is not coated with graphite, and the surface is not smooth, this will cause some of the energy to reflected away.
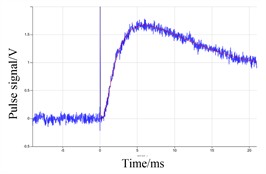
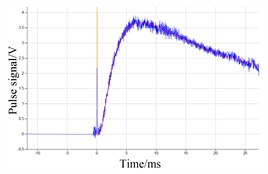
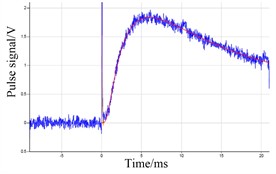
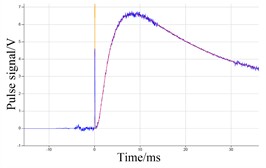
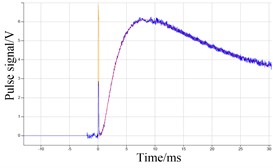
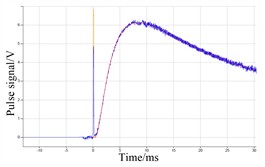
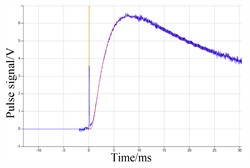
It can be seen from the results of Fig. 4 and Table 4, compared with the results of Fig. 4 and Table 4. When the six samples are sprayed with graphite, the thermal diffusivity of the six samples are 783.325 mm2/s, 885.707 mm2/s, 789.977 mm2/s, 789.977 mm2/s, 789.977 mm2/s, 886.645 mm2/s respectively. The standard deviation is range between 0.881 mm2/s and 3.155 mm2/s. Compared with the results in Fig. 3 and Table 3, the measured values did not change significantly, but the standard deviation is significantly smaller, indicating that the surface of the sample is smooth due to the coating of graphite, which can be better to reduce light reflection. In the case of sprayed graphite, the repeatability of the data becomes better than that without sprayed graphite, and the measurement accuracy would be improved under the condition of spraying graphite.
Table 4Measurements of six samples with graphite
Number of samples | Measured value-1 | Measured value-2 | Measured value-3 | Mean value | Standard deviation |
1 | 784.564 | 782.581 | 782.832 | 783.325 | 0.881 |
2 | 889.019 | 885.203 | 882.901 | 885.707 | 2.523 |
3 | 788.853 | 787.485 | 793.594 | 789.977 | 2.617 |
4 | 778.714 | 780.557 | 782.658 | 780.643 | 1.611 |
5 | 795.590 | 792.941 | 787.976 | 792.169 | 3.155 |
6 | 887.005 | 885.172 | 887.758 | 886.645 | 1.085 |
Fig. 4Signal fitting curve of six samples with graphite
a)
b)
c)
d)
e)
f)
3.2. Influence of different pulse widths on test results
Three 25 μm commercial graphene films are selected to analyze the effect of different pulse widths on measurement accuracy. the instrument detector is MTC, the pulse voltage is 260 V, the pre-stage gain is 10000, the main gain and pulse time are automatically optimized during the measurement process, and the calculation model is In-plane+Isotropic mode, experimental parameters are set according to case 2 in Table 2. The thermal diffusivity of four graphene films are measured at pulse widths of 20 μs, 50 μs, 100 μs and 250 μs, respectively.
Table 5 shows the measured values of three different samples at pulse widths of 20 μs, 50 μs, 100 μs, 250 μs. From the data of sample 1, as the pulse width increases from 20 μs to 250 μs, the measured value gradually decreases and the standard deviation gradually increases, which indicates that the smaller the pulse width can be obtained the larger the measured value and the smaller the standard deviation, which means the higher the measurement accuracy can be obtained at pulse widths of 20 μs.
The same rule can be obtained from the measurement results of sample 2 and sample 3. The increase of pulse width will lead to the increase of measurement value. The reduction of standard deviation means the improvement of measurement accuracy.
Table 5Influence of different pulse widths on the results of in-plane thermal diffusion test
Pulse width (μs) | Thermal diffusion coefficient / (mm2/s) | |||||
1 | 2 | 3 | ||||
Measured value | Standard deviation | Measured value | Standard deviation | Measured value | Standard deviation | |
20 | 783.62 | 2.31 | 886.104 | 1.56 | 789.977 | 2.32 |
50 | 775.32 | 3.25 | 870.25 | 2.32 | 770.32 | 3.56 |
100 | 764.25 | 3.45 | 850.98 | 3.45 | 756.42 | 4.65 |
250 | 642.12 | 4.69 | 832.56 | 4.56 | 734.12 | 5.39 |
3.3. Influence of sample thickness on test results
In this experiment, three samples are selected and processed into four kinds of thickness: 0.02 mm, 0.03 mm, 0.05 mm and 0.10 mm, respectively. Experimental parameters are set according to case 3 in Table 2. The results of thermal diffusivity of graphene films with different thicknesses can be obtained in Table 7.
Table 6Measurement results of different film thicknesses
Thickness (mm) | Thermal diffusion coefficient / (mm2.s-1) | |||||
1 | 2 | 3 | ||||
Measured value | Standard deviation | Measured value | Standard deviation | Measured value | Standard deviation | |
0.02 | 783.96 | 2.31 | 823.11 | 1.96 | 785.46 | 2.11 |
0.03 | 740.26 | 2.34 | 810.25 | 2.13 | 768.45 | 2.15 |
0.05 | 684.25 | 2.96 | 792.36 | 2.98 | 743.21 | 2.98 |
0.10 | 642.12 | 3.14 | 772.45 | 3.23 | 721.12 | 3.32 |
It can be seen the results in Table 6: the results of sample 1 shows that as the thickness of the graphene film increases from 0.02 mm to 0.10 mm, the measured value changes from 783.96 mm2.s-1 to 642.12 mm2.s-1, the standard deviation becomes larger, which will results in the smaller measurement accuracy.
A similar rule can be obtained in sample 2 and sample 3, thinner graphene film will bring higher measurement value and smaller standard deviation. When the film thickness of sample 2 changes from 0.02 mm to 0.10 mm, the thermal diffusivity of sample 2 decreases from 823.11 mm2/s to 772.45 mm2/s, and the measurement value of sample 3 increases from 721.12 mm2/s to 785.46 mm2/s. It can be found that thinner graphene films lead to higher measurement results, smaller standard deviations, and higher measurement accuracy.
3.4. Measurement results of different measurement directions
Five samples with thickness of 0.02 mm, 0.025 mm, 0.03 mm, 0.035 mm and 0.040 mm are selected to analyze the influence of different measurement directions on measurement accuracy. Experimental parameters are set according to case 4 in Table 2. The results of thermal diffusivity of graphene films with different thicknesses can be obtained as shown in Table 7.
Table 7 shows that when sample 1 is measured, the measurement value of thermal diffusivity is 765.32 mm2/s and the standard deviation is 1.12 mm2/s in the in-plane direction. When the measurement direction is out of plane, the thermal diffusivity is 5.32 mm2/s and the standard deviation is 0.32 mm2/s. The results show that the thermal diffusivity in the in-plane direction is much larger than that in the out-of-plane direction.
In the in-plane direction, the thermal diffusivity of samples of 2, 3, 4 and 5 are 832.45 mm2/s, 756.45 mm2/s, 756.45 mm2/s and 865.24 mm2/s, respectively. In the out-plane direction, the thermal diffusivity of samples of 2, 3, 4, and 5 are 7.62 mm2/s, 5.32 mm2/s, 4.35 mm2/s, and 7.52 mm2/s, respectively. These results also show that the thermal diffusivity of the five samples in the in-plane direction is much larger than that in the out-of-plane direction, the measurement results in the in-plane direction are about 140 times greater than that in the out-of-plane direction.
Table 7Measurement results of different measurement directions
Sample | Thickness | Direction | Measured value (mm2.s-1) | Standard deviation (mm2.s-1) |
1 | 0.020 mm | In-plane direction | 765.32 | 1.12 |
Out-plane direction | 5.32 | 0.32 | ||
2 | 0.025 mm | In-plane direction | 832.45 | 2.04 |
Out-plane direction | 7.62 | 0.14 | ||
3 | 0.030 mm | In-plane direction | 756.45 | 2.15 |
Out-plane direction | 5.32 | 0.16 | ||
4 | 0.035 mm | In-plane direction | 645.25 | 2.45 |
Out-plane direction | 4.35 | 0.29 | ||
5 | 0.040 mm | In-plane direction | 865.24 | 2.68 |
Out-plane direction | 7.52 | 0.34 |
3.5. Uncertainty result
In order to further verify the above measurement results, 10 repeated measurements are made on the graphene film under the condition of pulse width of 50 um, and the uncertainty are studied under the condition of spray graphite and non-spray graphite at different measurement directions, as shown in Table 8.
Table 8The uncertainty components for the measurement
Case | Different condition | Repeatability uncertainty (Y) | Thickness uncertainty (L) | Half-heating time uncertainty (t) | Synthetic uncertainty (Y) |
1 | Thickness of 0.02 mm with graphite in the plane direction | 0.29 % | 0.21 % | 2.0 % | 2.06 % |
2 | Thickness of 0.10 mm with graphite in the plane direction | 0.31 % | 0.35 % | 2.0 % | 2.14 % |
3 | Thickness of 0.02 mm without graphite in the plane direction | 0.41 % | 0.21 % | 2.0 % | 2.08 % |
4 | Thickness of 0.02 mm with graphite in the out-plane direction | 0.52 % | 0.21 % | 2.0 % | 2.11 % |
Looking at the first case in Table 8, the results show that the synthetic uncertainty is at least 2.06 % when the graphene film is 0.02 mm and sprayed with graphite. From the case 2, when the film thickness is 0.10 mm, the thickness uncertainty increases to 0.35 %, and the synthetic uncertainty can reach 2.14 %. This means that the increase of thickness greatly affects the uncertainty results of thickness, which will greatly increases the synthetic uncertainty. Seen from the case 3, when the measured thickness of the graphene film is 0.02 mm and the surface of the film is not coated with graphite, compared with case 1, the repeatability of measurement uncertainty is increased to 0.41, and the synthetic uncertainty is 2.08 %, which is similar with that of the first case.
In case 4, it can be seen that when the graphene film is 0.02 mm, the graphite is sprayed and the measurement direction is out of plane, the uncertainty of measurement repeatability increases to 0.52 % and the synthetic uncertainty is 2.11 %.
4. Conclusions
Due to the increasing demand for the functions of electronic products, electronic systems generate a lot of heat, and efficient cooling is essential to extend the service life of electronic products and reduce power consumption. Graphene films are becoming more and more popular in thermal management of electronic products for their excellent heat dissipation ability, so they have a huge market application prospect. The accurate measurement of the thermal conductivity of graphene films is very important for the large-scale application of graphene films in the field of integrated circuits. However, few people have studied the factors that affect the measurement accuracy of graphene films.
Therefore, in this study, the effects of pulse width, film thickness, measurement direction and spray graphite on the measurement results of graphene films are analyzed in detail. The results show that Compared with the situation without spraying graphite, spraying graphite is beneficial to reduce the signal-to-noise ratio, reduce the measurement standard deviation, and improve the measurement accuracy of graphene film. A smaller pulse width will increase measurement accuracy and reduce standard deviation, which will further increase measurement accuracy. The smaller the thickness of the graphene film will reduce the measurement standard deviation and improve the measurement accuracy. The measurement direction also affects the measurement accuracy. When measuring the same graphene film sample, a higher value of thermal diffusivity in the plane direction can be obtained, when the measurement direction is out of plane, the thermal diffusivity becomes very small, meaning that when measure the thermal diffusivity of the graphene film is not in the right direction, the excellent thermal conductivity of the graphene film cannot be truly reflected. In summary, when measuring the thermal diffusivity of the graphene film in the direction of In-plane, more accurate measurement results can be obtained when the surface of the film is sprayed with graphite and the pulse width, and the film thickness is smaller. In addition, uncertainty analysis is also analyzed in detail in this study. The results of uncertainty analysis of different influencing factors also verify the correctness of the measurement conclusions.
This study will help technicians to accurately measure and analyze the thermal conductivity of graphene film materials and determine the heat dissipation effect of graphene products. By effectively evaluating the measurement uncertainty of the thermal conductivity of graphene films, it is easy to optimize the product performance. This research will better promote the research and application of graphene film materials in lithium batteries, supercapacitors, flexible displays, sensors, heat dissipation materials, semiconductor devices, biomedicine and other fields.
References
-
A. A. Balandin, “Thermal properties of graphene and nanostructured carbon materials,” Nature Materials, Vol. 10, No. 8, pp. 569–581, Jul. 2011, https://doi.org/10.1038/nmat3064
-
W. Feng, M. Qin, and Y. Feng, “Toward highly thermally conductive all-carbon composites: structure control,” Carbon, Vol. 109, No. 9, pp. 575–597, Nov. 2016, https://doi.org/10.1016/j.carbon.2016.08.059
-
L. Peng, Z. Xu, Z. Liu, Y. Guo, P. Li, and C. Gao, “Ultrahigh thermal conductive yet superflexible graphene films,” Advanced Materials, Vol. 29, No. 27, p. 17005, May 2017, https://doi.org/10.1002/adma.201700589
-
X.-H. Han, Q. Wang, Y.-G. Park, C. T. ’Joen, A. Sommers, and A. Jacobi, “A review of metal foam and metal matrix composites for heat exchangers and heat sinks,” Heat Transfer Engineering, Vol. 33, No. 12, pp. 991–1009, Sep. 2012, https://doi.org/10.1080/01457632.2012.659613
-
N. Wu et al., “Achieving superior electromagnetic wave absorbers through the novel metal-organic frameworks derived magnetic porous carbon nanorods,” Carbon, Vol. 145, pp. 433–444, Apr. 2019, https://doi.org/10.1016/j.carbon.2019.01.028
-
Y. Kaburagi, T. Kimura, A. Yoshida, and Y. Hishiyama, “Thermal and electrical conductivity and magnetoresistance of graphite films prepared from aromatic polyimide films,” TANSO, Vol. 2012, No. 253, pp. 106–115, Jan. 2012, https://doi.org/10.7209/tanso.2012.106
-
M. Inagaki, Y. Kaburagi, and Y. Hishiyama, “Thermal management material: graphite,” Advanced Engineering Materials, Vol. 16, No. 5, pp. 494–506, Feb. 2014, https://doi.org/10.1002/adem.201300418
-
A. A. Balandin et al., “Superior thermal conductivity of single-layer graphene,” Nano Letters, Vol. 8, No. 3, pp. 902–907, Mar. 2008, https://doi.org/10.1021/nl0731872
-
X. Du, I. Skachko, A. Barker, and E. Y. Andrei, “Approaching ballistic transport in suspended graphene,” Nature Nanotechnology, Vol. 3, No. 8, pp. 491–495, Jul. 2008, https://doi.org/10.1038/nnano.2008.199
-
K. S. Novoselov et al., “Electric field effect in atomically thin carbon films,” Science, Vol. 306, No. 5696, pp. 666–669, Oct. 2004, https://doi.org/10.1126/science.1102896
-
A. K. Geim, “Graphene: Status and Prospects,” Science, Vol. 324, No. 5934, pp. 1530–1534, Jun. 2009, https://doi.org/10.1126/science.1158877
-
K. S. Novoselov et al., “Two-dimensional gas of massless Dirac fermions in graphene,” Nature, Vol. 438, No. 7065, pp. 197–200, Nov. 2005, https://doi.org/10.1038/nature04233
-
X. Gan, R. Lv, T. Zhang, F. Zhang, M. Terrones, and F. Kang, “Transferrable polymeric carbon nitride/nitrogen-doped graphene films for solid state optoelectronics,” Carbon, Vol. 138, pp. 69–75, Nov. 2018, https://doi.org/10.1016/j.carbon.2018.05.035
-
P. Rivera et al., “Observation of long-lived interlayer excitons in monolayer MoSe2-WSe2 heterostructures,” Nature Communications, Vol. 6, No. 1, pp. 72–81, Feb. 2015, https://doi.org/10.1038/ncomms7242
-
J. Nan, X. He, X. Qu, and H. Guan, “Coarse-grained molecular dynamics model to evaluate the mechanical and thermal properties of graphene/copper composites,” Journal of Materials Research, Vol. 3, No. 2, pp. 1–15, Nov. 2024, https://doi.org/10.1557/s43578-024-01490-7
-
H. O. Xe, J. C. Wang, and T. G. Xi, “Heat conduction behavior of thin film: measurement and prediction,” Malerials Science and Technology, Vol. 25, No. 1, pp. 104–112, 2010.
-
M. Ruoho, K. Valset, T. Finstad, and I. Tittonen, “Measurement of thin film thermal conductivity using the laser flash method,” Nanotechnology, Vol. 26, No. 19, p. 195706, May 2015, https://doi.org/10.1088/0957-4484/26/19/195706
-
G. Forte and S. Ronca, “Laser-flash in-plane thermal analysis: the case of oriented UHM WPE,” in American Institute of Physics Conference Series, pp. 425–432, 2016, https://doi.org/https://doi.10.1063/1.4949746
-
L. Ma, R. Srivastava, D. Barpanda, T. Fowler, T. Theophanous, and N. Verghese, “An inverse approach to characterize anisotropic thermal conductivities of a dry fibrous preform composite,” Journal of Reinforced Plastics and Composites, Vol. 32, No. 24, pp. 1916–1927, Aug. 2013, https://doi.org/10.1177/0731684413500857
-
W. J. Parker, R. J. Jenkins, C. P. Butler, and G. L. Abbott, “Flash method of determining thermal diffusivity, heat capacity, and thermal conductivity,” Journal of Applied Physics, Vol. 32, No. 9, pp. 1679–1684, Sep. 1961, https://doi.org/10.1063/1.1728417
-
J. Sun and J. Liu, “Heat leakage correction for measuring thermal diffusivity of materials by laser flash method,” (in Chinese), Metrology Technique, Vol. 3, No. 1, pp. 23–25, 2018, https://doi.org/10.3969/j.issn.1000-0771.2008.01.007
-
O. Y. Troitsky and H. Reiss, “A numerical simulation to propose a flash method for in situ detection of the thermal diffusivity of anisotropic thin film materials,” International Journal of Thermophysics, Vol. 30, No. 4, pp. 1283–1299, Jun. 2009, https://doi.org/10.1007/s10765-009-0597-z
About this article

This work was supported by Beijing Municipal Bureau Science and Technology Plan Project under Grant No. SJKJXM-2023-001 and 2022MK003.
The datasets generated during and/or analyzed during the current study are available from the corresponding author on reasonable request.
Xia Zhao: data curation, software, original draft preparation and editing. Shangyi Shen: reviewing and editing. Jingliang Bi: data curation and supervision.
The authors declare that they have no conflict of interest.
