Abstract
With excellent thermal conductivity and unique two-dimensional structure, the graphene heat dissipation film (GHDF) has been a potential photoacoustic (PA) material for multiple applications. In this study, we apply the GHDF into laser ultrasonic detection of seismic physical model (SPM). The PA effect of the GHDF is theoretically analyzed and experimentally demonstrated. The GHDF is physically attached to the upper surface of SPM, and excited effectively by a 532 nm pulsed laser. Distinguishable layered echo signal of SPM verifies the feasibility of the ultrasonic excitation approach using GHDF. This work opens up a new application of GHDF in ultrasonic detection of SPM.
1. Introduction
Seismic physical model (SPM) is an important method to study the propagation of elastic wave in laboratory [1] The ultrasonic transducer receives the reflected signal inside SPM and the 3D model is reconstructed according to inversion algorithm [2]. However, the conventional ultrasonic source excited by piezoelectric transducers (PZTs) has narrow transmitting frequency and low coupling efficiency, which is not suitable for high resolution detection of SPM [3]. Laser ultrasound, a method of using photoacoustic (PA) effect to excite broadband ultrasonic waves for detection, has been widely used in nondestructive testing [4]. There are also several reports in laser ultrasound imaging of SPM [5, 6]. Finding suitable PA materials is always the key factor for laser ultrasonic detection of SPM.
Graphene is a two-dimensional macromolecule with honeycomb planar monolayer formed by sp2 hybridization of carbon atoms. Its unique two-dimensional crystal structure provides good mechanical strength and thermal conductivity. Graphene and its derivatives are commonly used in biological PA imaging and near-infrared photo-induced photothermal therapy [7]. The excellent thermal conductivity and unique two-dimensional structure of graphene makes it an ideal candidate for heat dissipation films of chips and various electronic devices [8]. The graphene heat dissipation film (GHDF) includes graphene film and reduced graphene oxide film [9]. It has good PA effect, and also can be expanded in a large area with excellent flexibility, which is a high-quality PA material for ultrasonic detection of SPM in this work.
2. Material characterization and theoretical analysis
2.1. Characterization of graphene heat dissipation film
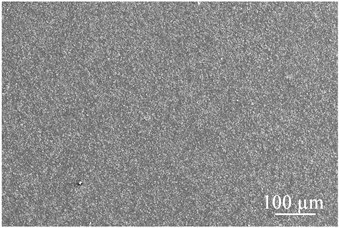
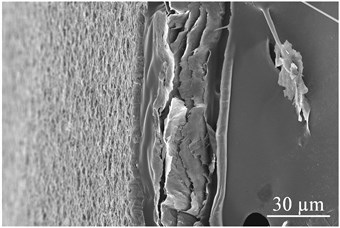
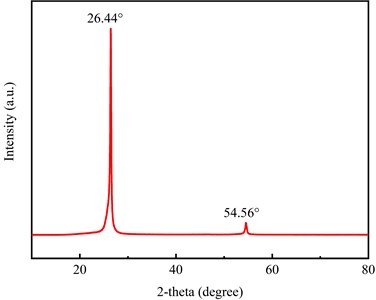
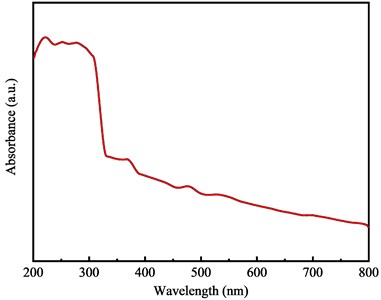
The GHDF has a thickness ranging from 17 µm to 200 µm. Scanning electron microscopy (SEM), x-ray diffraction (XRD, Bruker, D8 Advance) and ultraviolet-visible spectroscopy (UV-vis) are respectively used to characterize the structure and morphology of the GHDF. Fig. 1(a) shows the top-view SEM image of the film with a thickness of 50 µm. The film surfaces have smooth and uniform arrangement. Fig. 1(b) shows the cross section SEM image with film thickness of 50 µm. The multi-layer film structure can be clearly observed.The XRD analysis in Fig. 1(c) shows that the material has a strong characteristic diffraction peak at 2-theta of 26.44°, which corresponds to the (002) crystal plane of carbon. The UV-vis spectrum of GHDF is demonstrated in Fig. 1(d). The curve of the spectrum tends to rise first and then fall, and the material has strong absorption of visible light.
Fig. 1a) Top-view SEM image of the film with a thickness of 50 µm; b) Cross-section SEM image of the film with a thickness of 50 µm; c) XRD pattern of the GHDF; d) UV-vis absorption spectra of the GHDF
a)
b)
c)
d)
2.2. Theoretical simulation
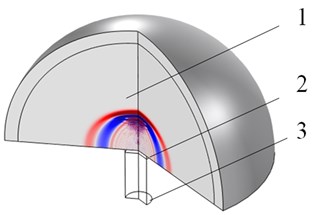
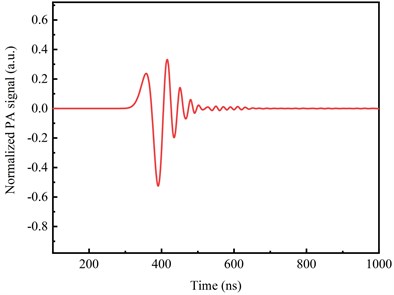
PA effect is actually the interaction between laser and material. The conversion of light energy into heat energy causes the increase of material temperature, which produces thermal expansion and finally results in acoustic waves. A two-dimensional axisymmetric model is developed to simulate the effects of laser and material parameters on PA signal, as shown in Fig. 2(a).
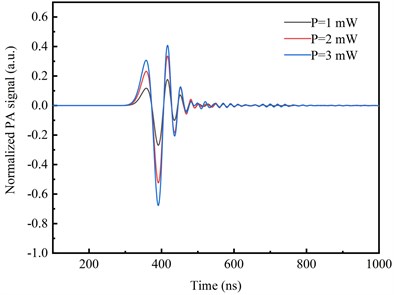
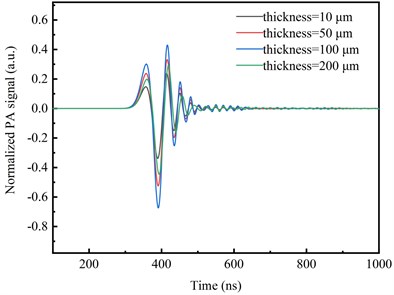
The laser parameters are referenced to the typical commercial laser used in the experiment, where the laser wavelength is 532 nm, pulse power ranges from 1 mW to 3 mW, laser spot radius is 0.1 mm, pulse duration is 8 ns. The simulated PA signal is shown in Fig. 2(b). Because the thermal diffusion has a delay after laser irradiation, there are several attenuated oscillations following the main signal peak. Similar waves can also be observed in measurements. Different laser powers are applied to excite the film and the results are shown in Fig. 2(c). When the laser power is set in the damage threshold range of the film, the signal amplitude increases with the laser power. However, when the laser power exceeds the damage threshold, the material may be gasified. Fig. 2(d) shows the excited signals with the films thickness ranging from 10 µm to 200 µm. When the film thickness is around 100 µm, the signal amplitude reaches the maximum.
Fig. 2a) The ultrasonic excitation in two-dimensional axisymmetric model: 1 – water area; 2 – GHDF; 3 – silica glass substrate; b) PA signal excited in simulation; c) PA signal excited by different laser powers; d) PA signal excited with different thicknesses of films
a)
b)
c)
d)
3. Experimental measurements
3.1. PA signal of GHDF
The PA effect of the GHDF is demonstrated in the system of Fig. 3. A 532 nm pulsed laser is used as the excitation source: the pulse repetition frequency is 1 Hz, the single pulse power ranges from 1 mW to 6 mW, and the spot radius is 1 mm. The nanosecond laser is focused and irradiated on the graphene material through a series of mirrors. The film is attached onto the SPM surface and both of them are placed underwater for laser irradiation. A PZT with a central frequency of 1 MHz is used to receive the ultrasonic waves. An electric moving stage is used here for SPM scanning detection.
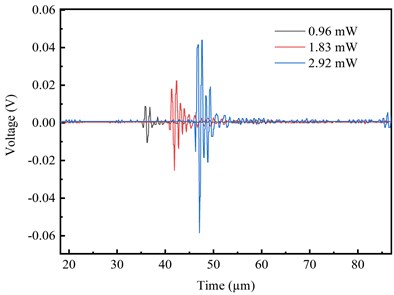
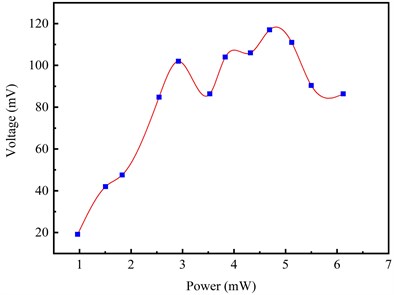
The thickness of the GHDF is 100 μm. Fig. 4(a) shows the signal amplitude change when the laser power increases from 1 mW to 3 mW. It can be seen that the signal pulse widths at different laser powers keep consistent. Fig. 4(b) shows the signal amplitude variation with the laser power increasing from 1 mW to 6 mW. The signal amplitude fluctuates from 4 mW to 6 mW, possibly because of the overloaded laser power reaching the damage threshold of GHDF.
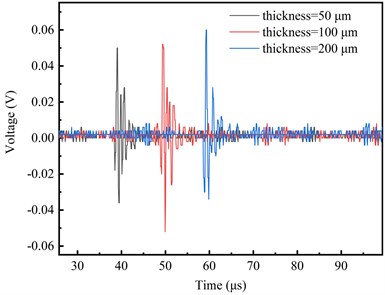
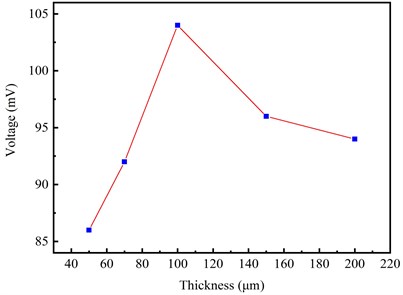
Fig. 4(c) shows the ultrasonic signals with film thicknesses of 50 μm, 100 μm, and 200 μm. The maximum signal amplitude is obtained at the 100 µm thickness, which is consistent with the theoretical calculation. The above acoustic measurements prove the great PA effect of the GHDF, and thus provides a new approach for the subsequent laser ultrasonic detection of physical model.
Fig. 3Experimental set-up: 1 – 532 nm Nd: YAG laser; 2 – PC; 3 – data acquisition card; 4 – mirror set; 5 – PZT; 6 – water tank; 7 – electric moving stage
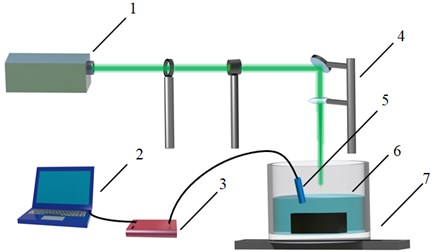
Fig. 4a) Ultrasonic signals with laser powers of 0.96 mW, 1.83 mW, and 2.92 mW; b) signal amplitudes with laser powers increasing from 1 mW to 6 mW; c) ultrasonic pulses with different material thickness, d) variation of signal amplitude with material thickness
a)
b)
c)
d)
3.2. SPM detection
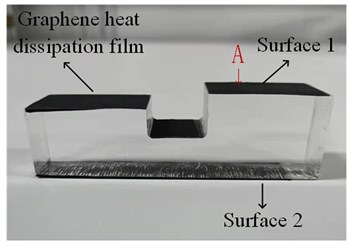
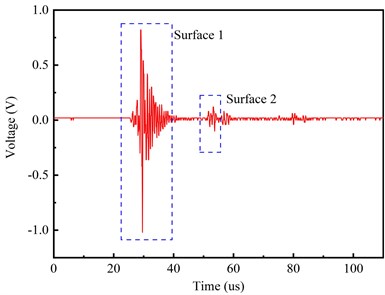
In order to verify the feasibility of GHDF in laser ultrasonic detection of SPM, a simple geological stepped structure is designed in Fig. 5(a). The height is 25 mm, 15 mm, 30 mm from left to right. The ultrasonic waves are effectively excited on surface 1, where the GHDF is attached. The time-domain echo signal of the model at point A is shown in Fig. 5(b), where the first peak signal is from surface 1 and the second peak signal around 53.7 µs is reflected from surface 2. Given the ultrasonic velocity of 2583.33 m/s in the model, the model height at point A can be calculated as 31.12 mm, which agrees well with the actual value.
Fig. 5a) SPM photographs with GHDF coating; b) time-domain echo signal at the point A of SPM
a)
b)
4. Conclusions
In this paper, GHDF is applied as the PA material for laser ultrasonic detection of SPM. We have theoretically analyzed and experimentally demonstrated the PA effect of GHDF by changing the laser power and film thickness. The experimental results show that the GHDF exhibits great PA effect. When applied to SPM detection, the layered information is clearly obtained. Combined with the advantages of easy acquisition and low cost, the large-scale laser ultrasonic imaging of SPM is feasible.
References
-
W. Zhang, F. Chen, W. Ma, Q. Rong, X. Qiao, and R. Wang, “Ultrasonic imaging of seismic physical models using a fringe visibility enhanced fiber-optic Fabry-Perot interferometric sensor,” Optics Express, Vol. 26, No. 8, p. 11025, Apr. 2018, https://doi.org/10.1364/oe.26.011025
-
D. Draganov, X. Campman, J. Thorbecke, A. Verdel, and K. Wapenaar, “Seismic exploration-scale velocities and structure from ambient seismic noise (> 1 Hz),” Journal of Geophysical Research: Solid Earth, Vol. 118, No. 8, pp. 4345–4360, Aug. 2013, https://doi.org/10.1002/jgrb.50339
-
J. Jung et al., “31-mode piezoelectric micromachined ultrasonic transducer with PZT thick film by granule spraying in vacuum process,” Applied Physics Letters, Vol. 110, No. 21, p. 212903, May 2017, https://doi.org/10.1063/1.4983833
-
S. Jeon, J. Kim, J. P. Yun, and C. Kim, “Non-destructive photoacoustic imaging of metal surface defects,” Journal of Optics, Vol. 18, No. 11, p. 114001, Nov. 2016, https://doi.org/10.1088/2040-8978/18/11/114001
-
K. Jin, X. Liu, P. Li, Q. Rong, and X. Qiao, “Improved laser-ultrasonic excitation for imaging of seismic physical modeling,” Applied Physics B, Vol. 127, No. 3, pp. 1–8, Mar. 2021, https://doi.org/10.1007/s00340-020-07559-5
-
X. Liu, W. Wang, Q. Rong, and B. Yu, “Highly sensitive photoacoustic imaging: a new strategy for ultrahigh spatial resolution seismic physical model imaging,” IEEE Photonics Journal, Vol. 12, No. 3, pp. 1–11, Jun. 2020, https://doi.org/10.1109/jphot.2020.2987342
-
J. M. Yoo, J. H. Kang, and B. H. Hong, “Graphene-based nanomaterials for versatile imaging studies,” Chemical Society Reviews, Vol. 44, No. 14, pp. 4835–4852, 2015, https://doi.org/10.1039/c5cs00072f
-
He Yanru, Tian Xiaorang, Zhao Guanchao, Dai Lingling, Nie Ge, and Liu Minsheng, “Research progress in preparation and application of graphene films,” (in Chinese), Materials Reports, Vol. 34, No. 5, pp. 5048–5060, 2020.
-
G. Yang, H. Yi, Y. Yao, C. Li, and Z. Li, “Thermally conductive graphene films for heat dissipation,” ACS Applied Nano Materials, Vol. 3, No. 3, pp. 2149–2155, Mar. 2020, https://doi.org/10.1021/acsanm.9b01955
About this article

This work was supported by National Natural Science Foundation of China (Nos. 61735014, 61927812, 62005214).
