Abstract
Six specimens of high strength concrete columns with butt-welded closed composite stirrups were tested under cyclic lateral loads, to study the structural performance (deformation) and hysteretic characteristics of the columns. The influences of the axial compression ratio and the volume-stirrup ratio were considered. According to the regression analysis of the test results, it was determined that the unloading stiffness and strength degradation rate under repeated loading conditions are mainly dependent on the two parameters of the “displacement ductility factor” and “axial compression ratio”. According to the test results, the skeleton curves were determined by the section layer and the statistical regression analysis methods. By considering the influence of axial compression ratio and the volume-stirrup ratio to the hysteretic characteristics of high strength concrete columns confined by butt-welded closed composite stirrups, the shear force-lateral displacement restoring force model was established. The results show that the axial compression ratio has a great influence on the strength degradation of the columns. As the axial compression ratio increases, the strength degradation of the columns occurs faster. On the other hand, the volume-stirrup ratio has a reverse effect on the strength degradation of the columns, with the increase of the volume-stirrup, the strength degradation of the column is observed gradually and slowly. The stiffness degradation of the columns increases as the axial compression ratio increases while the volume-stirrup ratio decreases.
Highlights
- The hysteretic rule of restoring force model was verified
- The skeleton curves were determined by the statistical regression analysis methods
- The influence of axial compression ratio and volume-stirrup ratio were considered
- The shear force-lateral displacement restoring force model was established
1. Introduction
The restoring force models are a practical mathematical models derived from the restoring force characteristics and deformation relation curves obtained by the test results, which concretely reflects the structural performance and seismic performance of components in the elastic-plastic seismic response analysis of structures [1, 2]. Many scholars at home and abroad have done extensive experimental studies on the restoring force characteristics about concrete frame columns, steel reinforced concrete columns and concrete filled steel tubular columns [3, 4], and offered a series of calculation model for calculating the restoring force characteristics [5]. The under-mentioned research materials for the restoring force models were reviewed [6]. The restoring force model still has the following problems:
1) It does not consider the effect of the axial compression ratio to the skeleton curve and the post-yield unloading rigidity.
2) It does not consider strength degradation under repeated and cyclic loading.
Therefore, it is necessary to execute further experimental studies focused on these problems.
2. Summary of test
Six specimens comprised of high strength concrete columns with butt-welded closed composite stirrups were tested under varying axial force and repeated lateral loads. The test specimens’ section size and reinforcement arrangement are shown in Fig. 1. In order to simulate the high strength concrete columns confined by butt-welded closed composite stirrups with shear span ratio 3.3, we decided to set the distance from the bottom of the columns to the loading point to be 825 mm. The following reinforcement arrangements were considered in this study. Firstly, 8Ø20 longitudinal reinforcement was placed in the columns, and the ratio of longitudinal reinforcement on each side was 2.01%. Stirrups were arranged in Ø10@55 (volume-stirrup ratio 3.63 %), Ø10@70 (volume-stirrup ratio 2.85 %) and Ø10@90 (volume-stirrup ratio 2.22 %). Table 1 indicates the main test parameters of the specimens, where is concrete cubic compressive strength, is volume-stirrup ratio, is test value of axial compression ratio and is test value of axial compressive force.
Table 1Test parameters
Specimens | [MPa] | [%] | [kN] | ||
CCSRC-1 | 53.7 | 3.3 | 3.63 | 0.28 | 500 |
CCSRC-2 | 54.3 | 3.3 | 2.85 | 0.31 | 550 |
CCSRC-3 | 49.7 | 3.3 | 2.22 | 0.37 | 600 |
CCSRC-4 | 51.8 | 3.3 | 3.63 | 0.47 | 800 |
CCSRC-5 | 58.5 | 3.3 | 2.85 | 0.45 | 850 |
CCSRC-6 | 58.5 | 3.3 | 2.22 | 0.46 | 870 |
Fig. 2 shows the loading apparatus. The vertical load was applied to the top of the column by an electric hydraulic jack through a high-pressure oil pump. During the application of the horizontal load, we moved the electric hydraulic jack horizontally and simultaneously taking advantage of the low friction slide plate. The vertical load was applied prior to the horizontal load and remained constant throughout all tests. The horizontal load was applied by MTS Electro-Hydraulic Servo loading system, and its value was automatically controlled by MTS-GT control system. The whole loading process was controlled by displacement characteristics. During the loading period, the displacement amplitude was increased once before and three times after the specimen yield. The test was stopped after the bearing capacity of specimens was decreased to eighty-five percent (85 %) of the maximum bearing capacity.
Fig. 1The test specimens’ section size and reinforcement arrangement
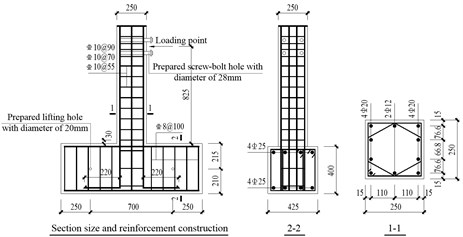
Fig. 2Loading apparatus
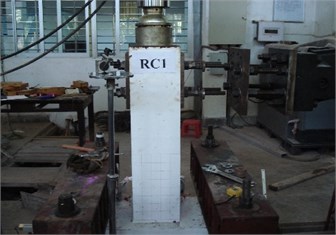
Table 2Loading program
No. | 1 | 2 | 3 | 4 | 5 | 6 | 7 | 8 | 9 |
/ | 1/800 | 1/500 | 1/250 | 1/150 | 1/100 | 1/50(3)*2 | 1/35(3) | 1/25(3) | 1/20(3) |
(mm) | 1.5 | 2.4 | 4.8 | 8.0 | 12.0 | 24.0(3) | 34.3(3) | 48.0(3) | 60.0(3) |
*1: Column drift; *2(3): performed 3 cycles at the corresponding load level; *3: Displacement amplitude | |||||||||
Table 3Mechanical properties of steel reinforcement bars
Steel bar types | [mm] | [MPa] | [με] | [MPa] |
Longitudinal reinforcement | 20 | 315 | 1636 | 404 |
Stirrups | 12 | 410 | 2100 | 460 |
The cyclic reverse loading program was designed in accordance with JGJ/T 101-2015, as shown in Table 2. Table 3 shows the mechanical properties of the steel reinforcement bars.
3. Suggested restoring force model
3.1. Determination of skeleton curves
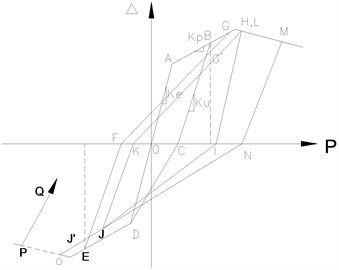
In this research to ascertain the restoring force model of high strength concrete columns confined with butt-welded closed composite stirrups, takes into account the effect of the hysteretic features of members, along the lines of the principles of the maximum degree simplification, and according to the relative test data and /-/ skeleton curves as shown in Fig. 3, the skeleton curves of high strength concrete columns confined by butt-welded closed composite stirrups can be identified to be tri-linear curves as shown in Fig. 4, and the following are the detailed contents.
Fig. 3Non-dimensional skeleton curves
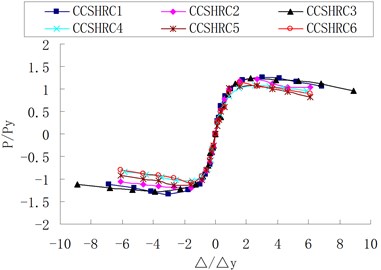
Fig. 4Suggested restoring force model
(1) Elastic stage: The test results show - skeleton curves of high strength concrete columns confined by butt-welded closed composite stirrups have no obvious variation point when concrete samples begin to crack. This is contributed by the arrangement of the butt-welded closed composite stirrups having superior reserve action to concrete crack development. Hence, the concrete initial crack has little effect on the rigidity of the columns. Meanwhile, acknowledging the main purpose of elasto-plastic seismic response analysis is to research properties of the members after having entered into the plastic stage, the skeleton curves of high strength concrete columns confined by butt-welded closed composite stirrups before yielding is simplified by drawing a straight line connecting the origin point and yield point together, to obtain the elastic stage rigidity equation: ( in Fig. 4).
(2) Strengthening stage: The skeleton curves after specimen yield have an obvious strengthening stage. The specimen CCSHRC-1 with axial compression ratio 0.28 has the post-yield strengthen factor of 1.25, while the specimen CCSHRC-4 with axial compression ratio 0.47 has the post-yield strengthen factor of 1.08. Fig. 3 shows that the strengthen factor decreased as the axial compression ratio increased. However, the volume-stirrup ratio has great influence on the length of plastic hinge. Strengthening stage of skeleton curves can be simplified to a straight line segment connecting yield point (, ) (point in Fig. 4) and maximum bearing capacity point (, ) (point G in Fig. 4). Theoretically, to determine the strengthening stage the characteristics of the two point’s parameters (, ) and (, ) must be considered. However, to calculate we must consider many kinds of deformations such as the bending deformation, shearing deformation, and sliding deformation, the second-order effect, the length of the plastic phase hinges and other factors. Theoretical calculation is relatively discrete and complicated for . Therefore, this paper suggests should be determined by empirical method. The polynomial fit method was considered with our test results, the following relationships between length of horizontal projection of the strengthening stages of the non-dimensional skeleton curves () divided by the yield displacement (() /) and it has a one power relationship with the axial compression ratio and the volume-stirrup ratio . After the fitting, the formula was obtained:
The slope of the strengthening stage is:
(3) Strength degradation stage: Fig. 4 shows the strength degradation stage ( line segment) and its rigidity relationships . From Fig. 3, we concluded that the strength degradation stage of the specimens can be simplified to a straight line segment connecting maximum bearing capacity point (, ) (point in Fig. 4) to the maximum displacement amplitudes point, hence the degradation rate of descending stage increased as the axial compression ratio increases. By analyzing the test results, the rigidity degradation rate of descending stage was determined by Eq. (3):
3.2. Determination of unloading rigidity
Fig. 5 shows the changing law of unloading stiffness degradation rate of the specimens with displacement ductility factor under various axial compression ratio and volume-stirrup ratio. According to the test results, when the displacement ductility factor was four, the stiffness of the specimen CCSHRC-1 with axial compression ratio 0.28 decreased by 17.81 %. Similarly, the stiffness of the specimen CCSHRC-4 with maximum axial compression ratio 0.47 decreased by 26.28 %. This decrease cause amplitude relatively increased by 47.6 %. However the stiffness of the specimen CCSHRC-6 with volume-stirrup ratio 2.22 % decreases by 36.10 %. Likewise, the stiffness of the specimen CCSHRC-4 with the maximum volume-stirrup ratio 3.63 % decreases by 26.28 %, and this decrease causes amplitude relatively decrease by 37.4 %. Nevertheless, based on the regression analysis, in this research, the unloading stiffness of restoring force model of high strength concrete columns confined by butt-welded closed composite stirrups was evaluated using Eq. (4), which was deduced from experimental data. After the fitting, the formula was obtained:
where is the equivalent elastic rigidity , and is the yield displacement; is the axial compression ratio of the columns ranged between 0.280.46; is the corresponding displacement amplitudes of unloading point in the skeleton curves; and is the volume-stirrup ratio of the columns ranged between 2.22 % 3.63 %.
3.3. Paths and reduction in strength under cyclic loading conditions
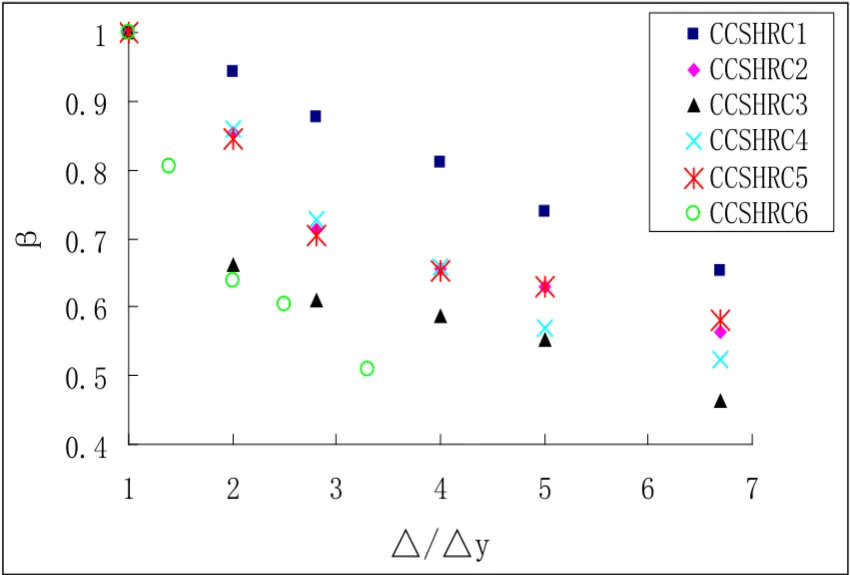
The reloading strength degradation rate () in each cyclic loading under the same displacement amplitudes is directly related to the axial compression ratio of the specimens and the existing value of the displacement amplitudes. The strength degradation rate is usually expressed by the ratio of the maximum horizontal loads at the third and the first cycles under certain level displacement amplitudes. The strength degradation rate of every specimen with various axial compression ratios under various ductility factor are shown in Table 4. According to the test results, when displacement ductility factor was four, the strength of the specimen CCSHRC-1 with axial compression ratio 0.28 decreased by 2.70 %, and for the specimen CCSHRC-4 when axial compression ratio increased to 0.47 its strength reduced by 4.66 %. This decrease cause amplitude relatively increased by 72.6 %; and the strength of the specimen CCSHRC-3 with volume-stirrup ratio 2.22 % decreased by 3.36 %, while the strength of the specimen CCSHRC-1 with maximum volume-stirrup ratio 3.63 % decreased by 2.70 %. This decrease cause amplitude relatively decreased by 24.4 %. Therefore, in the restoring force model, the influence of the axial compression ratio and volume-stirrup ratio to the strength degradation rule must be considered. In this research, by means of the statistical analysis, the strength degradation rate under cyclic loading conditions was evaluated using Eq. (5), which was deduced from experimental data. After the fitting, the formula was obtained:
where is the displacement ductility factor under existing value of the displacement amplitudes ranged between 1 ≤ ≤ 7; and other symbols were the same as above.
Fig. 5Changing law of unloading rigidity degradation rate of the specimens
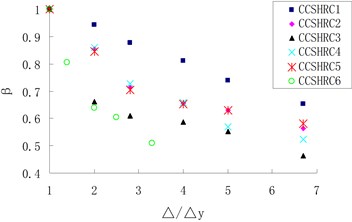
Table 4Strength degradation rate γ under various ductility factor
Specimens | |||||||
1/100 | 1/50 | 1/35 | 1/25 | 1/20 | 1/15 | ||
1 | 2 | 3 | 4 | 5 | 7 | ||
CCSHRC-1 | 1 | 0.9813 | 0.9786 | 0.9730 | 0.9723 | 0.9703 | |
CCSHRC-2 | 1 | 0.9781 | 0.9764 | 0.9756* | 0.9704 | 0.9630 | |
CCSHRC-3 | 1 | 0.9731 | 0.9723 | 0.9664 | 0.9639 | 0.9530 | |
CCSHRC-4 | 1 | 0.9650 | 0.9591 | 0.9534 | 0.9485 | 0.9294 | |
CCSHRC-5 | 1 | 0.9625 | 0.9151 | 0.9433 | 0.9345 | 0.9258 | |
CCSHRC-6 | 1 | – | 0.9648 | 0.9652 | 0.9630 | 0.9414 | |
3.4. Hysteretic loop rule
The following hysteretic loop rule of the restoring force model of the columns was concluded:
(1) The initial sheer force of the members has not exceeded its yield strength, the loading and unloading paths were all along the elastic phase of the skeleton curves ( in Fig. 4).
(2) The shear force of the members once exceeded its yield strength caused the loading paths to extend going forward along the skeleton curves ( in Fig. 4). According to the various displacement amplitudes, and the axial compression ratio as well as the volume-stirrup ratio of the columns, the stiffness from the skeleton curves of unloading patterns can be determined by using Equation (4) ( in Fig. 4).
(3) In consideration to the reverse loading and reloading paths, the initial shear force of the members has not exceeded its yield strength, and the reverse loading paths directly point to the direction of the yield point on the skeleton curves from the corresponding points on the displacement axis after unloading ( in Fig. 4); however, under reverse loading conditions, when the shear force of the members has exceeded yield point of the skeleton curves, the strength degradation amplitude during reverse loading and reloading can be calculated according to the Eq. (5) from the Fig. 4 (points and ). For example, by looking at Fig. 4, the maximum point of the loading phase and the reloading point were determined, and the value for the strength degradation was calculated.
(4) In certain loading condition, if the displacement amplitudes distributions have not exceeded the maximum displacement amplitudes in the same direction, the unloading stiffness value remained the same. However, under the reverse loading and reloading conditions in comparison to the original loading distribution without any consideration to the strength degradation distribution ( and in Fig. 4) the direction remained the same.
4. Conclusions
1) The axial compression ratio had a great influence on the strength degradation of the columns. As the axial compression ratio increased, the strength degradation of the columns occurred more rapidly. On the other hand, the volume-stirrup ratio had a reverse effect on the strength degradation of the columns, as the volume-stirrup ratio increased a gradual and slower strength degradation of the columns was observed. Therefore, the strength degradation rule in the restoring force model was influenced by both the axial compression ratio and volume-stirrup ratio.
2) The two important factors influencing the rigidity degradation of the specimens were the axial compression ratio and the volume-stirrup ratio. Note that the stiffness degradation of the columns increased as the axial compression ratio was increased while the volume-stirrup ratio was decreased. The adequacy of the proposed restoring force model was verified by the influence of axial compression ratio and volume-stirrup ratio to the stiffness degradation rule.
References
-
Z. W. Shan, D. T. W. Looi, and R. K. L. Su, “A novel seismic strengthening method of RC columns confined by direct fastening steel plates,” Engineering Structures, Vol. 218, p. 110838, Sep. 2020, https://doi.org/10.1016/j.engstruct.2020.110838
-
A. Karimipour and V. Farhangi, “Effect of EBR – and EBROG-GFRP laminate on the structural performance of corroded reinforced concrete columns subjected to a hysteresis load,” Structures, Vol. 34, pp. 1525–1544, Dec. 2021, https://doi.org/10.1016/j.istruc.2021.08.089
-
X. Gu, J. Hua, and M. Cai, “Seismic responses of reinforced concrete intermediate short columns failed in different modes,” Engineering Structures, Vol. 206, p. 110173, Mar. 2020, https://doi.org/10.1016/j.engstruct.2020.110173
-
A. Silva, Y. Jiang, J. M. Castro, N. Silvestre, and R. Monteiro, “Monotonic and cyclic flexural behaviour of square/rectangular rubberized concrete-filled steel tubes,” Journal of Constructional Steel Research, Vol. 139, pp. 385–396, Dec. 2017, https://doi.org/10.1016/j.jcsr.2017.09.006
-
N. V. Luat, J. Shin, J. H. Park, and K. Lee, “Experimental and numerical investigation on seismic performance of retrofitted RC columns with web direct/indirect bonding external H-section,” Journal of Building Engineering, Vol. 44, p. 103404, 2021, https://doi.org/10.1016/j.jobe
-
P. D. Gkournelos, T. C. Triantafillou, and D. A. Bournas, “Seismic upgrading of existing reinforced concrete buildings: A state-of-the-art review,” Engineering Structures, Vol. 240, p. 112273, Aug. 2021, https://doi.org/10.1016/j.engstruct.2021.112273
About this article

The authors acknowledge the financial contribution by Grant of National Natural Science Foundation (51578253); Scientific and Technological Planning Guiding Project of Fujian Province (2020Y0087).
