Abstract
A 3D nonlinear impact analysis was performed for reinforced concrete bridge columns under truck impact loadings. Three different boundary conditions were considered to investigate the effect of superstructures on the integral column during impact. Fixed bottom conditions and restraints in the loading direction at the top of the column (Model I) showed the largest damaged area. The dominant failure mode of the column was shear. However, Model II, which is equivalent to Model I with the top released, showed less damage, and the dominant failure modes were flexure rather than shear. In Model III, in which the effect of featured the superstructure was considered, the shear and flexural damage to the column were reduced due to the movement of the superstructures.
1. Introduction
Bridges are essential components of modern infrastructure that support mobility and improve the quality of human life. On the other hand, bridges with structural deficiencies can also be a huge threat to society. In some cases, such structural deficiencies may be caused by vehicle impacts. One of the well-known bridge collapses caused by vehicles was the I-80 bridge collapse in Nebraska, USA. Guardrails did not sufficiently act as protective barriers in that case, and the impact load of trucks resulted in total collapse of the bridge columns and superstructures. According to Hartick et al. [1], there were 114 bridge collapses in the period between 1951 and 1988 due to vehicle collision in the US. Vehicle collision represents 15 % of the total causes of bridge collapse. Wardhana and Hadipriono [2] reported that 14 bridges collapsed due to vehicle impact from 1989 to 2001. Typical locations for possible vehicle impact hit are the superstructures of the bridges [3], the barrier system (NCHRP report 350), the main cables of the bridge [4], and the column of the bridge (El-Tawil et al. 2005).
These types of collisions have been studied by several researchers. Sharma et al. [3] and Kang and Kim [5] studied the effectiveness of bumpers as a protection system against car collision with the superstructure of a bridge. Kim et al. [6] recently compared the results of direct and indirect impact analysis and found that the reaction force obtained from rigid-wall analysis could be substituted for the actual direct load from a truck collision. NCHRP Reports 350 and 663 mentioned highway features such as barrier systems.
Little research has been performed on truck collisions with bridge columns. According to El-Tawil et al. [7], the established design specifications (AASHTO) are not conservative for impact by heavy vehicles such as cargo trucks. Sharma et al. [8] studied the response of bridge columns under vehicle impact loadings. The dynamic shear force capacity of the column and demands on an RC column subjected to vehicle impact were studied for different performance levels. Vehicle collisions were mentioned as the second largest cause of bridge collapse. This is because current design codes such as AASHTO and the Korean Highway Bridge Design Code do not account for dynamic effects in calculating the bridge column capacities. AASHTO LRFD [9] recommends applying a static force (2,669 kN) to the column in a direction of zero to 15 degree at a distance of 1.5 m from ground.
In this study, bridge columns located along the Kyeongbu Highway in South Korea were selected and evaluated under several types of truck impact loadings. The effect of superstructures under dynamic loading was considered. Bridge columns are also shown to be vulnerable to impact loadings from heavy cargo trucks.
2. Construction of collision models
For modeling the impact between a bridge column and trucks, the commercial explicit analysis program LS-DYNA r7.0.0 (LSTC 2014) was selected, and 3-D numerical analysis models were considered. The velocity of the vehicle at the moment of impact was assumed to be 100 km/h, which is the maximum speed allowed on Korean highways.
2.1. Bridge column model
The 3-D numerical analysis model of the bridge was simplified to consider only the bridge column and embedded steel rebars. Soil and column interactions were not considered so that the complexity of the model could be reduced. Cylindrical concrete bridge columns were selected from the typical types that can be found on the Kyeongbu Highway.
Fig. 1Selected bridge types I and II
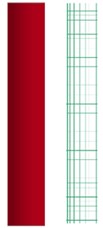
a) Type I
b) Type II
One column type has a height of 7104 mm and diameter of 1200 mm, which is slender compared with other types. The other type of column has a height of 5900 mm and diameter of 2400 mm. For the slender type, D25 and D13 rebar is embedded into the concrete body as longitudinal reinforcements and tie rebar, respectively. For the more massive type, D16, D19, D29, and D32 were embedded as longitudinal reinforcements and tie rebar. The yield stress of the rebar was assumed to be 400 MPa, and the compressive strength of the concrete was assumed to be 30 MPa, which are common values in reinforced concrete structure design.
The fracture energy was calculated based on the compressive strength and maximum aggregate size as 70 N/m. CSCM, a recently developed concrete mechanics model, was selected for concrete material modeling. This model was specifically developed for the analysis of vehicle collisions into concrete structures. Piecewise_Linear_Plasticity was selected for the material model of the steel rebar. This material model considers the Cowper-Symonds equations to account for the strain rate effect. Based on recommendation by Chung et al. [10], the parameter values selected for and were 1.05E+07 sec-1 and 8.3, respectively. Automatic_Single_Surface was selected for the contact condition between the column and vehicles. Steel rebar was embedded into the body of the concrete using the constrained Lagrange in solid option. A fine mesh was used to observe the damage to the concrete (cracks and crushing) and plastic strain in the rebar. The numbers of elements for concrete and rebar were set to 36,800 and 4,700 for the Type I column and 88,900 and 47,226 for the Type II column, respectively. The element types for the concrete and rebar were a cylinder solid and beam, respectively. Detailed boundary conditions for the bridge column are described in a later section.
2.2. Vehicle model
Vehicles were imported from publicly available models released by the National Crash Analysis Center. The selected models were for 10-ton, 16-ton, and 38-ton cargo trucks with trailers. These trucks are standard test trucks in European Standard EN-1317 for designing guardrails. The numbers of elements for the three models were set to 26,990, 32,905, and 52,213, respectively. The vehicle models are composed of shell, solid, beam, and mass elements. Different materials such as steels and rubbers were considered in the vehicle models.
2.3. Boundary conditions
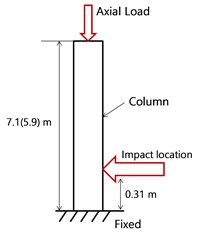
In actual vehicle collisions, the mass of the superstructure could affect the dynamic behavior of the impacted columns. Therefore, the effect of the superstructure was investigated. The boundary conditions between the column and soil were not considered. To simplify a typical column (Fig. 2(a)), three different boundary conditions were considered. The results were compared to investigate the effect of the superstructure on the dynamic behavior of the bridge column.
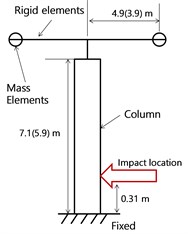
In Model I, the bottom of the column was fixed and the top was restrained in only the loading direction (Fig. 2(b)). In Model II, the bottom of the column was fixed, and all degrees of freedom were released at the top of the column. It was also assumed that the lump-sum mass of the superstructure was acting on the top surface of the column in the longitudinal axis of the column (Fig. 2(c)). In Model III, an integral column affected by the superstructure was considered using rigid bar and mass elements, as shown in Fig. 2(d). The impact location where the truck bumper struck was selected as shown in Fig. 2. The behavior of the bridge column under impact loading was very sensitive to the boundary conditions.
Fig. 2Boundary conditions of the bridge column
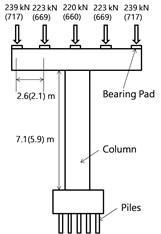
a) Typical column
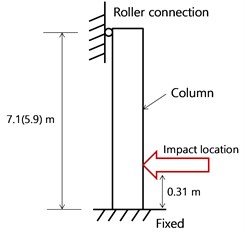
b) Model I
c) Model II
d) Model III
3. Results of numerical analysis
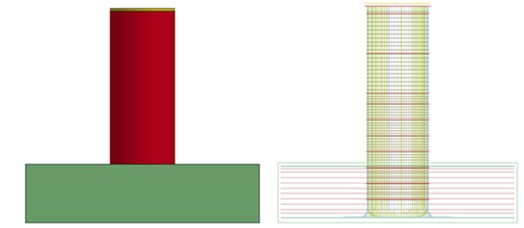
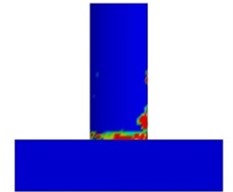
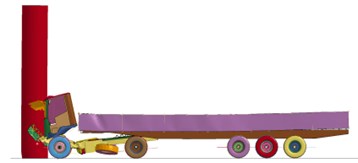
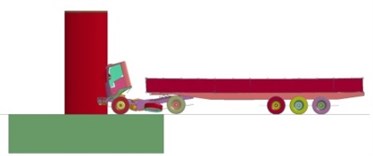
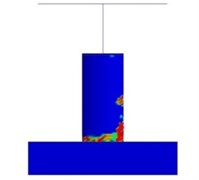
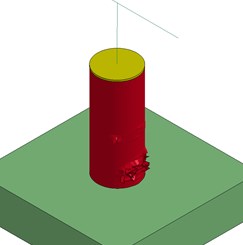
A representative result obtained from the numerical analysis is shown in Fig. 3. The simulation result shows a vehicle colliding with the column of the bridge (Model I). The truck bumper first hit the column and then dynamic cargo movement affected the impact loading on the column. The results are discussed in later sections.
3.1. Model I results
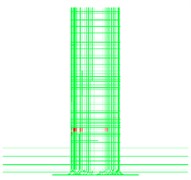
In Model I, shear failures of the Type I column were observed when the 16-ton and 38-ton trucks struck, as shown in Fig. 4. When the 10-ton truck struck, the concrete was damaged and the collision side of the rebar showed low plastic strain. However, when the 16-ton and 38-ton trucks stuck the column, both the concrete and rebar were severely damaged.
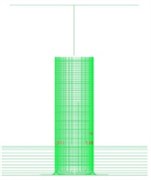
Fig. 3Impact analysis results (Model I-16 ton)
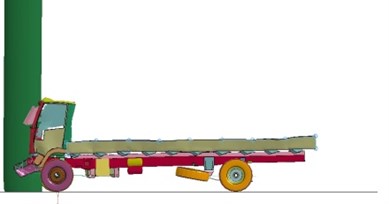
a) Side view
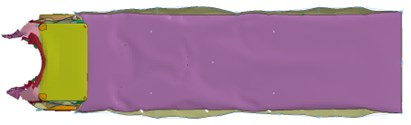
b) Top view
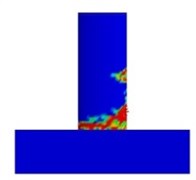
In the residual deformation results, the residual displacements at the rear side of the impacted area for the 16 and 38-ton trucks were 65 mm and 155 mm, respectively, while the 10-ton truck caused a residual deformation of only 1.25 mm. The plastic strain in the rebar shown in Figs. 4(d) and (e) shows that the column completely failed in shear. For the Type II column, local concrete crushing failures were observed with all types of trucks. Particularly, the bottom of the columns connected to the foundation was cracked, as shown in Fig. 4(c). However, plastic deformations in the rebar and shear failure of the concrete were not observed for the Type II column. No penetration, perforation, or spalling failures were observed. This indicates that the more massive Type II is not vulnerable to the truck impact loadings.
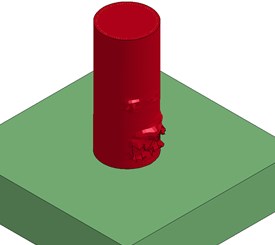
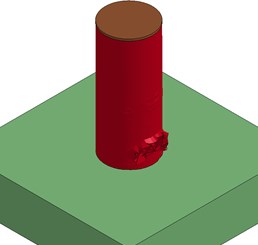
Fig. 4Damaged area of the concrete and plastic strain in steel rebar

a) Concrete (Type I, 16 ton)

b) Concrete (Type I, 38 ton)
c) Concrete (Type II, 38 ton)
d) Rebar (Type I, 16 ton)
e) Rebar (Type I, 38 ton)
f) Rebar (Type II, 38 ton)
3.2. Model II results
In Model II, axial loadings were applied along the length of the column. This boundary condition represents a pinned column. While the axial load was applied, the dynamic relaxation option was used to minimize the dynamic effect. A quasi-static compressive load was applied to the column before the impact with the truck. For Types I and II, 1144 kN and 3434 kN were respectively applied using the dynamic relaxation option. The results are shown in Fig. 5.
There was less damage in Model II than in Model I, and the failure mode was different. In Model I, shear failure was observed from the collision with the 38-ton truck, while in Model II, flexural failure was observed on the collision side of the rebar. Less damage occurred and the dominant failure mode changed in Model II due to the more flexible boundary conditions.
A comparison of Fig. 4(e) and Fig. 5(b) reveals an increased flexural load. Unlike Fig. 4(e), Fig. 5(b) shows a much larger plastic strain region on only the front side, which indicates dominant flexural failure. A secondary concrete crack was formed due to the effect of the axial load with dynamic and second-order effects, as shown in Fig. 5(a). In Model II, the residual displacement at the rear side of the impacted area was 4.5 mm, which is a smaller than that in Model I. However, in the Type II column, the failure mode was local crushing of the concrete column, which was similar to Model I.
Fig. 5Results from Model II
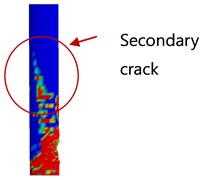
a) Concrete (Type I, 38 ton)
b) Rebar (Type I, 38 ton)
c) Collision (Type I, 38 ton)
d) Concrete (Type II, 38 ton)
e) Rebar (Type II, 38 ton)
f) Collision (Type II, 38 ton)
3.3. Model III results
In Model III, three different types of trucks struck the columns. The effect of a superstructure was investigated in this model, and the boundary conditions represent an integral column. Fig. 6 shows the results. Due to the superstructure mass under the impact loading, larger displacement and shear failure at the bottom area were observed like in Model I. The residual displacement at the rear side of the impacted area was 41 mm.
Fig. 6Model III results
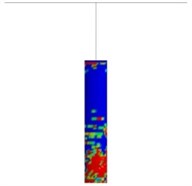
a) Concrete damage (Type I, 38 ton)
b) Rebar damage (Type I, 38 ton)
c) Concrete damage (Type II, 38 ton)
d) Rebar damage (Type II, 38 ton)
This displacement is smaller than that in Models I and II. The mass of the superstructure was first thought to produce an additional moment on the mid-height area of the column when the vehicle impacts the column, resulting in a larger plastic strain zone in the rebar and damaged area in the concrete. However, the additional moment was not significant. Instead, smaller displacement and failure were observed compared to Models I and II. The added mass of the superstructures absorbed a large amount of energy, resulting in smaller displacement compared to the other models.
The dynamic movement of the superstructure did not create a secondary plastic strain region at the rear side of the middle height. The integral column boundary conditions in this model caused a smaller displacement than in Models I and II. Compared to the pinned column in Model II, the integral column was less vulnerable to the impact loading due to the effect of the mass from the superstructures. The addition of superstructures had no effect on the column behavior under the selected impact loadings in this case.
4. Comparison of results
The results from the different models are compared in this section. The aspects compared are the deformed shape of the column, the reaction force-time history curve, and the deformation-time history curves under different truck loadings. A truck collision into a rigid wall was also analyzed and compared with the other simulation data.
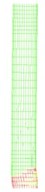
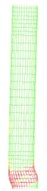
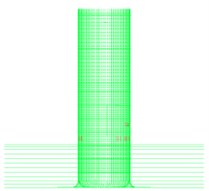
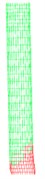
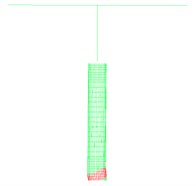
Fig. 7Comparison of deformed shapes (Scale 1 to 30)

a) Type I, Model I

b) Type I, Model II

c) Type I, Model III
d) Type II, Model I
e) Type II, Model II
f) Type II, Model III
4.1. Comparison of deformed shape
The deformed shapes of the Type I and II columns are shown in Fig. 7. The displacement of the node was scaled up by a factor of 30 to facilitate the comparison. The comparison shows that the movement of the superstructure absorbs a certain amount of energy and the additional moment in the column. The specific maximum deformation is discussed in the next section. In Model I, the maximum displacement was observed from the collision area since there was a constrained boundary condition in the loading direction at the top end of the column. Model II shows the largest deformations at the top of the column, indicating that there was larger energy absorption compared to the other models. The largest deformation was observed at the top end of the column since there were no restrained boundary conditions.
The deformed shape looks like an inclined capital “I.” In Model III, smaller displacement was observed at the top end of the column than in Model II due to the effect of the mass element. Smaller displacement was also observed for the collision section compared to other cases. The deformed shape of both Models I and III looks like a “C” shape due to the constrained boundary conditions at the top and the effect of the mass element in the superstructures. These mass elements experienced the initial impact loading, resulting in smaller displacement due to the dynamic effect of the mass elements, as shown in Fig. 6. Since a large amount of impact energy was used to initiate the movement of the mass element, the final displacement decreased compared to Model II. After the initial movement of the mass element, oscillations were generated, but their effect on the overall behavior of the column was negligible. For the Type II column, all models showed similar failure deformation, since only local concrete crushing failure occurred.
4.2. Comparison of force-time history graphs
The force-time history graphs of Models I, II, and III are compared in Fig. 8. The force is the section force of the column. For this comparison, only the 38-ton truck was considered. The graph shows that peak loads (kN) occurred at the moment of collision. The second largest loads were observed due to the impact of the cargo. The peak loads were 7370 kN, 4500 kN, and 4549 kN from Models I through III for Type I, while they were 5500 kN, 4913 kN, and 4426 kN for Type II, respectively.
Fig. 8Reaction force-time history curves
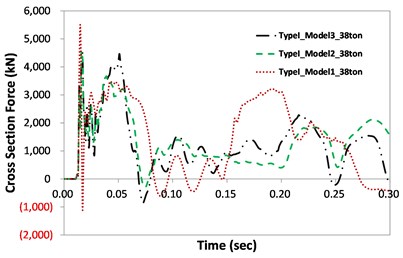
a) Type I
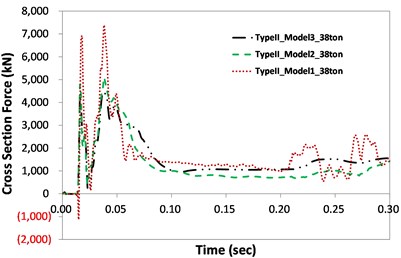
b) Type II
The results indicate that even though the same truck load was applied (38 tons at 100 km/h), the peak loads differed depending on the boundary conditions. Compared to Type I, Type II column analysis shows values that are more similar between the models since no shear failure occurred in the Type II column. The second impacts due to the inertial force from the cargo after impact occurred at approximately 0.198 sec and 0.236 sec for the Type I and II columns, respectively. This indicates that the stiff Type II target column can reduce the collision duration, resulting in a shorter duration of impact. This phenomenon was also found in Model I, which showed greater stiffness due to the boundary conditions. The mass element in Model III affects the cross section force due to the inertia effect after impact. Accordingly, oscillations of the graphs were found in the Model III cases. However, their effect on the overall behavior of the column was negligible.
4.3. Comparison of deformation-time history graphs
Deformations at the rear side of the impacted area were also compared upon collision with 38-ton trucks, as shown in Fig. 9. Large displacement was observed from Model I for the Type I case. In this model, the bottom and top sides of the column were constrained, and shear failure was concentrated in a section of the impacted area, resulting in large concentrated displacement. However, displacements among the three different models with the Type II column were similar because there was no shear failure, only local spalling. The Model III boundary conditions showed the smallest displacement values compared to other cases with the Type I column. This is due to the effect of the mass element of Model III, which absorbed a certain amount of energy. Accordingly, the smallest displacements were observed in both the Type I and II analyses (39 mm and 0.86 mm, respectively). The mass negligibly affected the overall behavior of the Type I and II columns after impact.
Fig. 9Deformation-time history curves
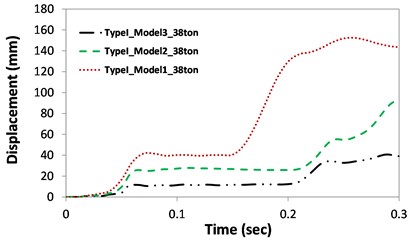
a) Type I
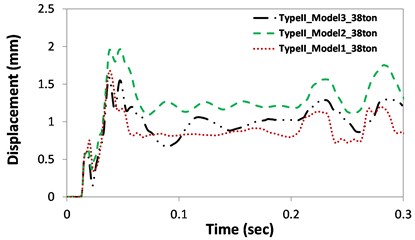
b) Type II
4.4. Rigid-wall impact analysis
A truck collision analysis was also performed with a rigid wall to observe the collision characteristics of each truck, as shown in Fig. 10. The reaction force and time history graphs are strongly related to the mass distribution of the impacting body [11]. Unexpectedly, the largest peak load (13,547 kN) was observed from the 16-ton trucks. The calculated area underneath the curves (impulse) was the largest for the 38-ton truck at 147,846 kN-sec, while the areas for the 10-ton and 16-ton trucks were 16,710 kN-sec and 18,360 kN-sec, respectively. The 38-ton trucks had the heaviest cargo, which led to the largest second impacts on the target. Compared to the AASHOTO recommended static load (2,669 kN), obtained maximum load (13,547 kN) is much higher.
Fig. 10Rigid wall reaction force-time history graphs
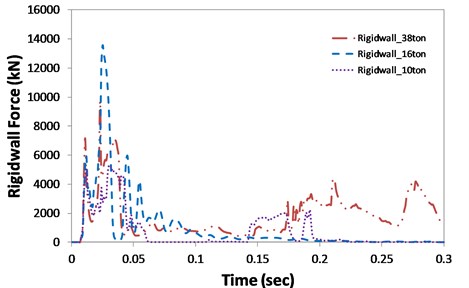
The different mass distributions for each of the trucks led to slightly different characteristics in the time history graphs of the reaction force. Since a rigid wall is a non-deformable body, the shortest duration of collisions was recorded. The rigid wall analysis incurred lower computational cost than the column-truck analysis. Therefore, the reaction force obtained from a rigid wall analysis should be applied to the concrete structures in further study, and the results should be compared with a real impact analysis for efficient analysis.
5. Conclusions
The resistive capacities of bridge columns under impact loadings from vehicles have been presented. Three different sets of boundary conditions were considered to investigate the effect of superstructures for Type I and II columns. The superstructure decreased damage to the concrete and rebar due to the effect of the mass elements. The displacements of the columns were governed by the superstructure when present, and the residual deformations were decreased. The dominant failure modes of all models with the Type I column (slender type) were shear, flexure, and shear plus flexure, respectively. For the Type II column (massive type), the bottom of the concrete column connected to the foundation was cracked. However, plastic deformations in the rebar and shear failure of the concrete were not observed.
The results showed that the Type I bridge column along the Kyeongbu Highway is vulnerable to impact loadings from 16-ton and 38-ton cargo trucks with a speed of 100 km/h. This indicates that 27-ton cargo trucks (the maximum truck loading in South Korea) might cause bridge collapse. The integral column was less vulnerable to the impact loading than the pinned column due to the effect of the superstructure mass element.
Comparison of the three different models revealed different peak loads that depended on the boundary conditions of the target. The stiffer Type II target column reduced the collision duration. The maximum peak loads were observed with the 16-ton trucks. This indicates that the different mass distribution on each of the trucks and the stiffness of the target can lead to slightly different characteristics in the time history graphs of the reaction force. The addition of a superstructure reduced the maximum reaction force and maximum deformation. After movement of the superstructure mass element was initiated, oscillations were generated, but their effect on the overall behavior of the column was negligible.
Even model verification experiments were not conducted, the reliability of the results are ensured by hourglass energy studies, the carefully selected material models and practices, and prior experience with modeling techniques for impact analysis. Consideration of the soil properties and piles, interaction with other columns, and experimental model verification are areas for further study. Other types of vehicles such as dump trucks and other types of columns could also be explored. The impact modeling analysis procedure can also be applied to other cases, such as the containment buildings of nuclear power plants under aircraft impact loading.
References
-
Hartik I. E., Shaaban A. M., Gesund H., Valli G. Y. S., Wang S. T. United States bridge failures, 1951 – 1988. Journal of Performance of Constructed Facilities, Vol. 4, Issue 4, 1990, p. 272-277.
-
Wardhana, K., Hadipriono, F. C. Analysis of recent bridge failures in the United States. Journal of Performance of Constructed Facilities, Vol. 17, Issue 3, 2003, p. 144-150.
-
Sharma H., Hurlebaus S., Gardoni P. Development of a bridge bumper to protect bridge girders from overheight vehicle impacts. Computer-Aided Civil and Infrastructure Engineering, Vol. 23, 2008, p. 415-426.
-
Na S., Cha C., Cho H. Maintenance and examples for the damage of suspension bridge main cable due to car collision. KISTEK, 2013, p. 57-79.
-
Kang H., Kim J. Behavior of column-foundation joint under vehicle impact. Journal of the Korea Concrete Institute, Vol. 26, Issue 3, 2014, p. 393-400.
-
Kim W., Kim K., Lee J. A comparison study of direct impact analysis of vehicle to concrete pier and in-direct impact analysis using load-time history functions. Journal of Computational Structural Engineering Institute of Korea, Vol. 27, Issue 6, 2014, p. 533-542.
-
El-Tawil S., Severino E., Fonseca P. Vehicle collision with bridge piers. Journal of the Bridge Engineering, Vol. 10, Issue 3, 2005, p. 345-353.
-
Sharma H., Hurlebaus S., Gardoni P. Performance-based response evaluation of reinforced concrete columns subject to vehicle impact. International Journal of Impact Engineering, Vol. 43, 2012, p. 52-62.
-
LRFD Bridge Design Specifications – Second Edition. AASHTO-LRFD, Washington, D.C., 2012.
-
Chung C., Lee J., Kim S., Lee J. Influencing factors on numerical simulation of crash between RC slab and soft projectile. Journal of the Computational Structural Engineering Institute of Korea, Vol. 24, Issue 6, 2011, p. 591-599.
-
Riera J. D. A critical reappraisal of nuclear power plant safety against accidental aircraft impact. Nuclear Engineering and Design, Vol. 57, 1980, p. 193-206.
-
NCHRP Report 350. Transportation Research Board National Research Council.
-
NCHRP Report 663. Transportation Research Board National Research Council.
-
Korea Highway Bridge Design Code. Ministry of Construction and Transportation, 2005.
-
LS-OPT User’s Manual. Livermore Software Technology Corporation, Livermore, CA, 2014.
Cited by
About this article

This research was supported by Basic Science Research Program through the National Research Foundation of Korea (NRF) funded by the Ministry of Science, ICT and Future Planning (No. 2015R1C1A1A02036617).
