Abstract
The collision force of a heavy rail transit vehicle hitting a bridge pier is affected by many factors. In order to investigate the characteristics of the collision force when a heavy rail transit vehicle hits a bridge, the finite element software LS-DYNA is used to simulate the impact of a heavy rail transit vehicle on a bridge. The influence of the vehicle speed of heavy rail transit vehicles, the strength of bridge pier concrete, the spacing of pier stirrups, the ratio of pier stirrup reinforcement, and the eccentric distance between the vehicle and the bridge pier on the characteristics of the collision force. The simulation analysis results show that the total deformation frequency around the impact point of the bridge pier and the heavy rail transit vehicle decreases as the distance from the impact point increases, and the deformation frequency in the vicinity of the impact point is the largest. The speed of the heavy rail transit vehicle, the concrete strength of the bridge pier, the reinforcement ratio of the pier stirrup, the larger the eccentric distance between the vehicle and the bridge pier, and the smaller the spacing between the stirrups, the greater the collision force when the heavy rail transit vehicle hits the bridge pier.
Highlights
- The material model of heavy rail vehicle is *MAT_ PLASTIC_ KINEMATIC (MAT_3)
- The bridge finite element model is made of linear elastic material, and nonlinear elastic material
- Use the central difference method
1. Introduction
Railway transportation is the main mode of transportation in China. Because of its large transportation volume, fast operation speed and low transportation cost, it undertakes the main tasks of passenger and cargo transportation in China. China’s existing railways are more than 70000 kilometers. In the past few decades, the main railway trunk lines have achieved six large-scale speed increases. Among them, the sixth large-scale speed increase is the speed increase of 200 kilometers implemented on existing trunk lines such as Beijing Harbin, Beijing Shanghai, Beijing Guangzhou, Longhai, Zhejiang Jiangxi, Jiaoji, Wuhan Kowloon, Guangzhou Shenzhen lines, and the train speed of conditional lines can reach 250 kilometers per hour. Therefore, the rapid and efficient railway transportation will promote the sustained and rapid development of the national economy [1].
Operational safety is an important requirement in the transportation industry, and rail transportation is a relatively safe mode of transportation. The characteristics of track guidance and signal control have realized the safe operation of the train [2]. Although the incidence of railway collision accidents is low, due to the large number of passengers, the consequences of an accident will be very dire. In recent years, the global railway traffic accident rate has been on the rise, and high speed and safety are an important issue faced by all countries in the world [3].
According to the literature, in the 10 years from 1972 to 1981, there were 83 major railway accidents and 68 deaths in Britain; Between 1980 and 1989, the death toll increased to 165, an increase of 140 %. On December 14, 2004, a fast train collided with an ordinary bus near Menser village, Hoshyapur District, India. About 50 people were killed and 150 injured in the accident. On January 26, 2005, a train in California derailed after colliding with a car parked on the track, and then collided with another oncoming intercity train, killing 10 people and injuring about 200. This is the deadliest train accident in the United States since March 15, 1999. On the morning of April 25, 2005, a major train derailment accident occurred in Nizaki City, Hyogo Prefecture, Japan, killing 107 people and injuring more than 400 people, making it the most serious accident in Japan in more than 40 years [2]. On August 21, 2006, two trains collided in the Nile Delta north of the Egyptian capital Cairo, killing at least 80 people and injuring 163 others. On the morning of December 28, 2006, a bus collided with a freight train in the central Mexican city of Cuotitland, killing 22 people and injuring more than a dozen others. On the afternoon of June 5, 2007, an Australian passenger train derailed after colliding with a truck when it was driving near Swan mountain in Northwest Victoria, killing at least 8 people and injuring more than 50 people. On December 19, 2007, a passenger train loaded with holiday passengers derailed in southern Pakistan, killing at least 58 people and injuring more than 120.
Since the mid-1980s, Britain, France, Germany, the United States, Japan and other countries have successively carried out a lot of research on the collision resistance technology of rolling stock, including the investigation and analysis of railway + road collision accidents, the theoretical analysis of vehicle impact behavior, rolling stock Crash-resistant structure design and energy absorption evaluation criteria, computer simulation and vehicle crash test [4]. British Railways carried out in-depth theoretical analysis and experimental research on railway vehicle collisions earlier. Based on the crash test of several representative old vehicles, the anti-collision car structure with driver’s cab is designed by summarizing and improving [5]. The car underwent overtaking and non-overtaking crash tests. From November 1999 to February 2004, led by the U.S. Railway Administration, Volpe National Transportation Center conducted a series of comparative tests such as single-vehicle collision, two-vehicle collision, and single-vehicle collision obstacles, which were used to verify the traditional vehicle and the endurance test. The difference in impact resistance performance of vehicles with improved design of impact, which is currently the world’s comparative systematic full-scale series of crash tests [6].
The research on vehicle axle collision has become a research hotspot in recent years [7]. However, due to the high cost of axle crash tests, there are few reports on full-scale crash tests. The research on the crashworthiness of a new type of driverless subway train began in literature [8]. This paper takes a certain type of driverless subway train as the research object, takes the train crashworthiness as the research goal, and uses the numerical simulation analysis method to study and evaluate the train crashworthiness. The experimental results show that when the train collides with a stationary train at an initial speed of 25 km/h, the coupler buffer, collapse tube and anti creep energy absorption device can absorb all the collision kinetic energy to cushion the impact and protect the safety of passengers. In literature [9], two materials commonly used for crushing energy absorption devices of urban rail transit vehicles were tested, and the effects of wall thickness, impact speed, and cone angle on their axial crashworthiness under impact dynamics were studied by numerical simulation, so as to complete the scheme design with better performance. The study of this method shows that 5083H111 material has better crashworthiness. Due to the rapid development of computer hardware and simulation software, axle crash simulation research is very extensive. Therefore, this paper proposes a numerical simulation and analysis method for the impact force characteristics of heavy rail transit vehicles. Through the numerical simulation of heavy rail transit vehicles, the characteristics of impact force are analyzed.
2. Numerical simulation of heavy rail transit vehicle collision and analysis method of collision force characteristics
2.1. Material model of heavy rail transit vehicle
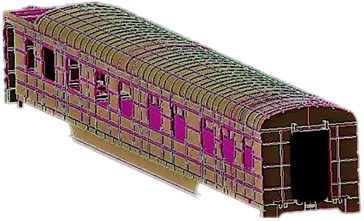
In the process of collision, the main deformation of heavy rail transit vehicles is concentrated in the front part of the car, while the deformation of the middle and rear part of the car is small [10]. After referring to a large number of relevant literature, according to the performance and use of various material models, this paper finally selects the material model of heavy rail transit vehicle as *MAT_PLASTIC_KINEMATIC(MAT_3), another advantage of this model is that it can effectively simulate the failure of the vehicle due to the excessive stress of some components and the impact on the calculated structure during the collision [11]. Its strain rate effect is expressed by the following equation:
where is the deformation stress value of the heavy rail transit vehicle material; is the static stress value; and are the strain rate parameters of the heavy rail transit vehicle material; is the yield stress of the heavy rail transit vehicle material.
The parameters of the constitutive model of the head material of the heavy rail transit vehicle are shown in Table 1. The parameters in Table 1 are specifically described: is the density of the heavy rail vehicle material; is the Young’s modulus of the heavy rail vehicle material; is the Poisson’s ratio of the material; is the tangent modulus of the heavy rail vehicle material; is the heavy rail vehicle material.
Table 1Constitutive model parameters of vehicle head material
Parameter | Numerical value |
(t·mm-3) | 78.6×10⁻⁸ |
(MPa) | 2.2×10⁵ |
0.4 | |
(MPa) | 237 |
(MPa) | 1.3×10⁵ |
(s-1) | 42 |
6 | |
0.4 |
Table 2Values of material model parameters in the middle and rear of car body
Parameter | Numerical value |
(t·mm-3) | 9×10⁻⁹ |
(MPa) | 2.2×10⁹ |
0.5 | |
0 | |
0 | |
0.8 |
The middle and rear parts of the vehicle body of heavy rail transit vehicles include carriages, girders and wheels, etc., and rigid connections are used between the various components [12]. The material constitutive model of the carriage, girder and wheel is set by the keyword *MAT_RIGID. Refer to the literature. The values of the material model parameters of the middle and rear parts of the car body are shown in Table 2, where, and are the plasticity values of the heavy rail vehicle material; is the mass constraint type parameter.
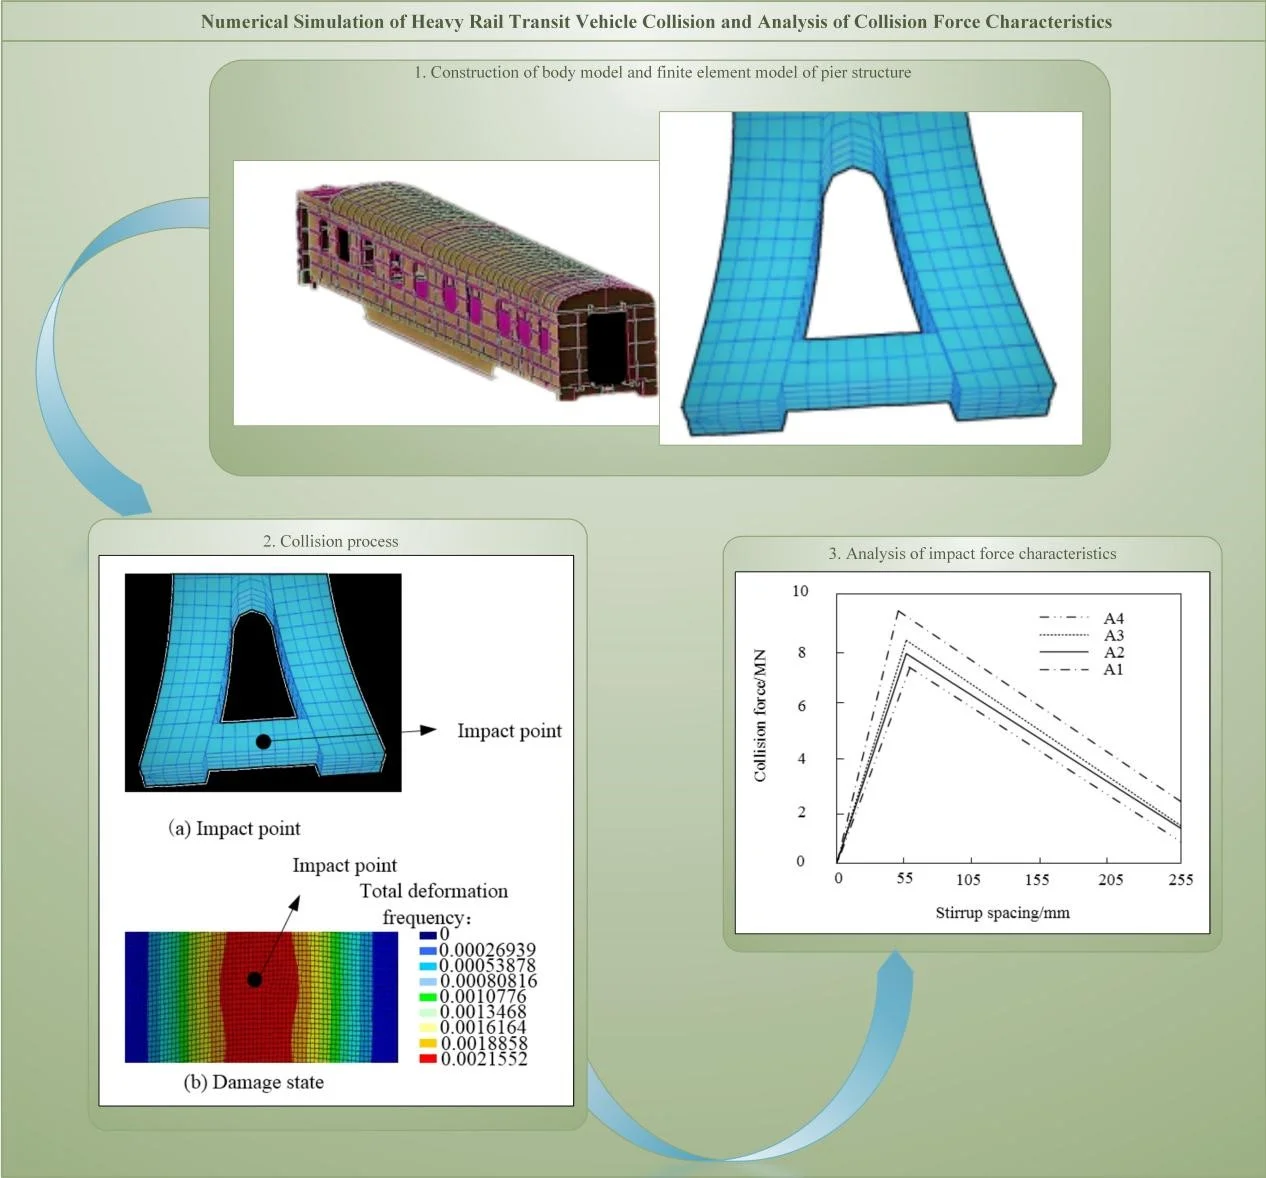
The body model is shown in Fig. 1.
Fig. 1Car body model
2.2. Bridge material mode
A typical urban bridge structure is selected as the research object. The upper structure is composed of bridge deck, guardrail, I-shaped main beam supporting the bridge deck, and spacer beam connecting the upper structure of two spans. The substructure of the bridge is composed of cover beams and double-column piers [13]. Since the bridge superstructure is not continuously poured, only the substructure and the two-span superstructure above it are simulated [14].
The bridge deck of the superstructure is 14.16 m wide and 0.3 m thick, supported by 6 I-shaped girders with a spacing of 2.5 m, the height of the guardrail is 0.84 m, and the height of the I-shaped girders is 1.15 m. The deck of the bridge adopts layered shell elements, distinguishing the steel layer and the concrete layer. Beam elements are used for concrete guardrails, I-shaped girders and partition beams, and discrete beam elements are used for rubber bearings [15]. Since the bridge colliding components studied are piers, and the failure mode of bridges subjected to vehicle collision has typical local effects, this paper does not consider the extreme cases of damage and fall of the superstructure [16]. The upper structure is made of linear elastic material, and the rubber support is made of nonlinear elastic material. This material allows the compressive stiffness to be defined in the vertical direction of the support, the tensile stiffness is zero, and the tensile and compressive stiffness is defined in the horizontal direction, and the element can be defined. When the substructure of the bridge fails, the superstructure and the substructure can be disconnected from the connection [17]. The finite element model of the bridge pier structure is shown in Fig. 2.
The steel material parameters of the substructure of the bridge are shown in Table 3.
Fig. 2Finite element model of bridge pier structure
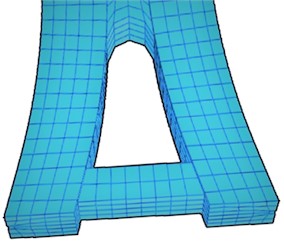
Table 3Reinforcement material parameters of bridge substructure
Parameter | Numerical value |
Density (kg·m-3) | 7850 |
Yield strength (MPa) | 415 |
Modulus of elasticity (MPa) | 215000 |
Tangent modulus (MPa) | 2500 |
Poisson’s ratio | 0.4 |
Hardening parameters | 0 |
2.3. Finite element software LS-DYNA
LS-DYNA is a world-renowned general-purpose display nonlinear dynamic analysis program capable of simulating various complex problems in the real world [18]. It has powerful analysis capabilities, rich material model library, easy-to-use cell library and adaptive meshing functions. It is especially suitable for solving geometric nonlinear, material nonlinear and contact nonlinear problems, such as explosion and impact, structural collision, metal forming problems [19]. It is mainly based on explicit analysis and supplemented by implicit analysis; it is mainly based on Lagrange algorithm, and has both ALE and Euler algorithms. It shows that the dynamic analysis adopts the central difference method, and the acceleration vector of each node of the structural system at the end of the -th time step is calculated by the real formula:
Among them, is the vehicle impact force on the pier structure at the end of the -th time step (including the equivalent nodal force converted from the distributed load); is the internal force vector of the bridge pier structure at the -th time, which consists of the following items:
Among them, is the equivalent nodal force of the element stress field of the pier structure at time ; is the hourglass resistance; is the contact force vector when the pier collides with the vehicle.
2.4. Simulation test design
2.4.1. The influence of vehicle speed on collision force
When simulating the impact test of a heavy rail vehicle, in order to analyze the impact of the speed of the heavy rail vehicle on its collision force, the concrete strength of the bridge pier hit by the vehicle is set to be A1 level, the stirrup spacing is 55 mm, and the pier stirrup reinforcement ratio is 0.24 %. The eccentric distance from the bridge pier is 0.4 m, the vehicle mass is 10 t, and the vehicle speed is selected to be 45 km/h, 65 km/h, 85 km/h, and 105 km/h for numerical simulation of impact.
2.4.2. The influence of concrete strength of bridge piers on collision force
When simulating the impact test of a heavy rail vehicle, in order to analyze the influence of the pier concrete strength on the impact force, the pier concrete strength is set to A1, A2, A3, A4, the stirrup spacing is 55 mm, the pier stirrup reinforcement ratio is 0.24 %. The eccentric distance from the bridge pier is 0.4 m, the vehicle mass is 10 t, and the vehicle speed is 45 km/h, and the impact numerical simulation is carried out.
2.4.3. The influence of the pier stirrup spacing on the collision force
The configuration of stirrups has a restraining effect on the concrete, which can not only improve the strength of the restrained concrete, but also enhance the transverse shear capacity of the concrete column. Select bridges with 5 m, 7 m and 9 m high piers, set the concrete strength of the piers hit by the vehicle to be A1, the stirrup spacing is 55 mm, the eccentric distance between the vehicle and the pier is 0.4 m, and the 45 t vehicle hits at a speed of 85 km/h, the stirrup spacing are 55 mm, 105 mm, 155 mm, 205 mm and 255 mm with corresponding stirrup reinforcement ratios of 0.95 %, 0.75 %, 0.55 %, 0.35 % and 0.15 %.
2.4.4. The influence of the pier stirrup reinforcement ratio on the collision force
By changing the stirrup diameter, the stirrup reinforcement ratio is changed, and the parameter influence analysis of the stirrup reinforcement ratio is carried out. Bridges with piers of 7 m and 9 m high are selected, and the concrete strength of the piers hit by vehicles is set to be A1 level, and the stirrup spacing is 55 mm, the eccentric distance between the vehicle and the bridge pier is 0.4 m, the vehicle with the impact mass of 45 t hits at a speed of 85 km/h, the diameter of the stirrup is 17 mm, 19 mm, 21 mm, 23 mm and 25 mm, and the stirrup reinforcement ratio is 0.24 %, 1.16 %.
2.4.5. The influence of the eccentric distance between the vehicle and the bridge pier on the collision force
Under different eccentric distances, the contact parts between the vehicle and the bridge pier are different, resulting in a large difference in the collision force. When the elastic modulus of the vehicle cargo is set to 15 MPa, 103 MPa, and 105 MPa, this value represents the cargo carried by the heavy rail transit vehicle. Stiffness, impact the bridge pier in three cases with eccentricity of 0 m, 0.2 m and 0.4 m respectively, and other conditions are consistent with the above test settings.
2.4.6. The influence of vehicle mass on collision force
The speed of the vehicle is kept at 45 km/h (13888.889 mm/s) unchanged, while the mass of the vehicle is selected as 10 t, 20 t, 30 t, and 40 t to hit the bridge pier in the forward direction, and the collision force during the collision process is analyzed. Other conditions are the same as the experimental settings above.
3. Results and analysis
3.1. Finite element analysis results and analysis of the collision process
The 45 t vehicle is used to hit the bridge pier at a speed of 85 km/h. The impact point is shown in Fig. 3(a), and the damage status of the bridge pier during the collision is shown in Fig. 3(b).
Fig. 3Finite element analysis results of collision process
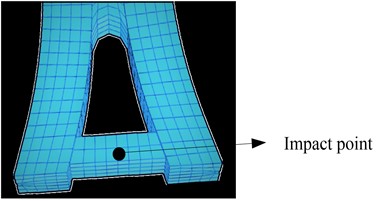
a) Impact point
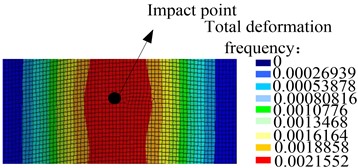
b) Damage state
As shown in the figure, the total deformation frequency around the impact point of the bridge pier and the heavy rail transit vehicle decreases as the distance from the impact point increases, and the deformation frequency in the vicinity of the impact point is the largest.
Judging whether the above analysis results are correct is generally obtained by comparing experimental or engineering data, and the correctness of the finite element calculation itself can also be evaluated from the perspective of energy. Energy conservation is a criterion for judging whether the simulation results themselves are reasonable. Total energy = internal energy + kinetic energy + slip energy + hourglass energy, hourglass energy and slip energy should generally not exceed 10% of the internal energy. Here, only the energy change under a load of 10 t is selected for inspection. The time course of energy change is shown in Table 4.
During the impact process of the heavy rail transit vehicle hitting the bridge pier, the energy change is directly extracted from the calculation result by the software. When the time is 0.17 s, the total energy is 2.100×10⁶ J, the kinetic energy is 0.045×10⁶ J, and the internal energy is 1.978×10⁶ J, so it can be seen that the sum of hourglass energy and slip energy is indeed lower than 10 % of the internal energy, which shows that the finite element analysis results are reliable.
3.2. Influence of vehicle speed on collision force
The change characteristics of the collision force with the speed change during the impact process of the heavy rail transit vehicle hitting the bridge pier are analyzed, and the simulation results are shown in Fig. 4.
Table 4Time history of energy change
Time / s | Internal energy | Kinetic energy | Total energy |
0.01 | 0.000 | 2.100 | 2.100 |
0.02 | 0.000 | 2.100 | 2.100 |
0.03 | 0.000 | 2.100 | 2.100 |
0.04 | 0.025 | 1.600 | 2.100 |
0.05 | 0.050 | 1.500 | 2.100 |
0.06 | 0.090 | 1.300 | 2.100 |
0.07 | 1.200 | 1.000 | 2.100 |
0.08 | 1.250 | 0.900 | 2.100 |
0.09 | 1.500 | 0.800 | 2.100 |
0.10 | 1.600 | 0.700 | 2.100 |
0.11 | 1.700 | 0.600 | 2.100 |
0.12 | 1.800 | 0.500 | 2.100 |
0.13 | 1.900 | 0.400 | 2.100 |
0.14 | 1.900 | 0.300 | 2.100 |
0.15 | 1.900 | 0.200 | 2.100 |
0.16 | 1.900 | 0.100 | 2.100 |
0.17 | 1.978 | 0.045 | 2.100 |
0.18 | 1.978 | 0.000 | 2.100 |
0.19 | 1.978 | 0.000 | 2.100 |
0.20 | 1.978 | 0.000 | 2.100 |
Fig. 4Influence of vehicle speed on collision force
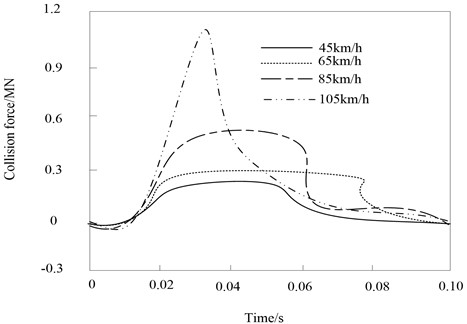
In the process of heavy rail transit vehicle impacting the pier, the peak value of vehicle impact force increases with the increase of vehicle speed. The peak value of impact force is the largest and the peak duration is the shortest at 105 km/h.
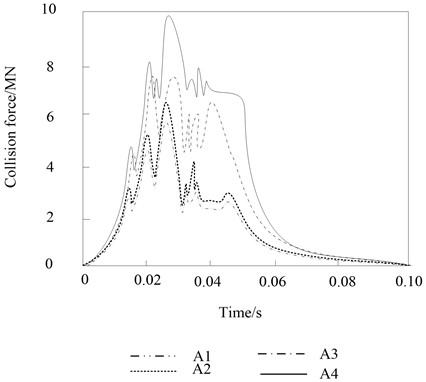
3.3. Influence of concrete strength of bridge piers on collision force
Fig. 5 shows the simulation results of the influence of the concrete strength of the bridge pier on the impact force during the impact process of the heavy rail transit vehicle hitting the bridge pier.
The peak size of the pier collision force of concrete A1, A2, A3 and A4 is A1 < A2 < A3 < A4. With the increase of concrete strength, the ductility of concrete decreases. During the impact process of heavy rail transit vehicles hitting the bridge pier, the structural deformation capacity of the bridge pier decreases, and the collision force increases.
Fig. 5Effect of concrete strength on impact force
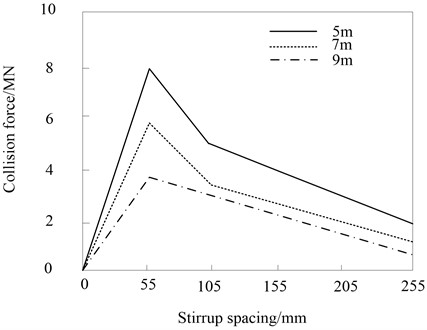
3.4. Influence of stirrup spacing on collision force
During the impact process of a heavy rail transit vehicle hitting a bridge pier, the peak value of the collision force under different bridge heights and stirrup spacings is shown in Fig. 6.
Fig. 6Peak value variation of impact force under different bridge height and stirrup spacing
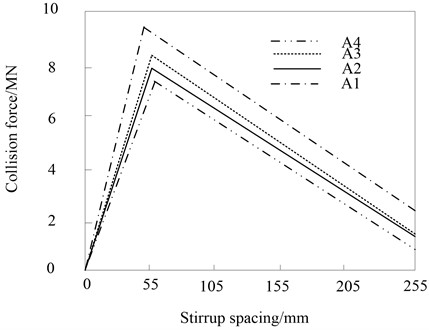
During the impact process of a heavy rail transit vehicle hitting a bridge pier, the peak value of the collision force under different concrete strengths and stirrup spacings is shown in Fig. 7.
With the densification of the spacing of the stirrups, the restraint capacity of the stirrups increases, and the strength of the concrete in the core area also increases, and the piers behave more rigidly under the impact of heavy rail transit vehicles, so the magnitude of the collision force increases. Especially when the stirrup spacing is about 55 mm, the restraint effect is more significant. For the piers of 5 m, 7 m and 9 m in Fig. 5, the peak value of the collision force with a stirrup spacing of 55 mm is larger than that with a stirrup spacing of 255 mm. The densification also reduces the amount of pier deformation during impact.
Fig. 7Peak value of impact force under different concrete strength and stirrup spacing
3.5. Influence of stirrup reinforcement ratio on collision force
In the impact process of the heavy rail transit vehicle hitting the bridge pier, the influence of the stirrup reinforcement ratio on the peak value of the collision force is shown in Table 5. Under the same impact, the structure with high stirrup reinforcement ratio appears “hard”, and the pier collides with higher force.
Table 5Peak value of impact force of different stirrup reinforcement ratio (Company/MN)
Stirrup diameter | Bridge height 7 m | Bridge height 9 m | ||
Stirrup reinforcement ratio is 0.24 % | Stirrup reinforcement ratio is 1.16 % | Stirrup reinforcement ratio is 0.24 % | Stirrup reinforcement ratio is 1.16 % | |
17 | 9.69 | 9.12 | 8.91 | 8.63 |
19 | 9.93 | 9.36 | 9.27 | 9.16 |
21 | 10.35 | 9.93 | 10.01 | 9.82 |
23 | 10.77 | 10.53 | 10.74 | 10.33 |
25 | 12.15 | 11.31 | 11.46 | 10.61 |
3.6. Influence of the eccentric distance between the vehicle and the bridge pier on the collision force
During the impact process of heavy rail transit vehicle impacting the pier, the simulation results of the impact of the eccentricity between the vehicle and the pier on the impact force are shown in Fig. 8.
The results show that during the impact process of the heavy rail transit vehicle hitting the bridge pier, when the cargo stiffness of the heavy rail transit vehicle is small, the peak value of the collision force under different collision eccentricities is relatively close. When the cargo stiffness is larger, there is a significant difference in the peak impact force in the second stage. This is mainly because when the eccentricity is large, the heavy rail transit vehicle directly collides with the bridge pier, and the peak value of the collision force is directly determined by the contact stiffness between the cargo and the bridge pier. Because the stiffness of the bridge pier is very large, high and narrow collision force will inevitably occur under the impact of the vehicle carrying the goods with greater stiffness. Therefore, when the rigidity of the cargo carried by the heavy rail transit vehicle is relatively large, the impact of the eccentric distance on the collision effect of the bridge pier should be carefully considered.
Fig. 8Influence of eccentricity between vehicle and pier on collision force
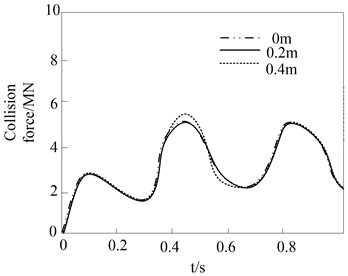
a) 15 MPa
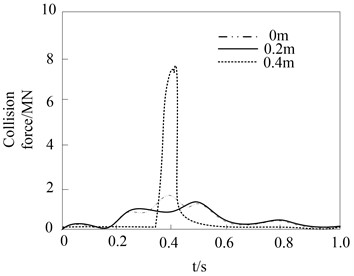
b) 103MPa
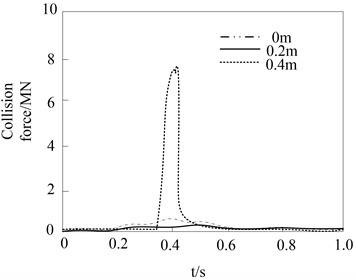
c) 105MPa
3.7. Influence of vehicle mass on collision force
The simulation results of the impact of vehicle mass on the collision force are shown in Fig. 9.
Fig. 9Influence of vehicle mass on collision force
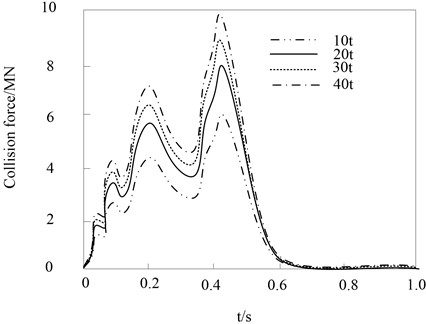
The results show that the time-history curves of the collision forces of different masses are roughly the same, and the four curves almost overlap at the initial stage of the collision. During the entire collision period, there will be large wave peak fluctuations around 0.45 s. The collision force then decreases drastically with time. This is because the front shell of the vehicle is in contact with the bridge pier at the initial stage of the collision. As the collision continues, the internal structure of the front of the vehicle will act, and the rigidity of the overall structure will increase to increase the collision force. The vehicle then rebounds and the impact force decreases with the impact time. And as the mass of the vehicle increases, so does the time at which the impact force time course ends. The reason is that the mass of the vehicle increases, the momentum at the same speed increases, and the impact force also increases.
4. Discussion
Combined with the research content of this paper, the problems existing in the safety of heavy rail transit vehicles are discussed.
4.1. The management of the team of drivers and passengers needs to be strengthened
Firstly, the professional quality of drivers and passengers needs to be improved. At present, most of the heavy rail car drivers in active service in China’s railway have no locomotive driving learning experience in colleges and technical secondary schools, lack of locomotive driving and corresponding maintenance theory, and there are more violations in the process of operation, which brings more risks to the use of heavy rail cars. Secondly, for the drivers and passengers, the operating standards in the process of work are unreasonable. Some drivers do not conduct the “five-step brake” test on the brakes before starting work, resulting in a serious shortage of pressure holding time [20]. When the main and auxiliary drivers monitor the data, there is no double-checking mechanism, so inconsistent data often appears on the display, which will cause the GYK monitoring device to open abnormally. During the work process, some drivers and passengers appear to have incorrect postures for answering calls and inconsistent voices. Thirdly, drivers and passengers are slow to respond to emergency problems. Drivers and passengers have relatively poor safety awareness in terms of safety risks and are not familiar with emergency procedures.
4.2. The quality of rail car equipment maintenance needs to be strengthened
First, the drivers and passengers of heavy-duty rail cars are not very aware of rail car maintenance. The daily maintenance of rail car couplers, drive shafts, brake cylinder pistons and other connecting parts is not in place, resulting in problems such as long-term non-drainage of the total air cylinder. The second is the lack of maintenance personnel. At present, there are only 2 people in the railcar maintenance team in the Baise Public Works Section, and one of them is a young worker who has been in the field for less than 3 years. The professional level is not high, and it is difficult to ensure the maintenance quality of heavy railcars. At the same time, due to the wide distribution of rail car parking points, after the equipment fails, the maintenance personnel cannot carry out the maintenance immediately, resulting in the heavy rail car waiting to be repaired for a long time, or even leaving the car with disease, which seriously affects the equipment quality and operation safety of the heavy rail car [21]. The third is that daily maintenance is a mere formality. Due to the heavy production tasks and difficult operation points of heavy-duty railcars, the heavy-duty railcars have to leave soon after they are parked and parked. Drivers and passengers often cope with maintenance and inspections on the grounds that there is not enough rest time to rush production tasks.
4.3. The professional management level of rail cars needs to be improved
Firstly, the effect of education and training is poor. After obtaining the theoretical certificate, most of the new recruits can only learn to operate the railcar by watching, and the practical experience is very lacking [22]. Workshop and related department managers did not participate in professional training, which is not conducive to professional management. The vocational education department did not establish a corresponding examination and analysis system, and did not carry out daily training work in combination with the actual situation on the spot, resulting in the lack of standardized guidance for the flight class by the section and workshop managers. Secondly, the professional management is not in place. The management department does not carefully judge the safety risks of rail cars, resulting in inadequate safety management and control, and poor on-site card control. The video analysis plan only conducts retrieval and analysis according to quantitative requirements. The coverage of retrieval and analysis is low, and it cannot play the due role of video surveillance. The rectification of the problems found in the inspection of the cadres was not reviewed in time, and the problems could not be managed in a closed-loop; the daily inspection of the management cadres was a mere formality, and the rules and regulations formulated were out of line with the actual production on site, which was not conducive to the operation of the flight shift, and directly affected the safety production of the flight shift. Thirdly, the production and transportation organization ability of heavy-duty rail cars is poor, the operation efficiency is low, and the operation points are difficult to coordinate. When the intermediate station is shunted, the station requires the co-driver to keep an eye on the duty room, to intervene at will to direct the production and transportation of railcars and other issues.
5. Conclusions
In this paper, the numerical simulation of heavy rail transit vehicle crash and the characteristics of impact force are studied, and the analysis results of the characteristics of impact force in the test are obtained, which can provide reference for the research of heavy rail transit vehicle crash. For example, at 105 km/h, the peak value of impact force is the largest and the duration is the shortest; The peak size of pier shaft collision force of concrete A1, A2, A3, A4 is A1 < A2 < A3 < A4; For piers of 5 m, 7 m and 9 m, the peak impact force of 55 mm stirrup spacing is greater than that of 255 mm stirrup spacing; The collision force curves of different masses are roughly the same, and there is overlap at the initial stage. There will be a large wave crest fluctuation at about 0.45s, and the collision force will decrease sharply with time. Finally, the paper puts forward the following suggestions on the safety of heavy rail transit to improve the safety of heavy rail transit.
1) Optimize the self-inspection and self-repair ability of employees. Train the maintenance personnel engaged in the maintenance of heavy rail vehicles, and continuously improve the intensity of daily maintenance, so as to continuously optimize the business capabilities of the maintenance personnel.
2) Improve professional maintenance capabilities. Relevant departments should build a heavy-duty rail vehicle maintenance unit, which can allow maintenance personnel to go to professional manufacturers for training, thereby greatly improving the practical ability of drivers and passengers.
3) Form a ground handling team. It is mainly responsible for the maintenance of rail cars, which can provide enough rest time for drivers and passengers. Fourth, carry out car-following learning. For new students, they can follow the study for half a year, so that they can fully understand the operation process of each model and the corresponding maintenance process, so as to master the skills of handling equipment emergencies.
References
-
J. Mao, Z. Yu, and L. Jiang, “Stochastic Analysis of vehicle-bridge coupled interaction and uncertainty bounds of random responses in heavy haul railways,” International Journal of Structural Stability and Dynamics, Vol. 19, No. 12, p. 1950144, Dec. 2019, https://doi.org/10.1142/s021945541950144x
-
P. Ganesan and B. Ramsagar, “Finite-element simulation of vehicle impact on a column in a reinforced concrete-framed structure,” Asian Journal of Civil Engineering, Vol. 22, No. 3, pp. 579–588, Apr. 2021, https://doi.org/10.1007/s42107-020-00333-0
-
A. Sadeghi, H. Kazemi, and M. Samadi, “Single and multi-objective optimization of steel moment-resisting frame buildings under vehicle impact using evolutionary algorithms,” Journal of Building Pathology and Rehabilitation, Vol. 6, No. 1, pp. 1–13, Dec. 2021, https://doi.org/10.1007/s41024-021-00117-2
-
Y. He, Y. Jiang, and X. Zhou, “Research on vehicle impact performance of tridimensional parking structure based on multi-scale model,” Hunan Daxue Xuebao/Journal of Hunan University Natural Sciences, Vol. 46, No. 1, pp. 1–8, 2019, https://doi.org/10.16339/j.cnki.hdxbzkb.2019.01.001
-
T. V. Do, T. M. Pham, and H. Hao, “Impact force profile and failure classification of reinforced concrete bridge columns against vehicle impact,” Engineering Structures, Vol. 183, pp. 443–458, Mar. 2019, https://doi.org/10.1016/j.engstruct.2019.01.040
-
S. Turner, E. Cook, and S. Bosher, “Level crossing safety impact assessments for vehicle and pedestrian crossings,” Transportation Research Record: Journal of the Transportation Research Board, Vol. 2675, No. 9, pp. 1482–1492, Sep. 2021, https://doi.org/10.1177/03611981211007857
-
M. Kostrzewski and R. Melnik, “Condition monitoring of rail transport systems: a bibliometric performance analysis and systematic literature review,” Sensors, Vol. 21, No. 14, p. 4710, Jul. 2021, https://doi.org/10.3390/s21144710
-
Q. N. Du, “Research on the crashworthiness of new unmanned metro trains,” Urban Mass Transit, Vol. 23, No. 2, pp. 88–91, 2020, https://doi.org/10.16037/j.1007-869x.2020.02.020
-
Y. Feng, S. N. Xiao, Q. W. Che, and D. Li., “Axial crashworthiness of thin-walled tapered circular tube used on urban rail transit vehicle,” Urban Mass Transit, Vol. 22, No. 5, pp. 100–105, 2019, https://doi.org/10.16037/j.1007-869x.2019.05.022
-
B.-G. Seo and H.-Y. Jeong, “Three-dimensional numerical model of free motion headform used in impact tests on vehicle interior,” International Journal of Automotive Technology, Vol. 21, No. 5, pp. 1169–1176, Oct. 2020, https://doi.org/10.1007/s12239-020-0110-z
-
Török Árpád, “A novel approach in evaluating the impact of vehicle age on road safety,” Promet-Traffic and Transportation, Vol. 32, No. 6, pp. 789–796, Nov. 2020, https://doi.org/10.7307/ptt.v32i6.3441
-
T. Watanabe, I. Kuroda, T. Nakajima, and M. Masuda, “Relationship between frontal car-to-car test result and vehicle crash compatibility evaluation in mobile progressive deformable barrier test,” Traffic Injury Prevention, Vol. 20, No. sup1, pp. S78–S83, Jun. 2019, https://doi.org/10.1080/15389588.2019.1597348
-
T. P. Hutchinson, “Full frontal car crash tests: empirical evidence about shape of deceleration pulses,” International Journal of Automotive Technology, Vol. 22, No. 2, pp. 383–389, Apr. 2021, https://doi.org/10.1007/s12239-021-0036-0
-
J. Yoo and H. Huh, “Optimization of three-wheel vehicle roof structures against rollover accidents,” International Journal of Automotive Technology, Vol. 21, No. 4, pp. 795–804, Aug. 2020, https://doi.org/10.1007/s12239-020-0077-9
-
S. Sheikholeslami, A. M. Boroujerdian, and M. Asadamraji, “A rural road accident probability model based on single-vehicle hazard properties including hazard color and mobility: A driving simulator study,” Journal of Advanced Transportation, Vol. 2020, No. 13, pp. 1–8, Nov. 2020, https://doi.org/10.1155/2020/8826374
-
A. Wysokowski, “Impact of traffic load randomness on fatigue of steel bridges,” The Baltic Journal of Road and Bridge Engineering, Vol. 15, No. 5, pp. 21–44, Dec. 2020, https://doi.org/10.7250/bjrbe.2020-15.505
-
C. Kim et al., “Statistical analysis of the impact of vehicle running-in distance on mechanical resistance,” International Journal of Automotive Technology, Vol. 21, No. 1, pp. 123–135, Feb. 2020, https://doi.org/10.1007/s12239-020-0013-z
-
J. Gao and F. Wu, “Analysis and optimization of the vehicle handling stability with considering suspension kinematics and compliance characteristics,” Advances in Mechanical Engineering, Vol. 13, No. 5, pp. 629–638, 2021.
-
A. Rahman and D. P. Babu, “Simulation of car frontal fascia during crash using LS-DYNA,” International Journal of Engineering and Technical Research, Vol. 8, No. 7, pp. 616–622, 2019, https://doi.org/10.17577/ijertv8is070261
-
R. Kostek and P. Aleksandrowicz, “Identification of the parameters of a vehicle crashing into a round pillar,” Journal of Theoretical and Applied Mechanics, Vol. 58, No. 1, pp. 233–245, Jan. 2020, https://doi.org/10.15632/jtam-pl/115550
-
S. Lu et al., “Energy absorption design for crash energy management passenger trains based on scaled model,” Structural and Multidisciplinary Optimization, Vol. 65, No. 1, pp. 1–17, Jan. 2022, https://doi.org/10.1007/s00158-021-03116-6
-
Y. Shi and X. Y. Gang, “Anti-rear-end collision simulation of light-weight vehicle body based on finite element method,” Computer Simulation, Vol. 36, No. 11, pp. 110–113, 2019, https://doi.org/10.3969/j.issn.1006-9348.2019.11.026
About this article

The research is supported by: Natural Science Research Project of Jiangsu Province-Design and DYNA Simulation of CEM-based Universal Collision Protector for Rail Trains (No. 20KJB580007); Natural Science Research Project of Jiangsu Province-Design and Simulation of Rail Vehicle Metal Rubber Shock Absorber Based on ABAQUS (No. 19KJB580014); Excellent young backbone teacher training project of the Qinglan Project in Jiangsu Province (No. 500RCQL20103).
The datasets generated during and/or analyzed during the current study are available from the corresponding author on reasonable request.
The authors declare that they have no conflict of interest.
