Abstract
The contradiction between ships and bridges is becoming increasingly prominent, and ship-bridge collision accidents occur frequently. However, the existing researches focus on the impact force, the bridge will be simplified to a single pier, but the single pier collision model cannot accurately reflect the dynamic behaviors and damage evolution process of collision. In order to solve this problem, a refined barge-whole bridge collision finite element model is established. This model can be used to analyze the dynamic characteristics of barge and whole bridge collision. According to finite element results, the impact force can be divided into four phases: (1) Linear elastic phase, (2) Buckling unstable phase, (3) Plastic deformation phase and (4) Unloading phase. The impact velocity and barge mass change the initial kinetic energy of the barge, which is positively correlated with the peak impact force and the duration of the impact force. Compared with the barge-single pier collision model, the barge-whole bridge collision model is more systematic and comprehensive in reflecting the dynamic behavior of collision. In this paper, the research of barge-bridge collision provides a scientific basic theoretical basis for the design of anti-collision facilities, the proposal of post-collision damage assessment techniques and the development of bridge post-collision warning system.
Highlights
- A refined barge-whole bridge collision finite element model is established. This model can be used to analyze the dynamic characteristics of barge and whole bridge collision.
- The impact force can be divided into four phases: (1) Linear elastic phase, (2) Buckling unstable phase, (3) Plastic deformation phase and (4) Unloading phase.
- The impact velocity and barge mass change the initial kinetic energy of the barge, which is positively correlated with the peak impact force and the duration of the impact force.
1. Introduction
Bridge structures that cross water routes are frequently affected by ships. Ship collision causes bridge damage, casualties and huge social influence. In recent years, with the increase of the number of navigable inland-river bridges, the tonnage and speed of ship have been advancing. The contradiction between bridges and ships has become increasingly prominent, and there is high risk for ships to affect bridges. Ship collision has become a significant factor that threatens the safety of cross-channel bridges. Therefore, it is important to analyze the dynamic response of bridges under different ship impact conditions to ensure their healthy and safe operations.
With the continuous improvement of non-linear finite element simulation technology, the problems related to the structure dynamic response of ship-bridge collision can be effectively solved by numerical simulation [1]. Liu and Gu [2] carried out a numerically ship-bridge collision analysis of a whole ship and bridge based on the finite element model. The simulation results showed the evolution of the collision force and the internal stress of the pier. Sha and Hao [3, 4] established an elaborate ship-pier collision model, and studied the effects of concrete material, ship load and impact velocity on collision behavior response. Kantrales and Consolazio [5] utilized the ship-bridge collision numerical model and the scale experimental model to study the dynamic response of the barge impacting pier. Guo [6] et al. established a ship-bridge collision numerical model, and considered the influence of the additional mass method and the fluid-solid coupling method on the ship-bridge collision dynamic response results. Wang and Morgenthal [7] connected the simplified mass spring model with the concrete pier, and discussed the dynamic response of the concrete pier under barge impact load.
The existing researches on ship-bridge collision mostly focus on the impact force. In order to simplify the calculation, the finite element model is mainly ship-single pier model. However, the collision analysis results of the single pier model are different from those of the whole bridge model, and the whole bridge model is closer to the actual project. In this paper, a refined barge-whole bridge non-linear finite element model is established to simulate the process of barge impacting bridge. The effects of impact velocity and barge mass on the dynamic response of ship-bridge collision are discussed and analyzed. The mechanism of ship- bridge collision is revealed, which provides a reference for the numerical calculation of ship-bridge collision.
2. Barge-whole bridge collision finite element model
2.1. Barge and whole bridge model
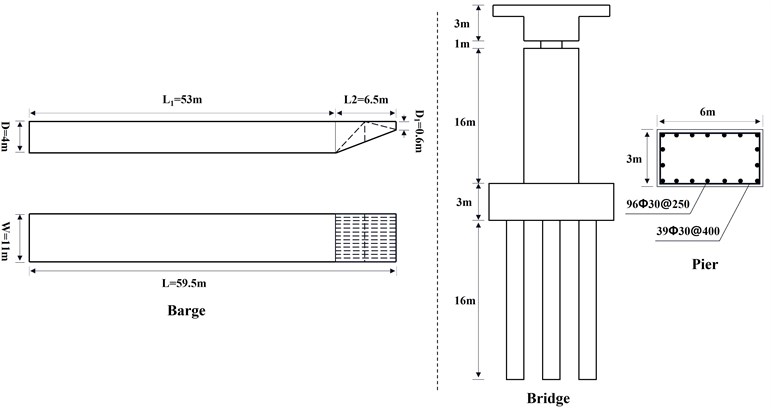
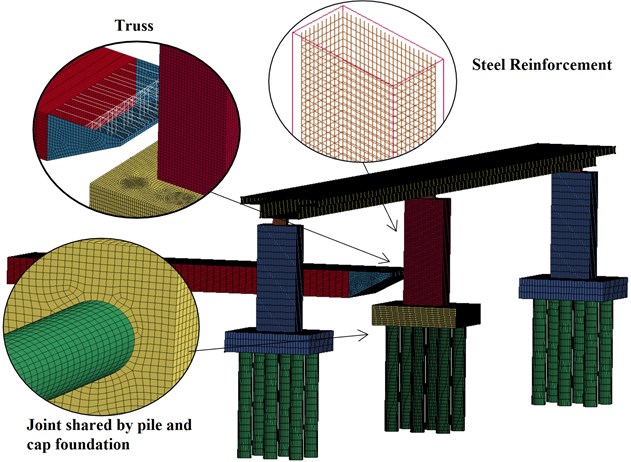
The total span of the whole bridge model used in this paper is 120 m. The bridge model consists of bridge deck, laminated rubber bearing (2 m×1 m×1 m), reinforced concrete pier (6 m×3 m×16 m), pile cap (13 m×10 m×3 m) and pile foundation (2 m in diameter and 16 m in length), as shown in Figs. 1-2. The pier contains steel reinforcement, and the steel reinforcement is modeled by separate method [8], without considering the bond and slip between steel reinforcement and concrete.
The ship type is flat bow barge. The barge model is established according to the size and structure of JH type barge in AASHTO specification [9]-[10]. For the convenience of calculation, the complex internal structure of the bow is simplified to multi-layer trusses. The specific dimensions are shown in Fig. 1.
Fig. 1Dimension diagram of barge and whole bridge
For the barge structure, SHELL163 and BEAM161 elements are adopted respectively to simulate the outer plate of the bow and the bow internal trusses, and the barge body adopts SOLID164 element. The bridge deck adopts SHELL163 element, and the steel reinforcement adopts BEAM161 element, while the rest of the bridge adopts SOLID164 element. In order to improve the calculation accuracy, the mesh of the bow structure and the pier involved in the collision is refined; the size is set to 200 mm. Therefore, the barge-whole bridge finite element model is divided into 247419 elements, including 42107 elements for the barge and 205312 elements for the whole bridge. The finite element model of barge impacting the whole bridge is shown in Fig. 2.
Fig. 2The barge-whole bridge finite element model
2.2. Material model and contact
The barge body hardly gets involved in collision. So, it is set as a rigid body and the material model is *MAT_RAGID. The material of barge bow and steel reinforcement adopt the Plastic Kinematic Model. Its parameters are density 7.89×10⁻⁶ kg/(mm)3, elastic modulus 207 GPa, Poisson’s ratio 0.28, yield strength = 235 MPa, failure strain = 0.35, 20 and 5, respectively. Linear elastic material *MAT_ELASTIC is selected for structures which are not directly involved in collision, such as bridge deck, side pier, laminated rubber bearing, pile foundation. The pier material model involved in ship-bridge collision adopts the HJC concrete constitutive model. The relevant material parameters of the model are shown in Table 1.
Table 1Concrete material model
*MAT_JOHNSON_HOLMQUIST_CONCRETE | ||||||
(kg/mm3) | (GPa) | A | B | C | N | (GPa) |
2.5×10⁻⁶ | 14.51 | 0.79 | 1.6 | 0.007 | 0.61 | 0.04 |
T (GPa) | (ms-1) | EFMIN | SFMAX | Pc (GPa) | (GPa) | |
0.004 | 0.001 | 0.01 | 7 | 0.014 | 7.2×10⁻⁴ | 0.8 |
(GPa) | (GPa) | (GPa) | ||||
0.1 | 0.038 | 1 | 85 | –171 | 208 | 0 |
To simulate concrete damage in actual collision, this paper adds concrete failure criterion based on the HJC concrete constitutive model [11]-[12]. The maximum pressure of 35 MPa as well as the maximum principal strain of 0.02 is set as the failure criterion of concrete for joint judgment to obtain better damage effects. There is no solid physical foundation for the setting of failure criteria, but better impact dynamic response results can be obtained.
It is very important to define the ship-pier contact correctly for collision numerical simulation [13]. In the meshing phase of the bridge, the common nodes are used to connect the pile foundation with the pile cap, pile cap with the pier column, and pier column with the laminated rubber bearing. This method reduces the contact setting. Consequently, two contact types are set up in this paper. The keyword of the contact type between bow and pier in LSDYNA is *CONTACT_AUTOMATIC_SURFACE_TO_SURFACE. And the bow is defined as Contact Surface, while the pier is defined as Target Surface. The contact type between the bow internal trusses and outer plate in LSDYNA is *CONTACT_AUTOMATIC_SINGLE_SURFACE. The coefficients of kinetic and static friction for both contact types are set to 0.3.
3. Dynamic response and structural damage analysis
Using the finite element software LSDYNA, the dynamic response and damage deformation of the ship-bridge collision are analyzed when a 6000DWT barge impacts the whole bridge at the speed of 2 m/s under full load.
3.1. Analysis of system energy and impact force
As shown in Fig. 3 and Fig. 4, the barge-bridge collision process is energy conservation. The collision between the barge and the whole bridge occurred in 0.25s. At this moment, the kinetic energy of the barge quickly began to be converted into the internal energy of the system until the barge and the bridge were separated. In the process of numerical simulation of collision, the hourglass energy should be less than 5 % of the total energy, otherwise the numerical results are invalid [14]. In this paper, the maximum hourglass energy is 3.549×10⁵ J, accounting for only 2.8 % of the initial kinetic energy, and the maximum sliding energy and damping energy are 1.618×10⁵ J and 3.190×10⁵ J respectively, accounting for 1.3 % and 2.5 % of the initial kinetic energy, which proves the effectiveness of the numerical simulation results.
Fig. 3Time-history curve of system energy
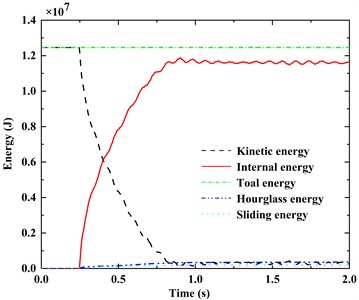
Fig. 4Percentage of kinetic energy
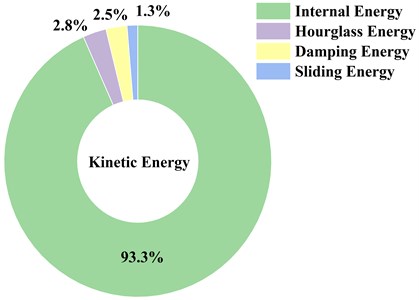
Fig. 5Time-history curve of impact force
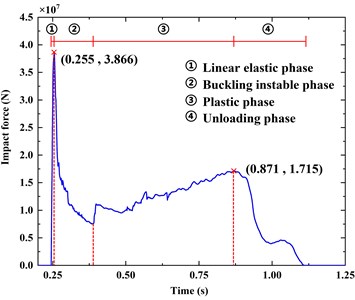
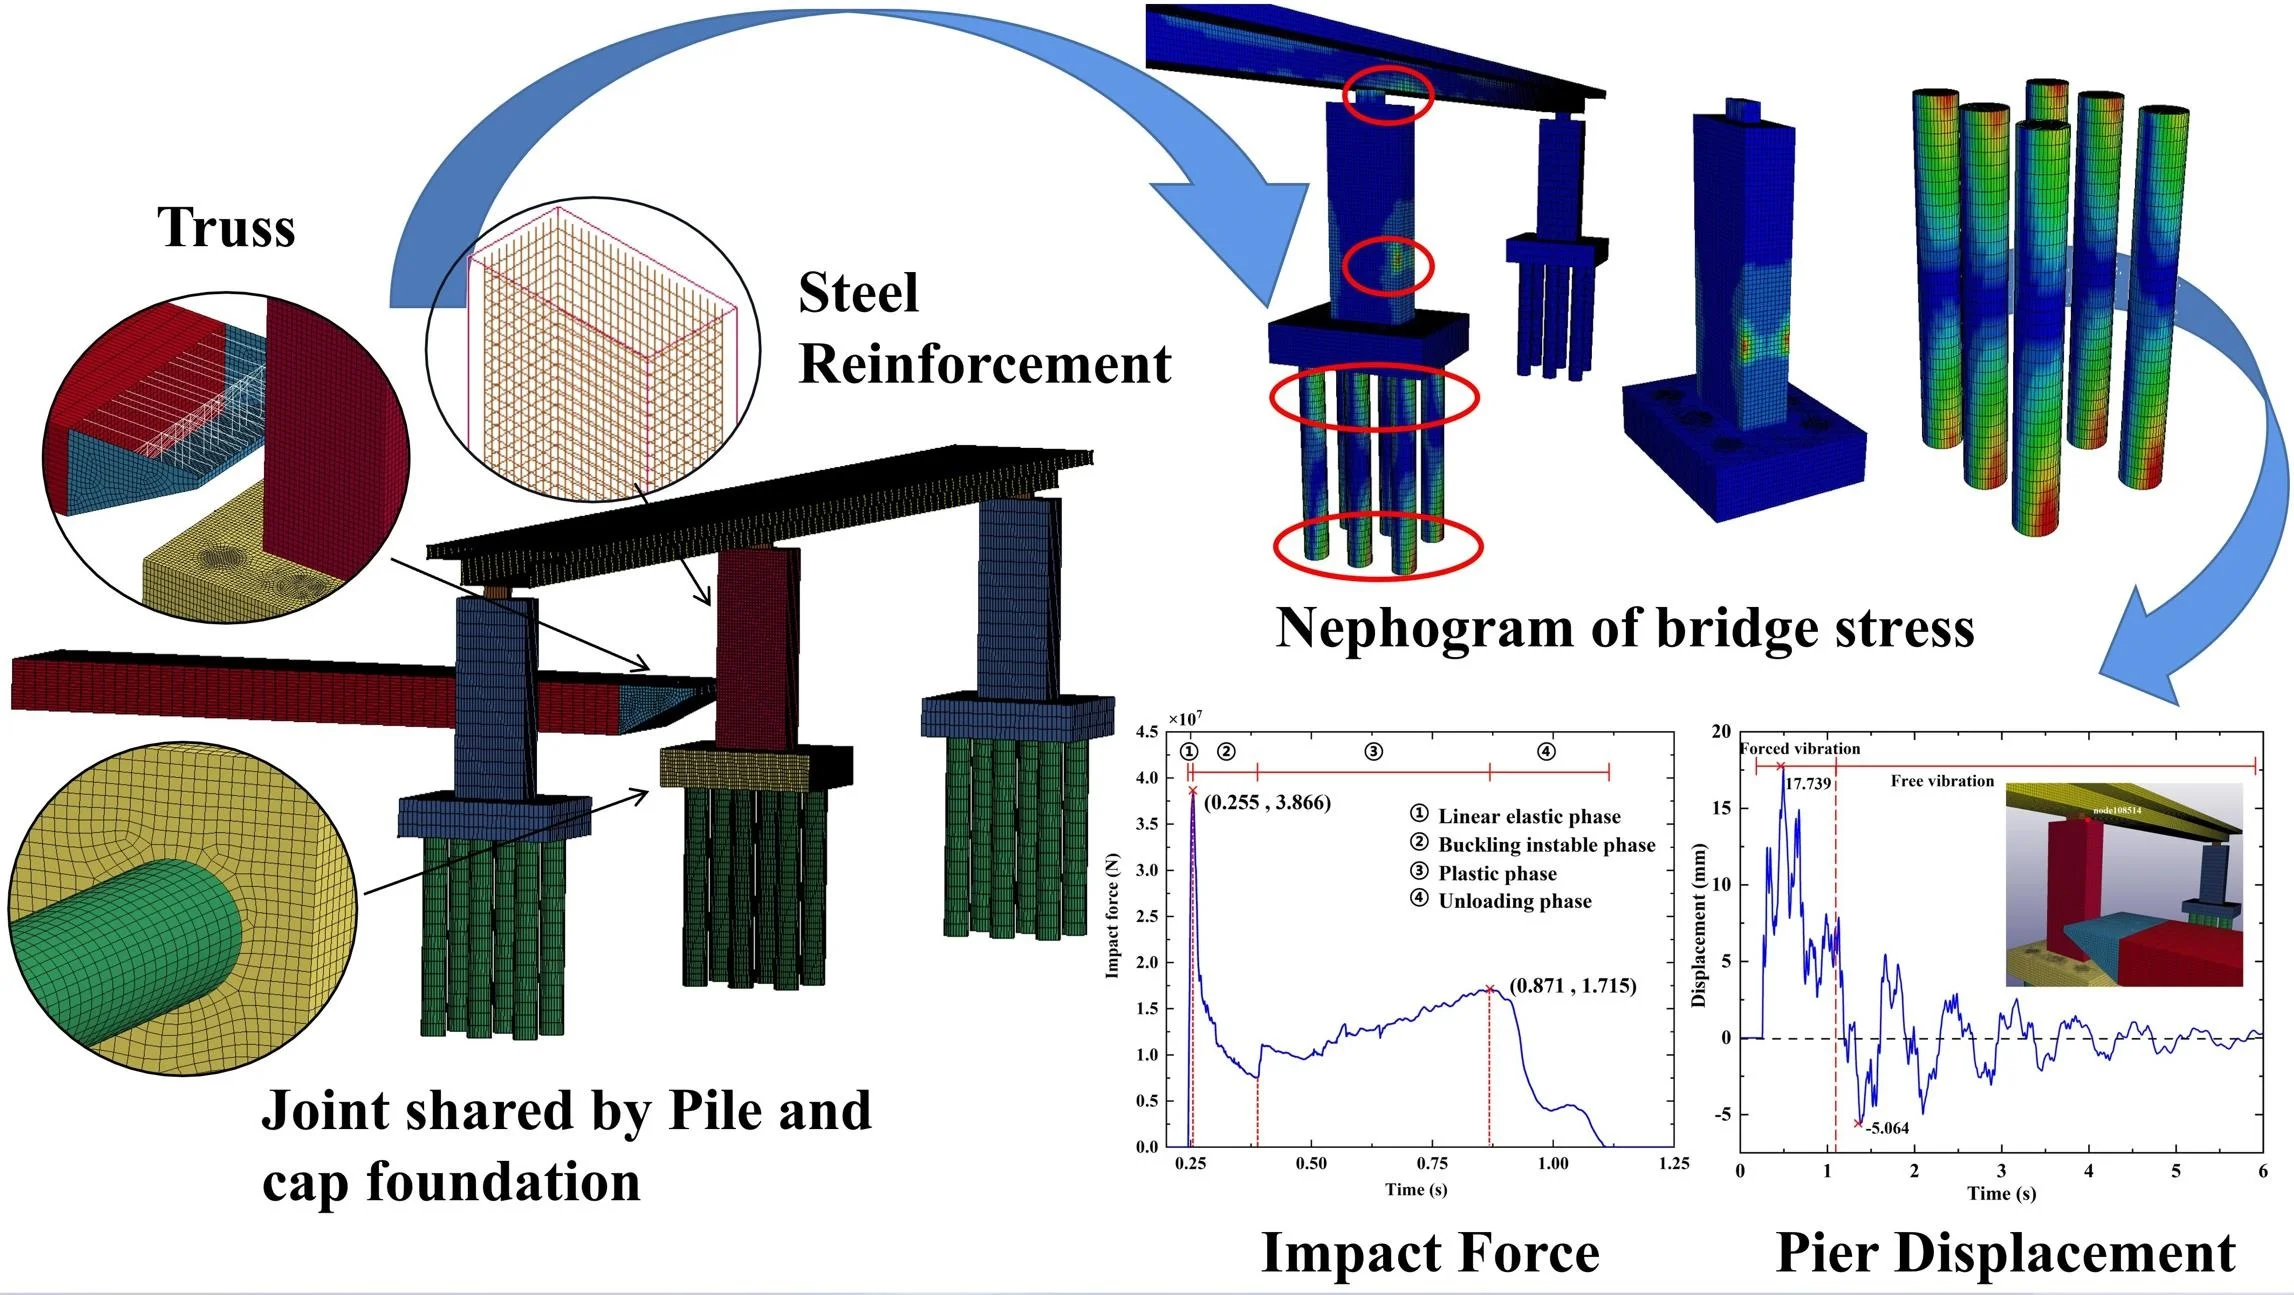
As shown in Fig. 5, the trend of impact force curve corresponds to the four phases of barge bow in the collision process, which are: (1) Linear elastic phase, where impact force reaches the maximum value of 38.659 MN; (2) Buckling unstable phase, where impact force drops rapidly; (3) Plastic deformation phase, where impact force increases non-linearly; (4) Unloading phase, where impact force drops to 0 at 1.105 s.
It is worth noting that during the plastic phase, the impact force is not a simple monotonic increase and decrease process, but shows the characteristics of alternation and fluctuation. This is because the shell elements of the barge bow involved in the collision yield during the collision, resulting in the temporary separation of the bow and the pier. Then, as the barge continues to move forward, the shell elements contact the pier again, and this process reciprocates alternately.
3.2. Dynamic behavior analysis of Bridges
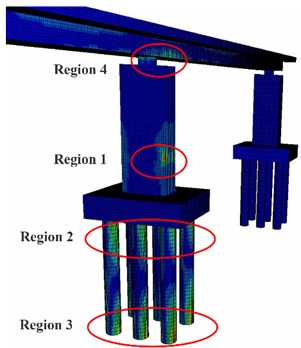
The stress nephogram of the bridge is shown in Fig. 6. Stress concentration occurred in the area where the pier was impacted (region 1), the connection between the pile foundation and the pile cap (region 2), the restraint of the pile foundation (region 3) and the contact between the pier and the bridge deck (region 4). The region 4 and the impacted side of region 3 and region 2 are the principal tensile stress, which is easy to produce concrete cracking. Moreover, the region 2 and the opposite side of area 1 are the principal compressive stress, which is easy to produce large plastic deformation. In the process of barge-bridge collision, the damage of pier is mainly concentrated in these four regions, and the protection of these four regions should be emphatically considered in the design of anti-collision facilities.
Fig. 6Nephogram of bridge concrete stress
a) Bridge
b) Pier
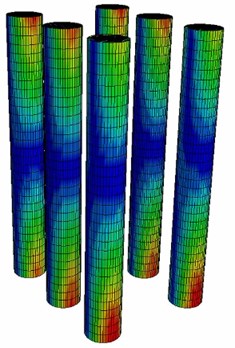
c) Pile foundation
Select the node 108514 at the top of the bridge pier and extract its transverse displacement, as shown in the Fig. 7. The maximum top displacement of the impacted pier is 17.739 mm, but its peak time lags behind the time when the impact force reaches the maximum value. Fig. 7 shows that the displacement of bridge is divided into two phases. The first phase is the forced vibration phase. The barge impacts the bridge at 0.25 s and forces the bridge to move along the forward direction of the barge until the impact force is 0 at 1.105 s, then the collision ends. The second phase is the free vibration phase. Due to inertia, the pier moves towards the forward direction of the barge for a period of time, and then starts to vibrate freely, and the displacement decays with time.
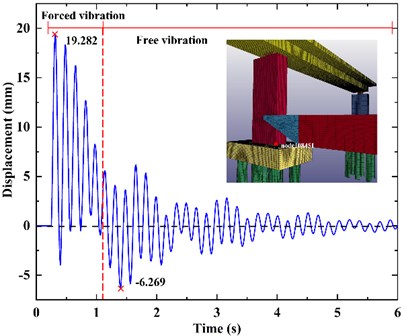
Fig. 8 shows the transverse displacement of the node 108451 at bottom of the bridge pier, with the maximum displacement of 19.282 mm. It can be seen from Fig. 8 and Fig. 8 that the displacement at the top of the pier is rougher than that at the bottom of the pier. This is because the pier is damaged by barge impact, and the pier element becomes a dead element, which affects the displacement of the bridge. The roughness of the displacement curve represents the damage of the pier structure.
Fig. 7The displacement at the top of pier
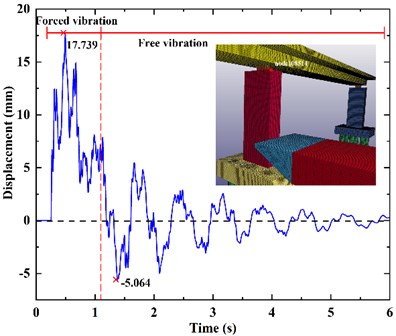
Fig. 8The displacement at the bottom of pier
3.3. Analysis of structural damage
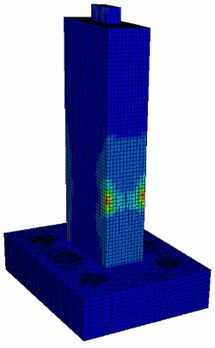
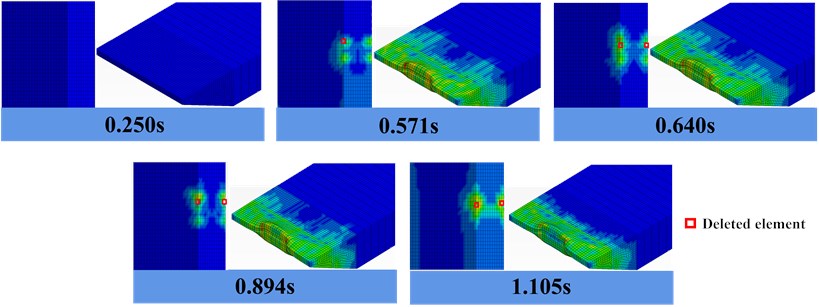
According to the von Mises stress nephogram in Fig. 9, the ship and bridge began to contact in 0.25 s, and a high stress concentration appeared at the edge of the square pier. When the collision time reached 0.571 s, the pier concrete reached the prescribed failure values, and the concrete elements were deleted. As the collision continued, the concrete damage became more and more serious until the end of the collision at 1.105 s. Meanwhile, the barge bow is constantly loaded and unloaded during the collision, resulting in serious plastic deformation. The deformation is mainly concentrated in the contact area between the barge bow and the pier. There is no shell element deletion.
Fig. 9Barge-whole bridge stress nephogram, Left concrete bridge, right barge
4. Analysis of influencing factors on dynamic response of barge-bridge collision
In this paper, the impact velocity and barge mass are selected to set up corresponding working conditions, and the dynamic response results such as peak value of impact force and impact duration are discussed and analyzed.
4.1. Influence of barge impact velocity
To change the barge impact velocity, we set three working conditions as follows: 2 m/s, 3 m/s and 4 m/s. The time history curve of impact force under different barge impact velocities is obtained.
As shown in Fig. 10, with the increase of impact velocity, the peak impact force increases, the duration of the ship-bridge collision also increases and the curve presents more significant non-linear characteristics. The non-linearity of the curve indicates the damage and failure of the structure.
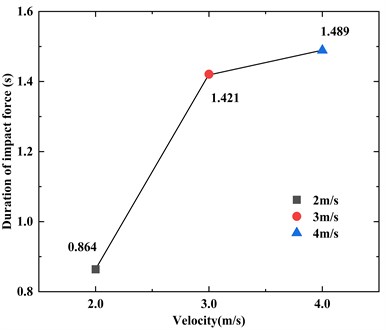
In Fig. 11 and Fig. 12, There is a clear linear relationship between the peak impact force and the impact velocity and the duration of impact force is irregular with the increase of the velocity.
Fig. 10Time-history curves of impact force under different impact velocities
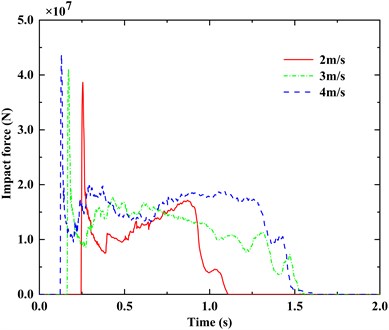
Fig. 11Peak impact force at different impact velocities
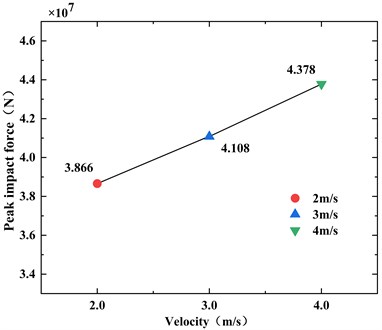
Fig. 12Duration of impact force at different impact velocities
4.2. Influence of barge mass
To change the barge mass, we set three working conditions, namely 1723DWT, 4000DWT and 6000DWT. 1723DWT means the barge is empty and 6000DWT is full.
As shown in Fig. 13 and Fig. 14, The increase of barge mass changes the initial kinetic energy of the barge. The increase of kinetic energy leads to the increase of internal energy converted by collision, which in turn affects the response characteristics such as impact force. With the increase of barge mass, the fluctuation of the time history curve of impact force increases obviously. This indicates that the buckling damage of barge bow is becoming serious.
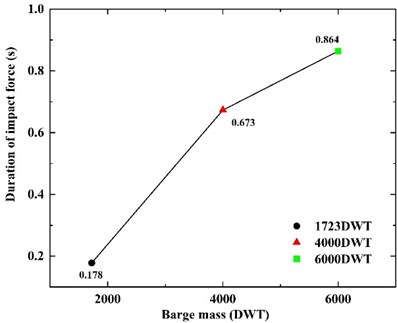
According to Fig. 15 and Fig. 16, there is a linear relationship between the barge mass and the peak impact force, but the values between the peak impact force exist barely variation. The value of 1723DWT is merely 0.524 MN smaller than 6000DWT. However, the duration of impact force changes obviously. The impact duration of 6000DWT barge is about 4.85 times that of 1723DWT. Longer contact time leads to more complex nonlinear response.
Fig. 13Conversion of kinetic energy and internal energy
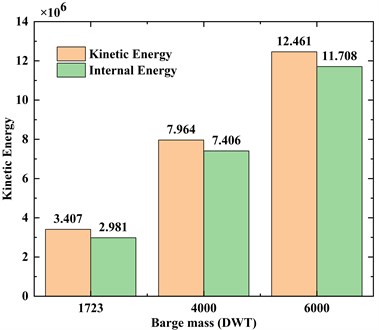
Fig. 14Time-history curve of impact force under different barge mass
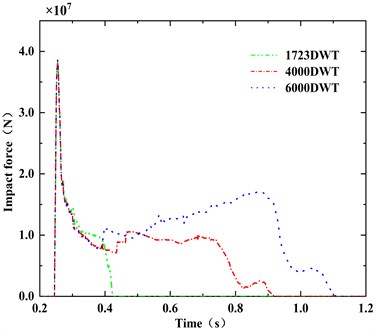
Fig. 15Peak impact force at different barge mass
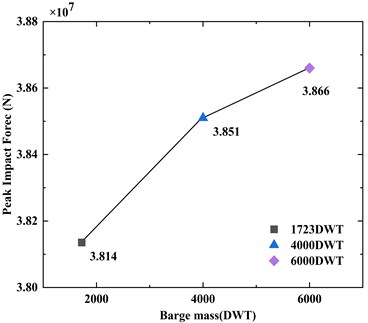
Fig. 16Duration of impact force at different barge mass
5. Conclusions
For the barge impacting the concrete bridge, this paper establishes a refined barge-whole bridge finite element model based on the finite element numerical simulation. Through the detailed analysis of the impact dynamic response, it is concluded that:
1) The termination of collision between barge and whole bridge in this paper is 1.105 s. The peak value of impact force is 38.7 MN and the variation of impact force can be divided into four phases.
2) When the barge impacts the square pier of the bridge, high stress concentration occurs at the contact position between the pier edge and the barge, and the concrete is easy to be damaged. Similarly, the barge bow has large buckling damage in the corresponding collision region.
3) The peak value and duration of impact force are positively correlated with the impact velocity and barge mass. The larger the impact velocity and barge mass are, the more significant is the non-linear characteristic of time-history curve of impact force.
4) There are four areas where high stress concentration occurs, namely, the impacted position of bridge, the connection position between pier foundation and pier cap, the constraint position of pier foundation, and the contact position between pier and bridge deck. These regions should be considered emphatically in the design of anti-collision facilities.
For future research, the impact angle, impact location, superstructure and other working conditions should be comprehensively considered for the influencing factors of bridge impact dynamic response. Meantime, the damage diagnosis of bridges after ship impact should also be considered.
References
-
W. Fan, Y. Sun, C. Yang, W. Sun, and Y. He, “Assessing the response and fragility of concrete bridges under multi-hazard effect of vessel impact and corrosion,” Engineering Structures, Vol. 225, No. 15, p. 111279, Dec. 2020, https://doi.org/10.1016/j.engstruct.2020.111279
-
J. C. Liu, Y. N. Gu, and Z. Q. Hu, “Simulation of ship-bridge collision based on FE model of whole ship-bridge,” Journal of Ship Mechanics, Vol. 7, No. 3, pp. 107–117, 2003, https://doi.org/10.3969/j.issn.1007-7294.2003.03.012
-
Y. Sha and H. Hao, “Nonlinear finite element analysis of barge collision with a single bridge pier,” Engineering Structures, Vol. 41, No. 3, pp. 63–76, Aug. 2012, https://doi.org/10.1016/j.engstruct.2012.03.026
-
Y. Sha and H. Hao, “Laboratory tests and numerical simulations of barge impact on circular reinforced concrete piers,” Engineering Structures, Vol. 46, pp. 593–605, Jan. 2013, https://doi.org/10.1016/j.engstruct.2012.09.002
-
G. C. Kantrales, G. R. Consolazio, D. Wagner, and S. Fallaha, “Experimental and analytical study of high-level barge deformation for barge-bridge collision design,” Journal of Bridge Engineering, Vol. 21, No. 2, p. 04015039, Feb. 2016, https://doi.org/10.1061/(asce)be.1943-5592.0000801
-
J. Guo, Y. F. Zheng, and S. Y. Song, “Fluid-structure coupling during ship-bridge collision process considering sea level variations,” (in Chinese), Bridge Construction, Vol. 49, No. 6, pp. 24–29, 2019.
-
W. Wang and G. Morgenthal, “Dynamic analyses of square RC pier column subjected to barge impact using efficient models,” Engineering Structures, Vol. 151, No. 15, pp. 20–32, Nov. 2017, https://doi.org/10.1016/j.engstruct.2017.08.003
-
X. Guo, C. Zhang, and Z. Chen, “Dynamic performance and damage evaluation of a scoured double-pylon cable-stayed bridge under ship impact,” Engineering Structures, Vol. 216, No. 1, p. 110772, Aug. 2020, https://doi.org/10.1016/j.engstruct.2020.110772
-
M. W. Whitney and I. E. Hank, “Dynamic design of bridges susceptible to barge impact,” WIT Transactions on The Built Environment, Vol. 25, pp. 161–170, Jan. 1970, https://doi.org/10.2495/susi960151
-
“AASHTO GVCB-2009, Guide Specifications and Commentary for Vessel Collision Design of Highway Bridges,” Highway Transportation Offical, America, 2009.
-
Y. Wan, L. Zhu, H. Fang, W. Liu, and Y. Mao, “Experimental testing and numerical simulations of ship impact on axially loaded reinforced concrete piers,” International Journal of Impact Engineering, Vol. 125, pp. 246–262, Mar. 2019, https://doi.org/10.1016/j.ijimpeng.2018.11.016
-
Q. Luo, R. Liu, W. Fan, Y. Jiang, and Z. W. Zhang, “Performance of anti-collision device made from steel and composite material under different types of vessel collisions,” Bridge Construction, Vol. 50, No. 1, pp. 67–73, 2020, https://doi.org/10.3969/j.issn.1003-4722.2020.01.012
-
G. Gholipour, C. Zhang, and A. A. Mousavi, “Analysis of girder bridge pier subjected to barge collision considering the superstructure interactions: the case study of a multiple-pier bridge system,” Structure and Infrastructure Engineering, Vol. 15, No. 3, pp. 392–412, Mar. 2019, https://doi.org/10.1080/15732479.2018.1543710
-
D. R. Cowan, G. R. Consolazio, and M. T. Davidson, “Response-spectrum analysis for barge impacts on bridge structures,” Journal of Bridge Engineering, Vol. 20, No. 12, p. 04015017, Dec. 2015, https://doi.org/10.1061/(asce)be.1943-5592.0000772
About this article

The authors are grateful for the support from the Key R&D Project of Anhui Science and Technology Department (202004b11020026), the Nanjing International Joint Research and Development Program (No. 202112003), the Nantong Science and Technology Opening Cooperation Project (No. BW2021001), and the International Science & Technology Cooperation Project of Jiangsu Province (BZ2022010).
