Abstract
This study develops a simplified model incorporating an over-height vehicle and the height restriction frame (HRF) to explore the failure modes and mechanical properties of the HRF when subjected to an impact from the over-height vehicle. Within the study context, rigorous model tests have been constructed for simulation analysis. The validity of these numerical simulations is confirmed by comparing the test results to the calculated outcomes. The study also analyzes the dynamic response of vehicles varying in speed and weight when impacting the HRF. The findings reveal that most of the beam's displacement can be attributed to the column's overturning, while a lesser portion is due to the plastic deformation of the beam. The column's displacement is primarily caused by its own overturning. Both the beam and the column's base demonstrate evidence of elastoplastic deformation. It is observed that the displacement and stress of crucial nodes rise with the increase in vehicle speed and weight. Vehicle speed emerges as the predominant factor influencing the impact force of the vehicle when compared to the vehicle's weight. Furthermore, the increase in vehicle weight extends the collision time between the vehicle and the HRF, indicating that the weight of the vehicle plays a significant role in the column's overturning. The study findings can potentially serve as both an experimental and theoretical reference for the design and calculation of the HRF.
Highlights
- When the HRF was impacted by the over-height vehicle at varying speeds, the displacement of critical nodes escalated proportionally with the increase in vehicle speed. The vehicle's speed was found to have a greater effect on the impact force than the vehicle's weight.
- Both displacement and stress responses of critical nodes mirrored the effect of vehicle speed across differing vehicle weights. As the vehicle's weight increased, the collision time and the impact force marginally rose.
- The greatest stress was found in the middle of the beam and at the base of the column, and the overall trend was generally consistent, thus validating the feasibility of numerical simulation calculation.
- The elastic-plastic theory should be adopted in the design, and the bottom of the column should be strengthened to control the plastic hinge as far as possible. The HRF’s beam should not be over-designed.
1. Introduction
Height restriction frames (HRFs) are often installed at the entrances and exits of bridges, tunnels, and culverts to minimize the occurrence of accidents caused by over-height vehicle collisions on bridges. These frames not only protect the safety of bridges and other structures, but due to their low stiffness, they also demonstrate large deformation and displacement upon impact. This feature can effectively reduce the harm caused by impact on over-height vehicles. Furthermore, the maintenance cost of HRFs is less than that of the bridge, and they can be repaired or replaced swiftly after being hit. Therefore, from the perspective of economy and efficiency, the installation of HRFs is highly beneficial. However, current specifications do not clearly stipulate the failure form, mechanical properties, and design requirements of HRFs.
In terms of vehicle and structural impact testing, Li [1] proposed an evaluation method for the impact resistance of reinforced concrete (RC) piers, while Lin [2] acquired dynamic response data for trucks and RC piers. Chen [3] revealed that the structural response of RC columns is significantly affected by the impact velocity and mass of impact blocks. In contrast, Wei [4] suggested an ultra-high performance fiber-reinforced concrete column to replace RC columns susceptible to vehicle impact and studied its mechanical properties under such circumstances. Hao [5] conducted an experimental study of RC beams reinforced with hybrid spiral-hooked end steel fibers under impact loads. Sennah [6] performed vehicle crash tests on a new type of RC bridge guardrail. These studies highlight that due to the limitations in the test conditions, vehicle and structural impact tests, particularly those involving vehicles and HRFs, are in their nascent stage.
In examining the dynamic response of a vehicle impacting the upper main beam of a bridge, Oppong [7] assessed the bridge's superstructure performance using numerical finite element simulation and various metrics, such as impact force, internal shear force, and damage mode. In a separate study, Li [8] further compared the simulation of a truck colliding with a bridge to the full-scale drop hammer test of an RC beam. Wu [9] researched the dynamic performance of a precast reinforced concrete beam subjected to impact loads by an unbonded prestressing tendon. Partheepan [10] focused on low-speed impact simulation of prestressed and RC slabs under different end conditions. Regarding the dynamic response of a vehicle impacting the lower piers of a bridge, WooSeok [11] performed a three-dimensional finite element simulation-based nonlinear impact analysis of RC piers under automobile impact loading. Zhao [12] investigated the influence of key variables such as truck type, collision speed, and pier cross-section on truck impact force and pier structural stiffness. Zhou [13] studied the effects of vehicle speed, vehicle weight, concrete strength, and steel strength on the crash resistance and impact force of bridge piers. Chen [14] explored the impact of various factors on the force exerted on a bridge pier during a vehicle impact. Studies conducted by Tin and Do [15]-[16] classified the dynamic response and failure modes of reinforced concrete bridge columns under vehicle collision. Chen [17] simulated the impact of varying vehicle speeds on concrete-filled steel tube columns. In addition, Chen [18] summarized the research findings related to vehicle and pier impacts, analyzing the limitations of such studies. Yue [19] scrutinized the dynamic response of a vehicle impacting a pier. Zhao [20] considered the effects of impact velocity, pier diameter, superstructure boundary conditions, and cargo height on pier failure mode and internal force distribution. Zhang [21] analyzed collisions between over-height vehicles and bridges under different parameters, considering vehicle speed, load mass, over-height, impact angle, and concrete strength. Chung [22] investigated the structural behavior of bridge columns under varying vehicle impact loads. Hyungoo [23] studied the performance of a steel column reinforced with concrete when impacted by a truck. Lastly, Liu [24] conducted a low-speed impact test on the dynamic behavior of a column with built-in cross steel under impact load. It is evident that while the simulation of vehicle and structure impacts has been extensively studied, the simulation of vehicle impacts with the HRF remains relatively unexplored.
Currently, the majority of studies on vehicle-structure collisions rely heavily on various simulation software, with experimental data solely supporting the validity of the results. Full-scale tests, while accurate, are rarely conducted due to high costs and safety concerns. Comparatively, scaled crash tests are more operable, cost-effective, and can provide relatively accurate data. Therefore, using scaled model tests to study the collision of over-height vehicles with HRFs can provide data support for corresponding numerical simulation tests. While research has been conducted on the collision process between vehicles and bridge guardrails or vehicles and piers, there is a significant lack of studies concerning the collision between over-height vehicles and HRFs. This lack of research leads to a deficit in relevant HRF design and calculation specifications. Consequently, there is an urgent need to investigate the collision process between over-height vehicles and HRFs, analyze this process, and propose the failure form of HRFs to provide a theoretical basis for its design.
2. Experimental design and numerical analysis
2.1. Test models parameters
The dimensions, weight, and boundary conditions of the HRF should closely mirror the actual conditions. Given the constraints posed by the testing site and equipment detection capabilities, the HRF model predominantly factors in size and weight similarities and the likeness of vehicle model momentum and energy. Research into similar model testing emphasizes the stress conditions and failure forms of the HRF during the collision process, aiming to establish theoretical and experimental bases for its judicious design and application. Given the excessive thinness of the post-reduction vehicle material, vehicle stiffness remains unaltered, and little change was studied in accordance with the rigid material. The main requirement herein is to ensure that the actual contact area between the carriage and the HRF beam during impact mirrors the corresponding similarity ratio with the test contact area. A similar model test was conducted with a similarity ratio of 1:10. The dimensions after the scale of the HRF were shown in Table 1, the dimensions after the scale of the over-height vehicle were shown in Table 2, and the mechanical properties of the model material Q235 steel were shown in Table 3.
Table 1Model dimensions of the HRF
Beam width (mm) | Column height (mm) | Section size (mm) | Wall thickness (mm) | |
Prototype value | 11000 | 4500 | 300×300 | 20 |
Model value | 1100 | 450 | 30×30 | 2 |
Table 2Model dimensions of over-height vehicle compartments
Length (mm) | Width (mm) | Height (mm) | Wall thickness (mm) | |
Prototype value | 9600 | 2300 | 4700 | 2 |
Model value | 960 | 230 | 470 | 2 |
Table 3Mechanical properties of Q235 steel
Actual thickness (mm) | Modulus of elasticity (MPa) | Poisson ratio | Yield strength (MPa) | Ultimate strength (MPa) |
1.96 | 203.26×10³ | 0.33 | 210.69 | 344.85 |
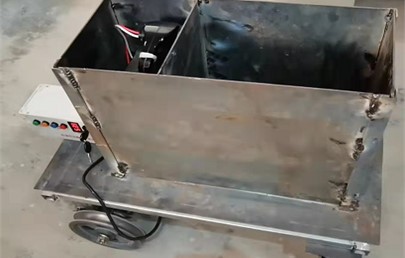
2.2. Experimental design
The track measured 20 m, with the HRF bolted to the ground. The impact occurred at the middle span of the beam, 45 cm above the ground. Vehicle speed was regulated by adjusting the motor’s output power, and vehicle weight was controlled by modifying the counterweight. Strain gauge sensors and acceleration sensors were affixed to the HRF model’s key nodes, while a dynamic displacement meter was placed 50 cm behind the HRF model. The monitoring point arrangement was shown in Fig. 1. The layout of the test site was shown in Fig. 2.
Fig. 1Monitoring point arrangement
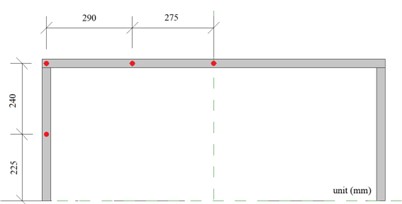
a) Dynamic displacement meter and acceleration sensor
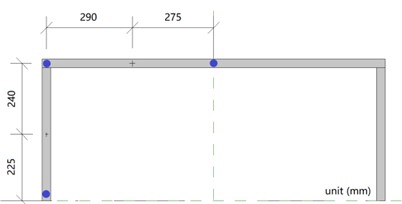
b) Strain gauge sticking
2.3. Numerical modeling of test model
The collision between an over-height vehicle and an HRF represents a nonlinear contact problem. The finite element numerical calculation method for contact collision involves constructing separate finite element models for the two contact objects and resolving the impact load of the contact surface via displacement coordination conditions and momentum equations. The penalty function method calculates display dynamics using Workbench, a user-friendly platform that triggers an hourglass effect.
The size and material parameters of the HRF model were evaluated based on the test parameters of similar models. As the research emphasizes the mechanical properties and damage forms of the HRF during the collision process, aiming to establish theoretical foundations for the HRF's judicious design and application, an in-depth study of the whole vehicle was not pursued. Consequently, certain assumptions were made during the collision simulation process.
Fig. 2Layout of the test site
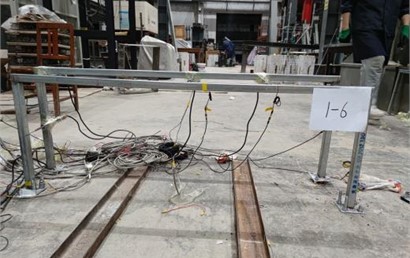
a) The model of HRF and its track
b) The model of over-height vehicle
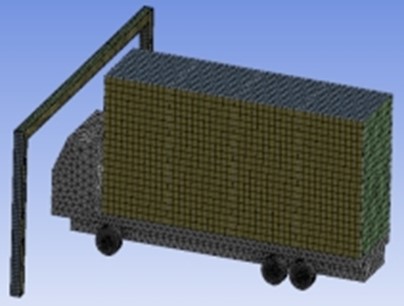
The vehicle model was simplified into three components: the chassis, the skeleton, and the carriage. The chassis uses a solid unit, the skeleton employs a beam unit, and the carriage utilizes a shell unit. Q235 mild steel is the material employed.The connection between the HRF base and the foundation was reinforced, with the interaction between the foundation and the HRF temporarily disregarded.The collision angle between the carriage and the HRF is 90°.
The vehicle's chassis was simulated using a solid 164 unit, and the carriage's skeleton was simulated using a beam 161 unit. The skeleton consists of a hollow steel pipe with a diameter of 40 mm and a thickness of 3 mm. The carriage was simulated by shell163, using a 3 mm thick steel plate. They were primarily interconnected by common nodes, followed by a skeleton and chassis linkage via binding. A beam 161 unit simulated the HRF with the column base affixed. The HRF consists of Q235B metal products, and the bilinear follow-up strengthening model BKIN serves as the material constitutive relation for finite element simulation. The specific parameters of materials were shown in Table 4, and the finite element model of the impact between over-height vehicle and HRF was shown in Fig. 3.
Table 4Material specific parameters
(Pa) | (kg/m3) | (Pa) | (Pa) | ||
HRF | 2.03×10¹¹ | 7.85×10³ | 0.33 | 2.10×10⁸ | 6.1×10⁹ |
Vehicle | 2.06×10¹¹ | 7.85×10³ | 0.3 | 2.35×10⁸ | 6.1×10⁹ |
Fig. 3Model of over-height vehicle impact the HRF
3. Test and numerical simulation results
3.1. Test results
3.1.1. Different vehicle speeds
3.1.1.1. Dynamic displacement response of the HRF
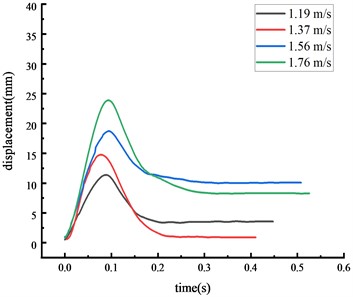
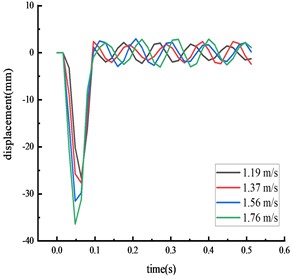
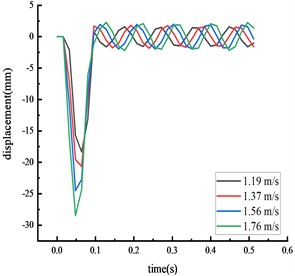
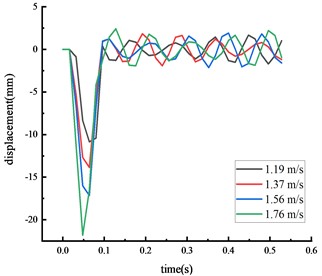
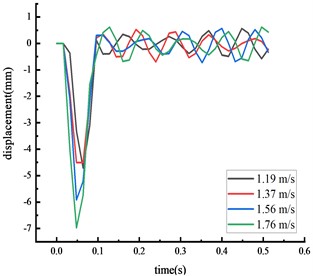
In general, the over-height vehicle model, weighing 77 kg, impacted the middle span of the beam during the experiments at four different speeds. The displacement time history curve at each key node of the HRF was shown in Fig. 4.
Fig. 4Displacement of each key node
a) Middle span of beam
b) Beam 1/4 span
c) Top of column
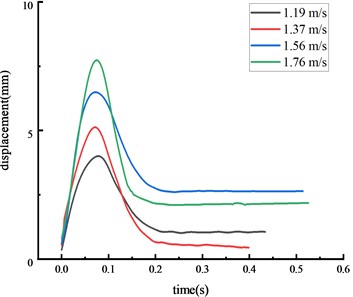
d) Column center
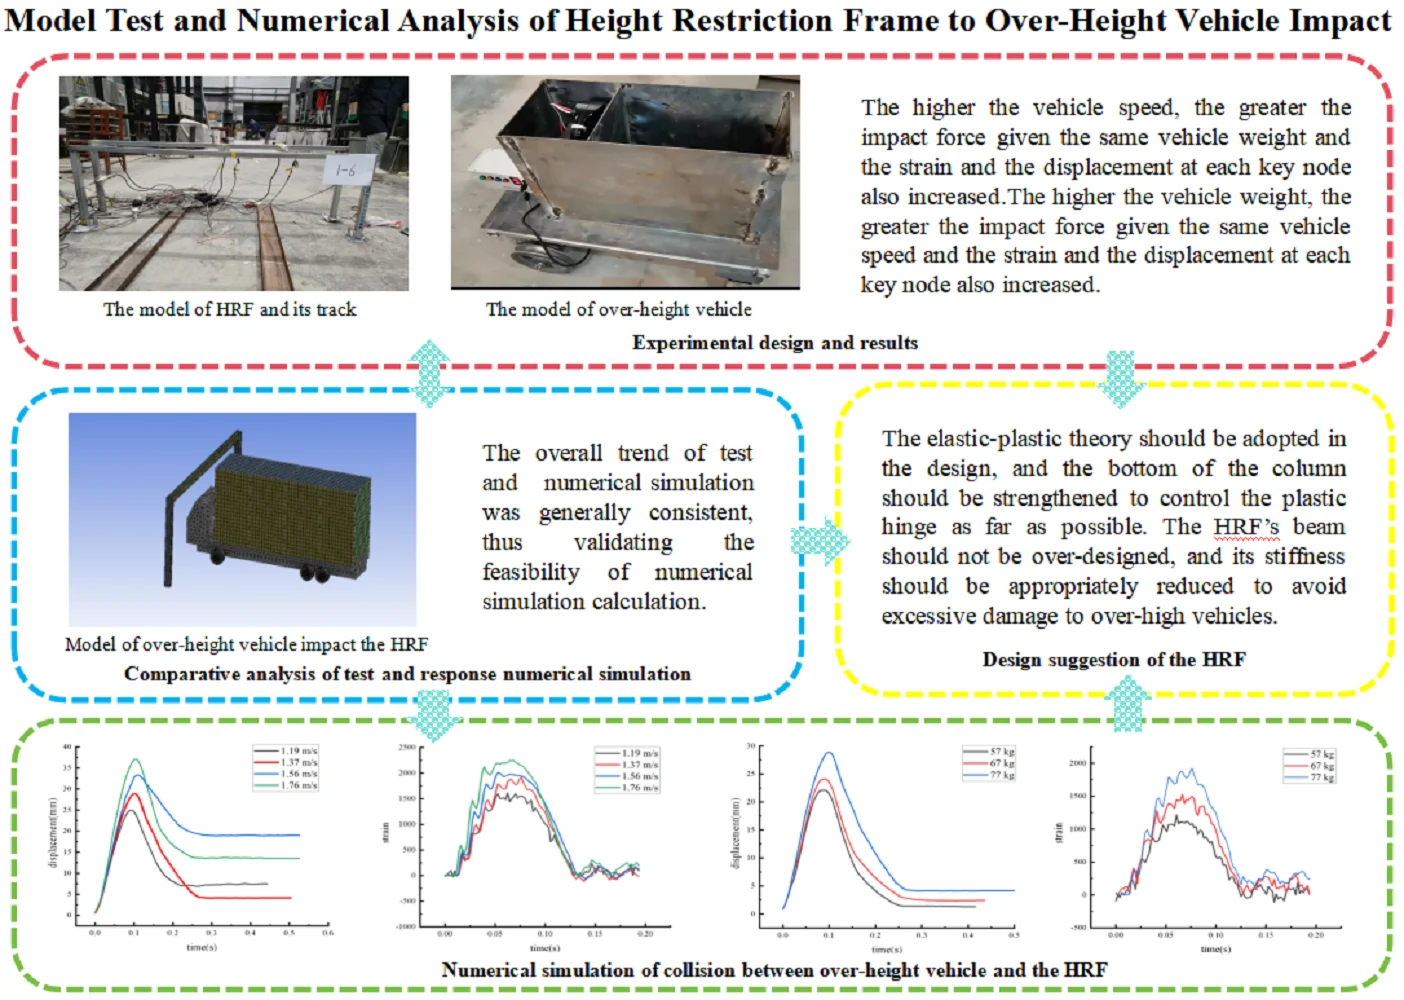
The displacement at each key node was highest at the middle span of the beam, followed by the beam 1/4 span, then the top of the column, then the column center. The higher the vehicle speed, the greater the impact force given the same vehicle weight and the displacement at each key node also increased. The peak displacement was reached approximately 0.07 seconds after the impact.
3.1.1.2. Dynamic strain response of the HRF
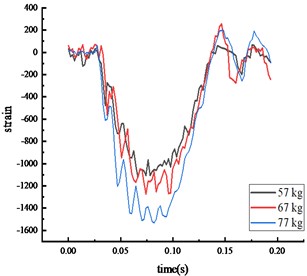
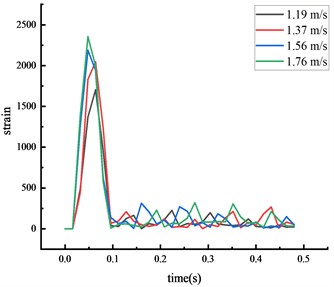
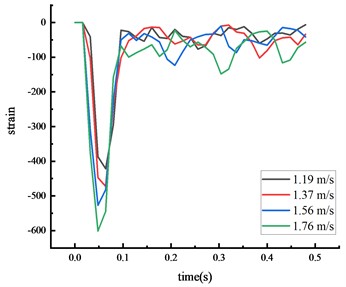
Under the same experimental circumstance, the strain time history curve at each key node of the HRF was shown in Fig. 5.
The strain at each key node was highest at the middle span of the beam, followed by the bottom of the column, then the top of the column. The higher the vehicle speed, the greater the impact force given the same vehicle weight and the strain at each key node also increased. The peak strain was reached approximately 0.06 seconds after the impact. The center of the beam span experienced localized stress, and the strain at this node was higher than at others.
Fig. 5Strain of each key node
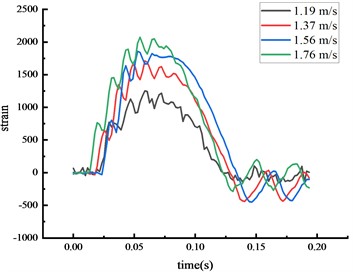
a) Bottom front of column
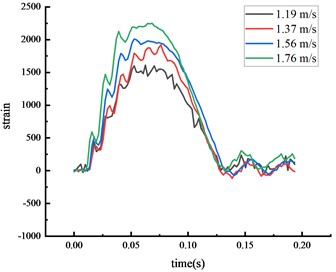
b) Middle span of beam
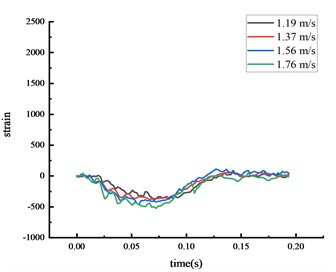
c) Top of column
3.1.2. Different vehicle weights
3.1.2.1. Dynamic displacement response of the HRF
Experiments were also conducted under three different vehicle weights, with the over-height vehicle model hitting the middle span of the beam at a speed of 1.37 m/s. The displacement time history curve at each key node of the HRF was shown in Fig. 6.
The peak displacement response pattern at each key node was consistent: the middle span of the beam, the beam 1/4 span, the top of the column, then the column center. As vehicle weight increased, the impact force and the peak displacement at each key node also increased. The peak displacement was reached approximately 0.07 seconds after impact.
3.1.2.2. Dynamic strain response of the HRF
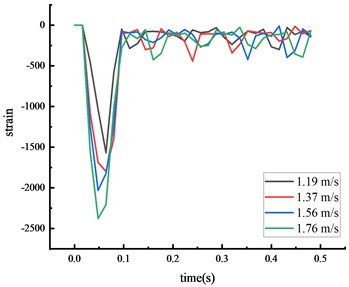
Under the same experimental circumstance, the strain time history curve at each key node of the HRF was shown in Fig. 7.
The peak strain response pattern at each key node was consistent: the middle span of the beam, the bottom of the column, then the top of the column. As vehicle weight increased, the impact force and the peak strain at each key node also increased. The peak strain was reached approximately 0.07 seconds after impact, with the entire process lasting about 0.2 seconds. The peak strain at the beam's middle span and the column's bottom exceeded the steel's yield strength.
Fig. 6Displacement of each key node
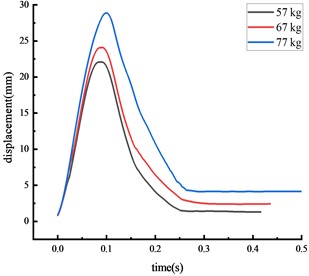
a) Middle span of beam

b) Beam 1/4 span
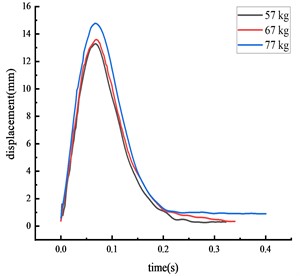
c) Top of column
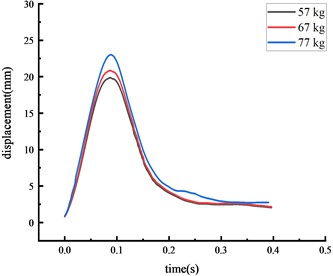
d) Column center
Fig. 7Strain of each key node
a) Bottom of column
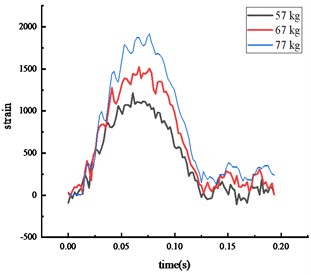
b) Middle span of beam
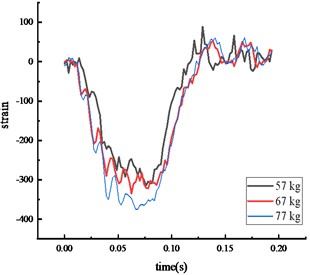
c) Top of column
3.2. Comparative analysis of test and response numerical simulation
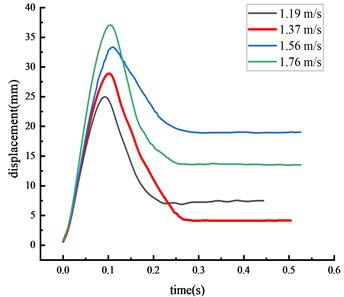
Simulations were conducted using vehicle speeds of 1.19, 1.37, 1.56, and 1.76 m/s, with a vehicle model weight of 77 kg. The results from these numerical simulations were compared to the physical model test results.
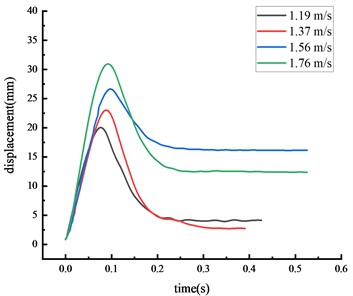
Fig. 8Simulated displacement of each key node
a) Middle span of beam
b) Beam 1/4 span
c) Top of column
d) Column center
Table 5Comparison of peak displacement at each node under different working conditions
Position | Velocity | ||||
1.19 m/s | 1.36 m/s | 1.57 m/s | 1.76 m/s | ||
Middle span of beam | Experimental value | 28.89 | 28.89 | 33.34 | 37.08 |
Calculated value | 26.59 | 27.67 | 31.52 | 36.39 | |
Middle span of beam | Experimental value | 20.03 | 23.00 | 26.64 | 30.94 |
Calculated value | 18.33 | 21.65 | 24.48 | 28.45 | |
Top of column | Experimental value | 11.37 | 14.77 | 18.72 | 23.89 |
Calculated value | 10.84 | 13.84 | 17.14 | 21.81 | |
Column center | Experimental value | 4.00 | 5.12 | 6.49 | 7.73 |
Calculated value | 4.33 | 4.71 | 5.92 | 6.97 | |
Table 6Comparison of peak strain at each node under different working conditions
Position | Velocity | ||||
1.19 m/s | 1.37 m/s | 1.57 m/s | 1.76 m/s | ||
Middle span of beam | Experimental value | 1609.6 | 1918.9 | 2009.8 | 2105.1 |
Calculated value | 1703.2 | 2045.2 | 2189.1 | 2305.6 | |
Top of column | Experimental value | –399.1 | –406.7 | –503.9 | –569.5 |
Calculated value | –421.5 | –472.2 | –527.0 | –600.9 | |
Bottom of column | Experimental value | –1245.3 | –1533.1 | –1758.8 | –2105.1 |
Calculated value | –1367.9 | –1687.9 | –1822.6 | –2206.7 | |
The time from the beginning of the impact to the stable state was approximately 0.2 seconds, with the test values closely matching the simulation values. The calculated value of each key node dynamic response was within 10 % of the actual value, suggesting that the numerical simulation calculations were reliable.
Fig. 9Simulated strain of each key node
a) Middle span of beam
b) Top of column
c) Bottom of column
3.3. Numerical simulation of collision between over-height vehicle and the HRF
Based on the numerical model verified by experiments, it was extended to the actual collision process between the over-height vehicle and the HRF, and the impact was studied under different vehicle speeds and different vehicle weights. The analysis results were as follows.
3.3.1. Different vehicle speed
3.3.1.1. Dynamic displacement response of the HRF
In China, the maximum speed limit for two-way, two-lane roads is 60 km/h. Accordingly, this research considers four distinct speeds: 30, 40, 50, and 60 km/h, and uses a 30-ton over-height vehicle to evaluate the effects on the HRF's beam at the mid-span position. The displacements of key nodes of the HRF at different vehicle speeds were shown in Fig. 10 and Table 7.
It was observed that the vehicle impact force and the displacement of key nodes increase with the increment in vehicle speed. This suggests a positive correlation between vehicle speed and displacement. When the vehicle speed elevates from 30 km/h to 60 km/h, the peak displacement at the mid-span position of the beam increases by 129.5 %. Simultaneously, the peak displacements at the 1/4 span of the beam, the top of the column, and the center of the column rise by 135.8 %, 127.5 %, and 101.7 %, respectively. Evidently, vehicle speed is a significant factor contributing to the damage. The overall deformation size of the HRF in descending order is mid-span of the beam > 1/4 span of the beam > top of the column > center of the column. The column forms a plastic hinge at its bottom, prompting the entire HRF to topple. About 67.4 % of the peak mid-span displacement is due to column overturning. The remaining displacements largely result from the beam's elastic-plastic deformation. Upon reaching peak deformation, a partial rebound was observed in the mid-span of the beam, the value of which marginally decreases with the escalation of vehicle speed.
Fig. 10Displacement of each key node
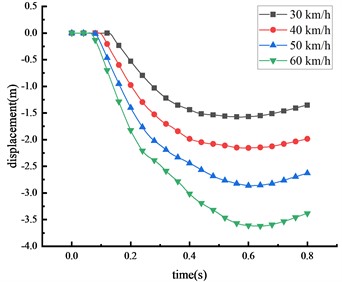
a) Middle span of beam
b) Top of column
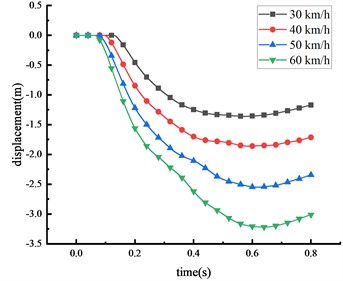
c) Beam 1/4 span
d) Column center
Table 7Peak displacement of the HRF key nodes
Vehicle speed (km/h) | Peak mid-span displacement (m) | Peak displacement of beam 1/4 span (m) | Peak displacement of column top (m) | Peak displacement of column center (m) |
30 | 1.577 | 1.360 | 1.063 | 0.468 |
40 | 2.156 | 1.860 | 1.455 | 0.553 |
50 | 2.862 | 2.550 | 1.945 | 0.779 |
60 | 3.620 | 3.219 | 2.418 | 0.944 |
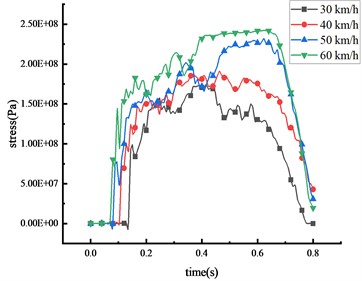
3.3.1.2. Dynamic stress response of the HRF
Under these four different speeds, when the 30-ton over-height vehicle impacts the mid-span of the beam, the stress of the column and the beam of the HRF was shown in Fig. 11 and Table 8.
It was observed that the vehicle’s impact force and the stress of key nodes are found to increase in tandem with the vehicle speed. The peak stress also shares a positive correlation with vehicle speed. As the speed escalates from 30 km/h to 60 km/h, the peak stress surges by 28.3 %, 38.5 %, 13.5 %, and 29.8 % at the mid-span of the beam, 1/4 span of the beam, top of the column, and bottom of the column respectively. The peak stress initially appears in the middle of the beam, leading to significant plastic deformation, followed by high stress at the bottom of the column. The peak stress gradually approaches the yield strength of the steel, resulting in plastic deformation and the formation of plastic hinges at the column base. As the vehicle disengages from the HRF, the stress of key nodes decreases. However, the stress at the beam's mid-span and the column's bottom exceeds the yield strength of the HRF, suggesting that plastic failure occurs at these locations. In terms of peak stress, the bottom of the column experiences more stress than the mid-span of the beam, which in turn experiences more than the 1/4 span of the beam and the top of the column.
Fig. 11Stress of each key node
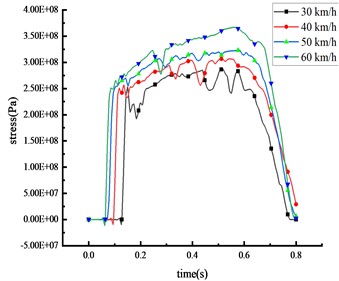
a) Middle span of beam
b) Bottom of column
c) Beam 1/4 span

d) Top of column
Table 8Stress peak data of the HRF key nodes
Vehicle speed (km/h) | Peak stress of mid-span beam (Pa) | Peak stress of column bottom (Pa) | Peak stress of beam 1/4 span (Pa) | Peak stress of column top (Pa) |
30 | 2.86×10⁸ | 3.62×10⁸ | 1.74×10⁸ | 7.99×10⁷ |
40 | 3.07×10⁸ | 4.16×10⁸ | 1.91×10⁸ | 1.26×10⁸ |
50 | 3.23×10⁸ | 4.56×10⁸ | 2.29×10⁸ | 1.50×10⁸ |
60 | 3.67×10⁸ | 4.70×10⁸ | 2.41×10⁸ | 1.88×10⁸ |
3.3.2. Different vehicle weight
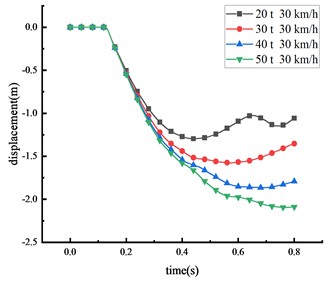
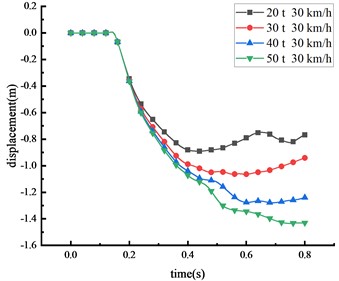
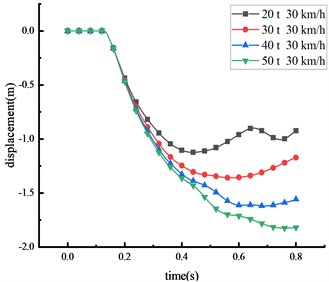
3.3.2.1. Dynamic displacement response of the HRF
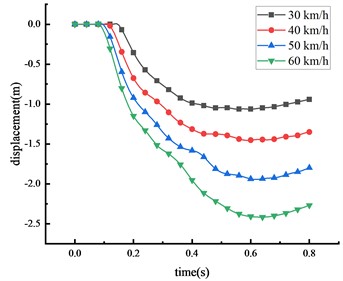
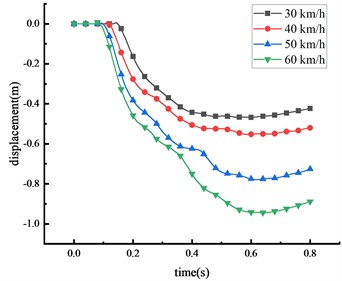
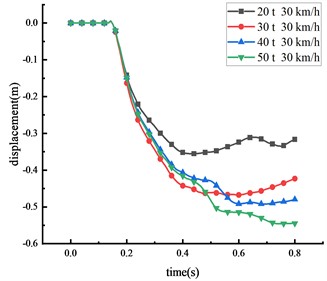
The subsequent tests and simulations revealed that, given the same vehicle weight, the damage induced by the HRF increased in severity as the vehicle speed escalated. To comprehend the effects of varying vehicle weights on the HRF, four different vehicle weights were selected to impact the midpoint of the beam at a consistent speed of 30 km/h. The displacement changes of the key nodes at different vehicle weight were shown in Fig. 12 and Table 9.
Fig. 12Displacement of each key node
a) Middle span of beam
b) Top of column
c) Beam 1/4 span
d) Column center
Table 9Peak displacement of the HRF key nodes
Vehicle weight (t) | Peak displacement of mid-span beam (m) | Peak displacement of column top (m) | Peak displacement beam 1/4 span (m) | Peak displacement of column center (m) |
20 | 1.295 | 0.890 | 1.124 | 0.355 |
30 | 1.577 | 1.064 | 1.360 | 0.468 |
40 | 1.864 | 1.276 | 1.620 | 0.492 |
50 | 2.091 | 1.433 | 1.825 | 0.546 |
The study demonstrates a positive correlation between the vehicle's weight and the displacement of critical nodes, wherein an increase in vehicle weight leads to an increase in impact force. With an increase in vehicle weight from 20 tons to 50 tons, peak displacement at various points exhibited substantial increments: a 61.5 % increase at the beam’s middle span, a 61.0 % increase at the column’s peak, a 62.4 % increase at the 1/4 span of the beam, and a 53.8 % increase at the column’s center. From the peak response of node displacement, it can be seen that the damage induced by changes in vehicle weight is lesser than the damage caused by speed variations, thus indicating that vehicle speed is the primary factor influencing impact force compared to vehicle weight. Moreover, as the vehicle weight increases, the time taken for each critical node to reach peak displacement also extends, suggesting an influence of vehicle weight on impact time. Similarly, the column's overturning angle expands with vehicle weight increase, with approximately 68.5 % of the beam peak displacement resulting from column overturning. The displacement response of the HRF follows this order: middle span of the beam > 1/4 span of the beam > top of the column > center of the column.
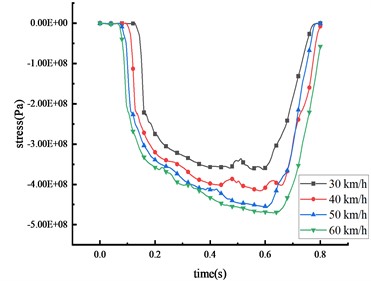
3.3.2.2. Dynamic stress response of the HRF
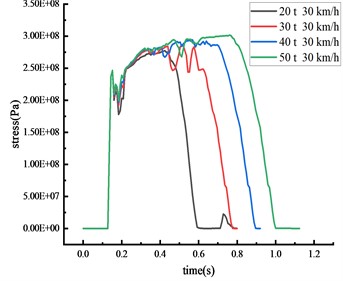
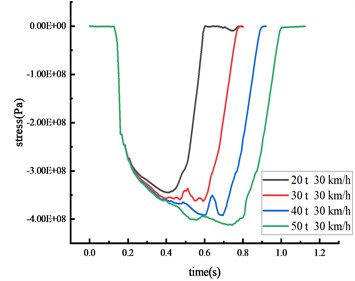
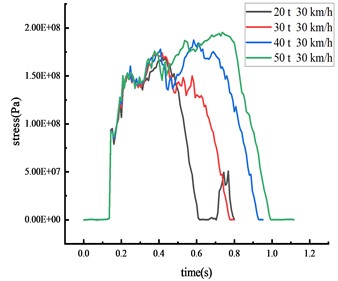
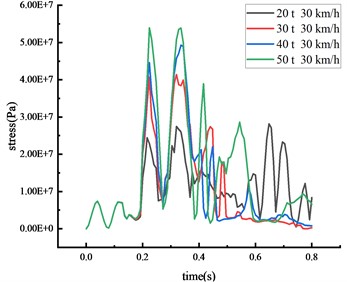
In scenarios where vehicles of differing weights strike the beam’s middle span at a speed of 30 km/h, the stress of the column and the beam was shown in Fig. 13 and Table 10.
Fig. 13Stress of each key node
a) Middle span of beam
b) Bottom of column
c) Beam 1/4 span
d) Top of column
Table 10Stress peak of the HRF key nodes
Vehicle weight (t) | Peak stress of mid-span beam (Pa) | Peak stress of column bottom (Pa) | peak stress of beam 1/4 span (Pa) | Peak stress of column top (Pa) |
20 | 2.77×10⁸ | 3.45×10⁸ | 1.69×10⁸ | 2.81×10⁷ |
30 | 2.86×10⁸ | 3.63×10⁸ | 1.72×10⁸ | 4.14×10⁷ |
40 | 2.94×10⁸ | 3.92×10⁸ | 1.87×10⁸ | 4.92×10⁷ |
50 | 3.02×10⁸ | 4.12×10⁸ | 1.95×10⁸ | 5.39×10⁷ |
It becomes evident that each critical node's impact force and stress peak escalate with an increase in vehicle weight. A positive correlation exists between vehicle weight and both of these factors. Simultaneously, the duration of the stress peak's steady section and the contact time between the vehicle and the HRF is prolonged with an increase in vehicle weight. Clear signs of elastoplastic deformation are visible on the beam and the column, with the column's plastic deformation being more prominent, indicating that the likelihood of brittle column failure escalates as vehicle weight increases. The impact of collision time is significantly affected by the change in vehicle weight compared to vehicle speed. As vehicle weight increases from 20 tons to 50 tons, peak stress exhibits various increments: a 9.0 % increase at the middle span of the beam, a 19.4 % increase at the column's peak, a 15.4 % increase at the 1/4 span of the beam, and a striking 91.8 % increase at the column's base. Thus, vehicle weight emerges as a critical factor instigating the overturning of the HRF. The stress at the column's peak fluctuates without inducing plastic deformation since the yield strength remains unattained. The beam deformation is less impacted by the rise in vehicle weight, while column overturning is notably affected.
4. Conclusions
In response to the current gap in the literature as well as the lack of relevant specifications for designing and calculating HRF, a simplified model with an over-height vehicle and the HRF was constructed in this study. The stress of each critical node was compared against model testing results. This numerically based model, having undergone experimental verification, was subsequently applied to practical scenarios. The research focused on the impact process of the over-height vehicle and the HRF under various vehicle speeds and weights. The primary conclusions are as follows:
1) When the HRF was impacted by the over-height vehicle at varying speeds, the displacement of critical nodes escalated proportionally with the increase in vehicle speed. The vehicle’s speed was found to have a greater effect on the impact force than the vehicle's weight. Following the impact on the HRF, the columns toppled, with 67.4 % of beam displacement resulting from the overturning of the column. The remaining displacement was primarily attributed to the beam’s plastic deformation. The displacement of the column was ascribed to the overturning, while both the beam and the column base exhibited elastoplastic deformation.
2) Both displacement and stress responses of critical nodes mirrored the effect of vehicle speed across differing vehicle weights. As the vehicle's weight increased, the collision time and the impact force marginally rose. The column’s overturning angle and the probability of its brittle failure also increased with the vehicle's weight. The vehicle’s weight was identified as a significant factor influencing the overturning of the HRF.
3) The comparison of strain at the HRF's key nodes, as obtained by the numerical simulation, with the strain data from the model test revealed that the peak stress occurred approximately 0.05 seconds after the HRF was impacted. This process spanned about 0.2 seconds. The greatest stress was found in the middle of the beam and at the base of the column, and the overall trend was generally consistent, thus validating the feasibility of numerical simulation calculation.
4) When the HRF was impacted, the beam was first damaged, then the bottom of the column was partially yielding, and finally the column was overturned. The elastic-plastic theory should be adopted in the design, and the bottom of the column should be strengthened to control the plastic hinge as far as possible. The HRF’s beam should not be over-designed, and its stiffness should be appropriately reduced to avoid excessive damage to over-high vehicles.
The collision process and mechanism of HRF and over-height vehicles have been thoroughly investigated in this study. However, the relationship between different influencing factors and impact forces still needs to be studied to further improve relevant specifications and propose corresponding design criteria.
References
-
R. W. Li, D. Y. Zhou, and H. Wu, “Experimental and numerical study on impact resistance of RC bridge piers under lateral impact loading,” Engineering Failure Analysis, Vol. 109, p. 104319, Jan. 2020, https://doi.org/10.1016/j.engfailanal.2019.104319
-
L. Chen, H. Wu, Q. Fang, and R. Li, “Full-scale experimental study of a reinforced concrete bridge pier under truck collision,” Journal of Bridge Engineering, Vol. 26, No. 8, p. 05021, Aug. 2021, https://doi.org/10.1061/(asce)be.1943-5592.0001749
-
L. Chen, Y. Xiao, and S. El-Tawil, “Impact tests of model RC columns by an equivalent truck frame,” Journal of Structural Engineering, Vol. 142, No. 5, p. 40160, May 2016, https://doi.org/10.1061/(asce)st.1943-541x.0001449
-
W. Fan, X. Xu, Z. Zhang, and X. Shao, “Performance and sensitivity analysis of UHPFRC-strengthened bridge columns subjected to vehicle collisions,” Engineering Structures, Vol. 173, pp. 251–268, Oct. 2018, https://doi.org/10.1016/j.engstruct.2018.06.113
-
Y. Hao, D. Xiao, H. Hao, J. Li, and J. Li, “Experimental study of reinforced concrete beams reinforced with hybrid spiral-hooked end steel fibres under static and impact loads,” Advances in Structural Engineering, Vol. 25, No. 15, pp. 3019–3030, Nov. 2022, https://doi.org/10.1177/13694332221113045
-
K. Sennah and H. R. Khederzadeh, “Development of cost-effective PL-3 concrete bridge barrier reinforced with sand-coated glass fibre reinforced polymer (GFRP) bars: vehicle crash test,” Canadian Journal of Civil Engineering, Vol. 41, No. 4, pp. 357–367, Apr. 2014, https://doi.org/10.1139/cjce-2013-0393
-
K. Oppong, D. Saini, and B. Shafei, “Characterization of impact-induced forces and damage to bridge superstructures due to over-height collision,” Engineering Structures, Vol. 236, No. 5, p. 112014, Jun. 2021, https://doi.org/10.1016/j.engstruct.2021.112014
-
R. W. Li, D. S. Cao, H. Wu, and D. F. Wang, “Collapse analysis and damage evaluation of typical simply supported double-pier RC bridge under truck collision,” Structures, Vol. 33, pp. 3222–3238, Oct. 2021, https://doi.org/10.1016/j.istruc.2021.06.041
-
M. Wu, L. Jin, and X. Du, “Numerical investigation of precast RC beam with unbonded prestressing tendon under impact loads,” Structure and Infrastructure Engineering, Vol. 19, No. 4, pp. 460–474, Apr. 2023, https://doi.org/10.1080/15732479.2021.1951777
-
P. Ganesan and S. V. S. Kumar, “FE modelling of low velocity impact on RC and prestressed RC slabs,” Structural Engineering and Mechanics, Vol. 71, No. 5, pp. 515–524, 2019, https://doi.org/10.12989/sem.2019.71.5.515
-
W. Kim, Y. Jeong, K. Kim, and J. Lee, “Non-linear dynamic analysis of reinforced concrete bridge columns under vehicle impact loadings,” Journal of Vibroengineering, Vol. 18, No. 7, pp. 4617–4626, Nov. 2016, https://doi.org/10.21595/jve.2016.16640
-
W. Zhao and J. Ye, “Impact force characteristic and mechanical behavior of trucks in collisions against bridge piers,” Structures, Vol. 34, pp. 1489–1506, Dec. 2021, https://doi.org/10.1016/j.istruc.2021.08.049
-
D. Zhou, R. Li, J. Wang, and C. Guo, “Study on impact behavior and impact force of bridge pier subjected to vehicle collision,” Shock and Vibration, Vol. 2017, pp. 1–12, 2017, https://doi.org/10.1155/2017/7085392
-
L. Chen, H. Wu, Q. Fang, and T. Zhang, “Numerical analysis of collision between a tractor-trailer and bridge pier,” International Journal of Protective Structures, Vol. 9, No. 4, pp. 484–503, Dec. 2018, https://doi.org/10.1177/2041419618775124
-
T. V. Do, T. M. Pham, and H. Hao, “Dynamic responses and failure modes of bridge columns under vehicle collision,” Engineering Structures, Vol. 156, pp. 243–259, Feb. 2018, https://doi.org/10.1016/j.engstruct.2017.11.053
-
T. V. Do, T. M. Pham, and H. Hao, “Impact force profile and failure classification of reinforced concrete bridge columns against vehicle impact,” Engineering Structures, Vol. 183, pp. 443–458, Mar. 2019, https://doi.org/10.1016/j.engstruct.2019.01.040
-
L. Chen, Y. Xiao, G. Xiao, C. Liu, and A. K. Agrawal, “Test and numerical simulation of truck collision with anti-ram bollards,” International Journal of Impact Engineering, Vol. 75, No. 1, pp. 30–39, Jan. 2015, https://doi.org/10.1016/j.ijimpeng.2014.07.011
-
L. Chen, H. Wu, and T. Liu, “Vehicle collision with bridge piers: A state-of-the-art review,” Advances in Structural Engineering, Vol. 24, No. 2, pp. 385–400, Jan. 2021, https://doi.org/10.1177/1369433220953510
-
K. L. Yue, Z. Ji, S. M. Zhang, and G. C. Wang, “Dynamic responses of bridge pier sub-jected to vehicle collision considering pile-soil interaction,” (in Chinese), Journal of Railway Science and Engineering, Vol. 19, No. 1, pp. 161–170, 2022, https://doi.org/10.19713/j.cnki.43-1423/u.t20210073
-
W. C. Zhao, J. Qian, and J. Wang, “Simplified impact force model of pier under heavy vehicle collision,” (in Chinese), Journal of Traffic and Transportation Engineering, Vol. 19, No. 4, pp. 47–58, 2019, https://doi.org/10.19818/j.cnki.1671-1637.2019.04.005
-
J. F. Zhang, L. Y. Kong, W. S. Han, and X. Z. Li, “Damage mechanism and postcolli-sion bearing capacity of prestressed concrete hollow slab bridge under overheight-vehicle collision,” (in Chinese), China Journal of Highway and Transport, Vol. 34, No. 2, pp. 177–187, 2021, https://doi.org/10.19721/j.cnki.1001-7372.2021.02.007
-
C. H. Chung, J. Lee, and J. H. Gil, “Structural performance evaluation of a precast prefabricated bridge column under vehicle impact loading,” Structure and Infrastructure Engineering, Vol. 10, No. 6, pp. 777–791, Jun. 2014, https://doi.org/10.1080/15732479.2013.767841
-
K. Hyungoo and J. Kim, “Response of a steel column-footing connection subjected to vehicle impact,” Structural Engineering and Mechanics, Vol. 63, No. 1, pp. 125–136, 2017.
-
Y. H. Liu, “Dynamic behavior of SRC columns with built-in cross-shaped steels sub-jected to lateral impact,” Structural Engineering and Mechanics, Vol. 76, No. 4, pp. 465–477, 2020.
About this article

The authors would like to gratefully acknowledge the financial support from Shandong transportation science and technology plan (No. 2022B16), Scientific research plan of Tianjin Municipal Education Commission (No. 2022ZD003), Tianjin transportation science and technology development plan (No. 2021-20, No. 2022-08), Shandong Natural Science Foundation (ZR2021ME104), Major special science and technology project of China Railway Construction Corporation Limited (2020-A01), and Tianjin Research Innovation Project for Postgraduate Students (No. 2022SKYZ320, No. 2022SKYZ366 and No. 2022SKYZ176).
The datasets generated during and/or analyzed during the current study are available from the corresponding author on reasonable request.
Yan Zhou: conceptualization, formal analysis, project administration and supervision. Zhushan Guo: data curation, investigation, methodology, software and writing – original draft preparation. Kai Zhang: funding acquisition, resources and visualization. Jinzhi Yi: validation and writing – review and editing.
The authors declare that they have no conflict of interest.
