Abstract
This paper presents experimental and analytical results for dynamic response of reinforced concrete one-way slab under blast loading. Steel frame with massive concrete foundation to minimize rigid movement was prepared for fixed-fixed boundary condition. Two 1500×2350×150 mm RC slabs were tested under surface bursts of 50 kg TNT and 100 kg TNT at standoff distance of 20 m. Types of measured data related to structural response includes strain of longitudinal reinforcement at mid-span, and longitudinal strain on unloaded side concrete at midspan. Incident pressures were measured at 15 m, 20 m, and 25 m to check if full detonation occurs. All measured data were compared with results of AUTODYN. Difference of peak reinforcement strains is 3 %, and one of concrete strains at surface of unloaded side is 11 %, showing that prepared numerical analysis can be used to estimate behavior of reinforced concrete one-way slab under explosion.
1. Introduction
Explosion induces loading with high peak and short duration, causing local and global structural damage. Number of accidental explosions and terrorist attacks is increasing. However, understanding about structural behavior under explosion is still limited, especially about real size experiments. Ngo et al. [1] detonated explosive equivalent to TNT 6 ton at stand-off distance of 30 m and 40 m to observe and analyze behavior of ultra high-strength prestressed concrete panels under explosive loading. They showed 1) that prestressing is effective in improving blast resistance, 2) how Finite Element Analysis should be conducted to have reliable result. Morales-Alonso et al. [2] conducted blast test on 12 reinforced concrete slab made of normal strength concrete and high strength concrete, of which results supported validation of proposed numerical simulation model. Wang et al. [3, 4] tested 6 reinforced concrete slabs with different standoff-distance and TNT weight combinations to figure out relationship between slab behavior and scaled distance. Hua et al. [5] performed the test on nine specimens corresponding to three different blast intensity levels to investigate the structural response of carbon fiber sandwich panels. Li et al. [6] tested five reinforced concrete including four UHPC slabs with varying reinforcement ratios and one control NSC slab with normal reinforcement to determine their response under explosive loading conditions and the test results verified the effectiveness of UHPC slabs against blast loads.
Explosive loading is influenced by the shape, weight, detonation height, type of explosive, ambient pressure, temperature, condition of ground, detonator type and etc. Thus, it is difficult to make idealized condition like laboratory test. Moreover, the safety and large controlled area are required. Thus, limited number of real scale tests have been conducted. In this paper, one-way reinforced concrete slabs were tested in real scale. Analytical model was prepared using AUTODYN, and validated based on test results.
2. Experimental program
2.1. Specimens details
Design compressive strength of concrete was 24 MPa. 26.6 MPa of average compressive strength and 27.708 MPa of modulus of elasticity were measured through uni-axial compression test after 28 days of curing. 13 mm diameter deformed steel bars were used as longitudinal reinforcement, and 10mm diameter deformed steel bar as stirrup. Yielding stress of deformed steel bar is 496.9 MPa measured from uni-axial tension test.
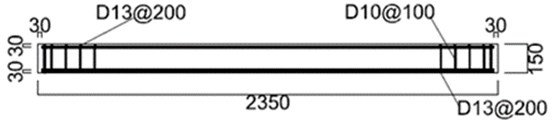
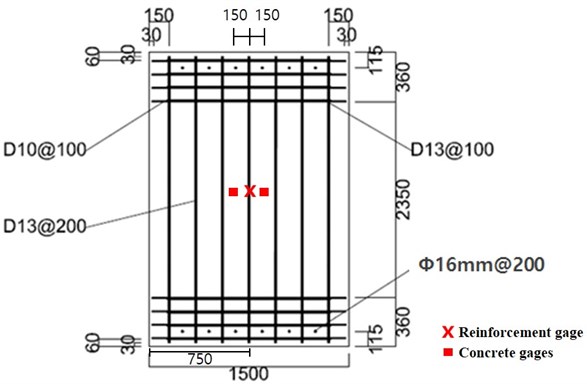
Two one-way reinforced concrete slabs were prepared with 1500 mm width, 2350 mm span length, and 150 mm thickness. Longitudinal reinforcements were placed at both loaded and non-loaded sides with 100 mm spacing and 30 mm concrete cover. For fixed boundary condition, bolts and sleeves are used. 16 mm diameter sleeves were located at 115 mm from both edges with 200 mm spacing. Stirrups were placed with 100 mm spacing within 360 mm from edge, to avoid local failure at supports from stress concentrations at sleeves. Detail of slabs is shown in Fig. 1
Fig. 1Details of the specimens
a)
b)
2.2. Test setup
The slab was fixed to steel frame by bolts at top and bottom, as shown in Fig. 2. Shape of frame to support slabs is shown in Fig. 3. Height of frame is 2200 mm, and width is 1800 mm. 4000 mm × 4000 mm × 200 mm concrete mat foundation with 35 MPa strength is installed and connected to the steel frame to minimize the movement of frame.
In Round 1 (R1), 50 kg TNT was detonated at 20 m from slab and 1 m above the ground. In Round 2 (R2), 100 kg TNT was used. In both rounds, incident pressures were measured at 15 m, 20 m, 25 m from detonation point. Strain of reinforcement was measured from gauges, which were attached to longitudinal reinforcements before curing. Gauges were placed also at the concrete surface for concrete stain. Locations of detonation point, pressure gauges and slab are shown in Fig. 4.
Fig. 2Test setup
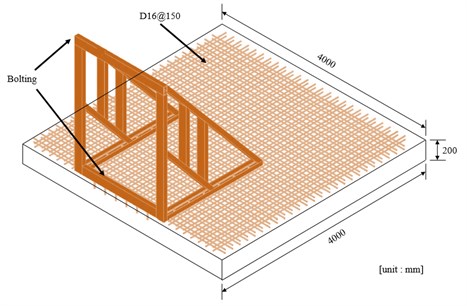
Fig. 3Details of the steel frame
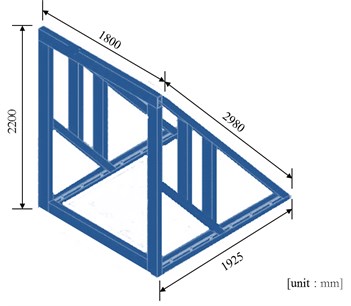
Fig. 4Location pressure sensor
a)
b)
3. Numerical simulations
In order to investigate the influence of blast loads on the concrete panel, the finite modeling was developed.
3.1. Material model
In order to investigate the influence of blast loads on the concrete panel, the FE modeling was developed. AUTODYN was employed in this study to model and analyze the concrete panels. To take into account the dynamic response of reinforced concrete panel under blast loads, the concrete was modeled with RHT dynamic damage concrete model [7]. This material model was developed by Riedel, Hiermayer, and Thomas [8], in which the strain hardening and the third invariant dependence were considered. An independent fracture strength surface was incorporated to allow material softening response for more accurate analysis. RHT model is expressed by three strength surface; elastic limit surface, failure surface, and residual surface. The elastic strength surface was introduced to consider material strain hardening behavior. The surface was obtained by scaling the failure surface in the radial direction. The failure surface was defined as a function of the normalized pressure, load angle, and strain rate. The residual strength surface can consider the strength of the completely crushed material. For steel reinforcement, Johnson and Cook model [9] was used. This model was used to describe the behavior of the steel reinforcement inside the concrete. Material properties of concrete and steel are described in Table 1 and Table 2, respectively.
Air was modeled as an equation of state using an ideal gas and the energy-related pressure. In this model, constant is set as 14, air density as 1.225 kg/m3, initial internal energy as 206800 kJ/kg
Table 1Mechanical properties for concrete model
Compressive strength (MPa) | 26.6 |
Density (kg/m3) | 2,314 |
Elastic modulus (MPa) | 27,708 |
Shear modulus (GPa) | 16.7 |
Bulk modulus (GPa) | 35.27 |
Poisson’s ratio | 0.167 |
Table 2Mechanical properties for steel model
Yield strength (MPa) | 496.9 |
Density (kg/m3) | 7,850 |
Elastic modulus (MPa) | 202,804 |
Shear modulus (GPa) | 81.8 |
Bulk modulus (GPa) | 159 |
Poisson’s ratio | 0.26 |
3.2. Numerical modeling
To set sensing range of pressure gauge before test, pressure prediction was conducted using AUTODYN. The air was modelled to be 10.000 mm × 30.000 mm with 25 mm square mesh. Axisymmetric model was prepared with 15 m, 20 m, 25 m distance pressure sensor (1 m height), as shown in Fig. 5. For infinite boundary condition, left and upper side of air boundary were set as flow-out condition. Charge initiation point was modelled at a right-hand corner to match the experimental setup.
Fig. 51D wedge model for pressure
To simulate and predict behavior of concrete realistically, three dimensional numerical simulation was adopted. Reinforced concrete panel was modelled using 10×10 mm solid element, with 10 mm thickness as shown in Fig. 6. Each steel reinforcement was modelled explicitly using beam element. This approach allows a reasonable approximation of the bending behavior of the steel reinforcement. For fixed conditions at both ends, displacement and rotation freedoms of elements within 150 mm from ends were fixed. Solid element was used for concrete, beam element for reinforcement.
Fig. 6Numerical modeling
4. Comparison of numerical and experimental results
Fig. 7 shows analytical and measured incident pressure histories of R1(TNT 50 kg) and R2 (TNT 100 kg), and Table 3 summarize peak incident pressures. In all cases, AUTODYN underestimates peak pressures comparing to test results. The average difference was 19 % for 50 kg of TNT, and 25 % for 100 kg of TNT.
Fig. 7Comparison of measured and predicted pressure
a) TNT 50 kg
b) TNT 100 kg
Table 3Comparison between prediction and experimental results
TNT charge mass (kg) | Peak pressure (kPa) | Stand-off distance | ||
15 m | 20 m | 25 m | ||
50 | Measured pressure | 90.45 | 52.21 | 33.62 |
Predicted pressure | 69.67 | 41.70 | 33.62 | |
100 | Measured pressure | 139.41 | 85.95 | 61.41 |
Predicted pressure | 111.22 | 64.00 | 42.81 | |
In Round 1, any reliable data was not collected, caused by unestablished line connection during concreter curing. Fig. 8 shows reinforced steel strains from AUTODYN and test in R2 (TNT 100 kg). Maximum strain from test is 305×106 and one from AUTODYN is 314×106 showing 3 % difference.
Fig. 9 shows concrete stain measured on unloaded side at midspan in R2 (TNT 100 kg) from test and AUTODYN. The strain gauges were attached to the longitudinal reinforcing bars and surface of concrete as shown Fig. 1. Analytical results (A_R2_C1 and A_R2_C2) do not show meaningful difference in strain histories. However, 30 % of maximum strain difference is observed in test results (E_R2_C1 and E_R2_C1), caused by the direction of the wind. Stiff descending strain after maximum value in test results comparing to analytical ones is caused by detachment of strain gauges after peak extension. The average maximum concrete strain from test is 0.00218, one from AUTODYN is 0.0012, showing 11 % difference.
Fig. 8Comparison of measured and predicted strain for longitudinal reinforcement (TNT 100 kg)
Fig. 9Comparison of measured and predicted strain for concrete (TNT 100 kg)
5. Conclusions
In this paper, behavior of one-way reinforce concrete slab under explosive loading was tested and analyzed. Two tests were conducted with 50 kg and 100 kg TNT. Incident pressures were measured as 19 % greater, and 25 % greater than numerical results in 50 kg and 100 kg TNT detonation, respectively. This difference can be caused by ground condition, TNT shape, sensor direction, etc.
Although measurement of deflection failed due to small deflection and ground shock, Maximum strain in reinforcement shows 3 % difference between test and analysis, and concrete strain at surface of unloaded side shows 11 % difference. This represents that numerical approach can simulate behavior of reinforced concrete slab under explosion with reasonable accuracy.
References
-
Ngo T., Mendis P., Krauthammer T. Behavior of ultra high-strength prestressed concrete panels subjected to blast loading. Journal of Structural Engineering, Vol. 133, Issue 11, 2007, p. 1582-1590.
-
Morales-Alonso G., Cendon D. A., Galvez F., Erice B., Sanchez-Galvez V. Blast response analysis of reinforced concrete slabs: Experimental procedure and numerical simulation. Journal of Applied Mechanics, Vol. 78, Issue 5, 2011, p. 1-12.
-
Wang W., Zhang D., Lu F., Wang S. C., Tang F. Experimental study on scaling the explosion resistance of a one-way square reinforced concrete slab under a close-in blast loading. Journal of Impact Engineering, Vol. 49, 2012, p. 158-164.
-
Wang W., Zhang D., Lu F., Wang S. C., Tang F. Experimental study and numerical simulation of the damage mode of a square reinforced concrete slab under close-in explosion. Engineering Failure Analysis, Vol. 27, 2013, p. 41-51.
-
Hua Y., Akula P. K., Gu L. Experimental and numerical investigation of carbon fiber sandwich panels subjected to blast loading. Composites Part B: Engineering, Vol. 56, 2014, p. 456-463.
-
Li J., Wu C., Hao H. An experimental and numerical study of reinforced ultra-high performance concrete slabs under blast loads. Materials and Design, Vol. 82, 2015, p. 64-76.
-
Autodyn. Theory Manual. Century Dynamics Ltd, Horsham, UK, 2005.
-
Riedel W., Thoma K., Hiermaier S. Numerical analysis using a new macroscopic concrete model for hydrocodes. Proceedings of 9th International Symposium on Interaction of the Effects of Munitions with Structures, 1999, p. 315-322.
-
Hohnson G. R., Cook W. H. A constitutive model and data for metals subjected to large strains, high strain rates and high temperatures. Proceedings of the Seventh International Symposium on Ballistics, 1983, p. 541-548.
Cited by
About this article

This work was supported by the Agency for Defense Development, Korea (2014-1294) and the National Research Foundation of Korea (NRF) Grant funded by the Korea Government (MSIP) (NRF-2017R1A2B2005581).
