Abstract
In order to predict the fatigue life of frame, a new bench test method of the frame torsion fatigue is proposed, which can approximately reflect the results of enhanced road test. The frame finite element model was established and the simulation was carried out to determine the dangerous position of fatigue life failure. The load spectrum of the fatigue dangerous position was collected, and the fatigue damage value was analyzed by the rain-flow counting method and Miner criterion. The equivalent conversion relationship of the fatigue life between bench test and road test was established. The mean error between theoretical calculation result and bench test result is 5.2 %; The mean error between theoretical calculation result and road test result is 3.85 %. The results showed that the bench test method of frame torsion fatigue can improve the precision and reliability of the frame fatigue life prediction.
Highlights
- The bench test method of the frame torsional fatigue was developed, and the equivalent conversion relationship between bench fatigue life and road fatigue life was established.
- The average error between the bench fatigue test results and the road fatigue failure mileage is 3.8%.
- The fatigue test results of the frame can really reflect the fatigue failure of the road, which can improve the fatigue test efficiency and reduce the test cycle and cost.
1. Introduction
The frame is the base body of the vehicle, and the fatigue life is an important index of the frame design. In order to verify whether the frame meets the fatigue life requirements, it is necessary to perform bench fatigue test and enhanced road fatigue test. The frame bench test can eliminate the influence of climate environment, human interference, vehicle conditions and other factors, and the bench test has strong controllability and good consistency of test data, but the reasonableness of the fatigue bench test method will directly affect the prediction results of the frame fatigue life. Road fatigue test can objectively reflect frame failure; however the road test period is long, costly, difficult, and the test site and test conditions are demanding. Therefore, it is necessary to carry out research on the bench test method of the frame fatigue.
The frame bench fatigue test has not yet formed a unified method and standard, most bench experiments are made by auto companies, and the methods and evaluation standards vary greatly [1]. The loading methods of the frame bench fatigue test is mainly included equal-amplitude cyclic load and road simulation load. The equal-amplitude cyclic load is an alternating load with the same amplitude and constant frequency applied to the frame, this loading method is simple, versatile and has many applications. The fatigue test method and fatigue life prediction of the frame under constant amplitude loading were introduced in reference [2]. Load controlled uniaxial, pure torsion, constant and variable amplitude tension–torsion tests on aluminum alloy tubular specimens were conducted in reference [3]. The prediction methods of frame fatigue life include numerical analysis method, bench test method and road method. In reference [4], the fatigue analysis method based on the combination of simulation, bench test and road test were introduced, and the excitation of bench test was road random load spectrum. In reference [5], the low cycle fatigue life prediction model of the bolted connections was established, and the experimental study and numerical analysis were carried out to predict the life distribution. The loads on the frame include longitudinal load, bending load, lateral load and torsional load, etc., and the dynamic torsional load is the main load form that causes fatigue damage to the frame [6]. Therefore, the article focuses on the analysis of the bench test method of the frame torsional fatigue.
Firstly, the frame model was created, and the frame dangerous position of the fatigue failure was determined through simulation analysis. Secondly, the load spectrum of the frame dangerous position was collected on the bench and the enhanced road respectively. Thirdly, the load spectrum was analyzed and processed by the Principles of rain flow counting [7]. The frame fatigue damage values under the bench test and road test conditions were calculated by using the Miner linear cumulative damage criterion. Finally, the bench test method of the frame torsional fatigue was developed, and the equivalent conversion relationship between bench fatigue life and road fatigue life was established.
2. The finite element simulation
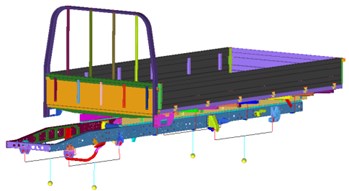
The material of the frame is B510L, the yield limit is 355 MPa, the elastic modulus is 2.1e5 MPa, the Poisson’s ratio is 0.3, and the density is 7900 kg/m3. The models of parts, assemblies, and subsystems are established, and the vehicle finite element model is shown in Fig. 1.
Fig. 1The vehicle finite element model
When the vehicle is driving on uneven roads, the four wheels are not at the same height, which causes torsional deformation of the frame and bears the torsional load. When calculating the frame strength under torsion conditions, it is necessary to constrain the translational degrees of the freedom in the , and directions of the front axle center, as well as the and translational degrees of freedom at the installation points of the rear leaf springs [8, 9]. And a forced displacement of 50 mm vertically upwards is applied to the center of the left front wheel in order to produce 2° torsional deformation of the frame.
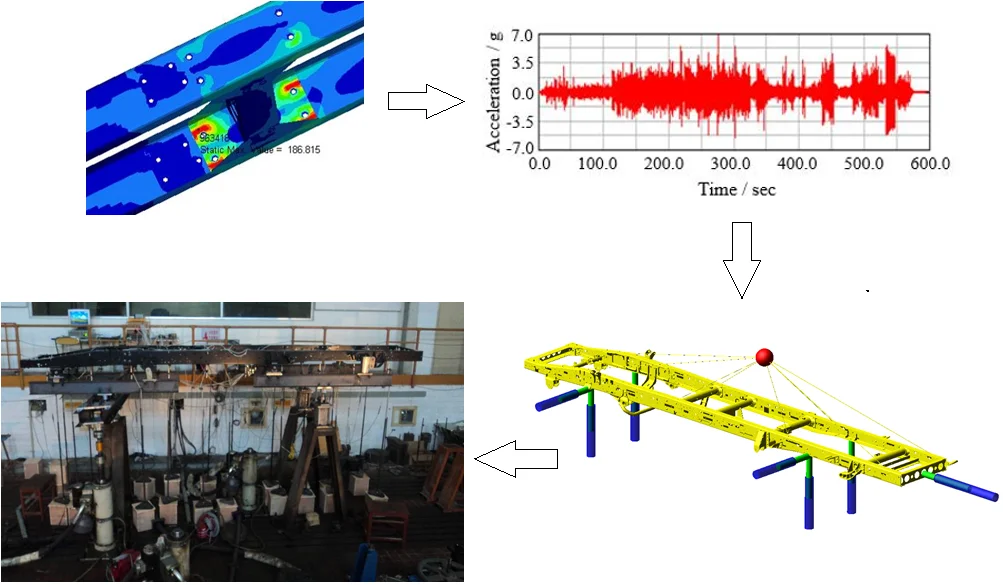
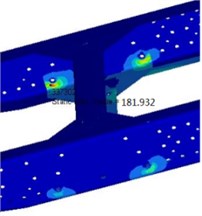
According to the design requirements, the torsional strength analysis condition of the frame is that the torsion angle of the front axle relative to the rear axle is 2 degrees, and the maximum stress of the frame dangerous point is checked. The maximum stress of the frame is shown in Fig. 2, and the dangerous position of torsional fatigue failure appeared on the left side rail of the frame above the rear axle. In the bench test and road test, the strain gauge is attached to the place where the stress is the largest as shown in Fig. 2, the load spectrum is collected, and the fatigue life analysis is performed.
Fig. 2A diagram of the frame stress cloud
3. Road spectrum collection and analysis
The test site enhanced roads mainly include 8000 m stone road, 250 m washboard road, 50 m twisted road, 50 m fish scale pit road, 250 m pebble road, 1500 m reinforced cement road and 400 m concrete road. The distance between the pits of the stone road is 20-60 mm, and the height difference is about 15-40 mm.
3.1. Analysis of the frame torsion deformation
In order to analyze the torsional deformation of the frame under road test conditions, it is necessary to collect the acceleration on the frame above the front and rear axles. The acceleration signal is converted into displacement signal by Fourier transform, and the displacement signal is used to drive the multi-body dynamic model of the frame, and the relationship curve between torsion angle and time is obtained through calculation [10]. The LMS test Lab software, the LMS data collector and the PCB accelerometers are used to collect the acceleration signals at the four positions on the left and right sides of the frame above the front and rear axles. The measuring points on left side of frame are shown in Fig. 3 and the collected acceleration signals are shown in Fig. 4.
Fig. 3Frame acceleration collection points
a) The front measuring point
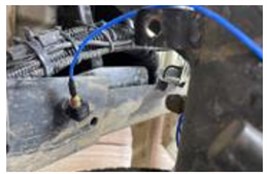
b) The rear measuring point
Fig. 4The frame acceleration spectrum
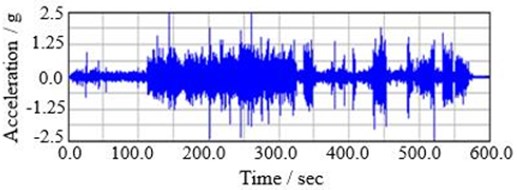
a) The front point acceleration of the frame
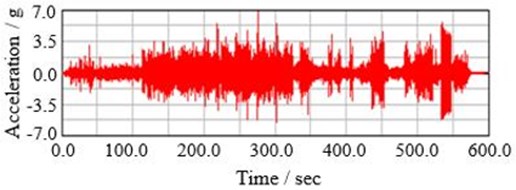
b) The rear point acceleration of the frame
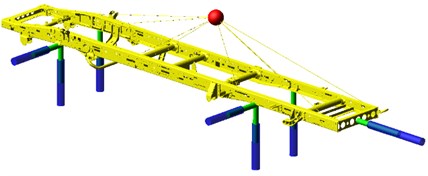
The multi-body dynamic model of the frame is established by using Adams software, as shown in Fig. 5. The direction movement of the two points on the left side is restricted, the direction movement of the rear end of the frame is restricted. The acceleration signal is transformed into displacement signal, and the frame dynamic model is driven by the direction displacement signal of the four points. A plane is composed by the left front point, the left rear point and the right rear point. Through simulation, the torsion angle of the right front point relative to the plane can be extracted.
Fig. 5The frame multi-body model
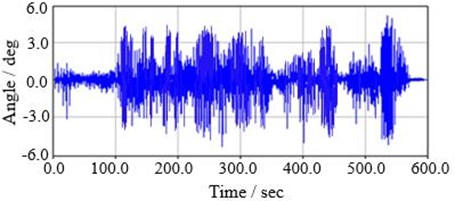
The frame torsion angle-time history curve is shown in Fig. 6. The main range of frame torsion angle is 0~4°, and the larger values mainly appear around 4°. Therefore, in the design process of the bench test method, the torsion angle setting range is –4°-4°.
Fig. 6The frame torsion angle-time history curve
3.2. Calculation of equivalent damage in road conditions
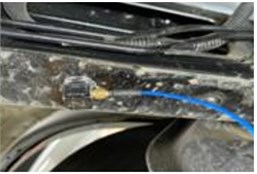
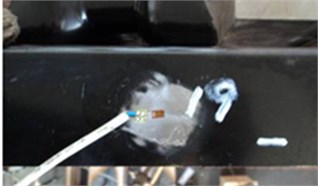
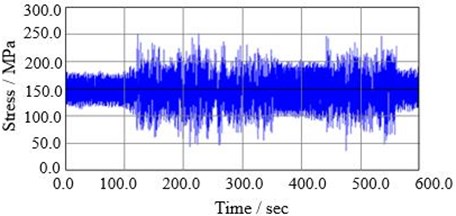
In order to analyze the stress level of the fatigue failure dangerous position and predict the fatigue life of the frame, it is necessary to collect the strain signal of the dangerous position under road test conditions. After the simulation analysis of the frame, it is determined that the position of the left side rail above the rear axle and the weld on the left end of the third beam are the most likely to fatigue failure. The strain signals of the two positions are collected and processed by the resistance strain gauge sensor and the LMS data acquisition and processing system. The test photo of the frame longitudinal beam is shown in Fig. 7 and the load spectrum is shown in Fig. 8.
Fig. 7Frame strain signal collection position
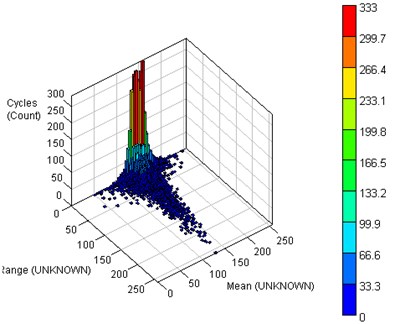
The load spectrum needs to be processed before the equivalent damage calculation of the frame, such as eliminating burrs, drift, etc. Then the load spectrum time domain signal is converted into a rain flow matrix by the rain flow counting method to obtain the number of strain cycles [11]. After driving for 1 lap in the test field, the rain flow matrix at the test position of the frame is shown in Fig. 9. The average stress is 130 MPa, and the stress range is 46-280 MPa.
Fig. 8Stress spectrum of the collection position
According to the frame material S-N curve and the load spectrum rain flow matrix, the damage value of the test position is calculated through the Miner damage theory, and the damage value per lap (15 km) is 4.6526e-4. When the cumulative damage value is 1, the left side rail of the frame above the rear axle will fail, and the corresponding mileage is 32240 km. The damage value of the weld is 4.1232e-4 per lap, and the fatigue failure mileage is 36,400 km.
Fig. 9Rain flow matrix of load spectrum
4. Design and verification of the bench test method
4.1. Bench test method design
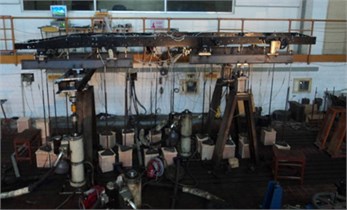
The I-beams replace the front and rear leaf springs, and are connected to the frame with lugs, bushes and axle pins. The three translational degrees of freedom at the center of the front right I-beam are constrained, the and direction translational degrees of freedom at the centers of the rear I-beams are constrained. The vertical upward load is applied to the center of the left front I-beam. The torsional deformation of the frame appeared under the action of the loader, the loading frequency is 1.4 Hz, and the experimental picture is shown in Fig. 10.
Fig. 10A diagram of the fatigue bench test
According to the road test data analysis, the torsional deformation range of the frame is –4°-4°. The forced displacement applied on the loader is ±28 mm, ±50 mm, ±144 mm, and ±188 mm respectively, so that the frame will be ±1°, ±2°, ±3°, ±4°torsion deformation. The collected stress of the left side rail of the frame is 108.5 MPa, 157.6 MPa, 227.5 MPa and 349.8 MPa respectively; The stress of the weld on the left end of the third beam is 95.4 MPa, 136.3 MPa, 202.5 MPa and 312.6 MPa. And according to the Miner damage theory, the single fatigue damage result are calculated as shown in Table 1 and 2.
Table 1The single fatigue damage results
Number | Conditions | Value |
1 | ±1° | 1.17e-6 |
2 | ±2° | 1.89e-6 |
3 | ±3° | 3.86e-6 |
4 | ±4° | 9.77e-6 |
Table 2The single fatigue damage results
Number | Conditions | Value |
1 | ±1° | 1.05e-6 |
2 | ±2° | 1.72e-6 |
3 | ±3° | 3.55e-6 |
4 | ±4° | 8.76e-6 |
In order to shorten the test cycle and to facilitate the implementation of the project, the number of experiments is the same for each experimental condition. When the total damage value is 1, the number of experiments for each working condition is 60,000 times, and the corresponding total mileage is 32,240 km. When the total damage value of the weld on the third beam is 1, The number of experiments for the first three conditions are 60000 times each , and the number of the fourth working condition is 71,000 times, and the corresponding total mileage is 36400 km.
4.2. Experimental verification
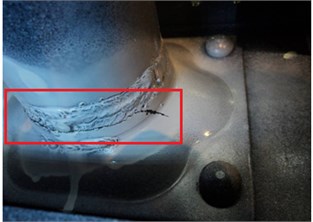
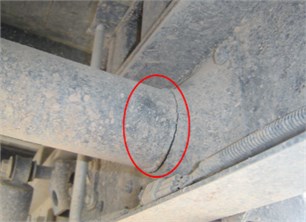
According to the designed experimental method, the torsional fatigue bench test is carried out on the frame. The first three experimental conditions have accumulated 180,000 cycles, and the frame has no fatigue failure. Under ±4° test conditions, the left side rail of the frame above the rear axle cracked when the cycle was 48235 times and the cumulative cycle was 228235 times, as shown in Fig. 11. Under ±4° test conditions, the weld on the third beam cracked when the cycle was 57265 times and the cumulative cycle was 237265 times, as shown in Fig. 12. The mean error between theoretical calculation result and bench test result is 5.2 %.
Fig. 11The frame rail of the bench test result
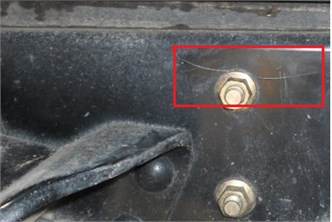
Fig. 12The weld of the bench test result
In the enhanced road fatigue test, when the mileage is 29526 km, the left side rail of the frame above the rear axle cracked, as shown in Fig. 13; when the mileage is 35000 km, the weld on the left end of the third beam cracked, as shown in Fig. 14. Through theoretical analysis, the fatigue failure of the frame occurred after 240,000 bench tests, and the corresponding mileage on the enhanced road is 32,240 km. The actual number of bench test with cracks in the frame was 228,235, which translated to a driving mileage of 30660 km, and the actual fatigue failure mileage was 29526 km, the error is 3.7 %; The weld on the left end of the third beam crack appeared after 237265 times on bench test, the result converted into the mileage of the enhanced road was 34408 km, the actual fatigue failure mileage was 33030 km, the error was 4.0 %. The comparative test results show that the frame fatigue test established in the article can truly reflect the fatigue failure of the frame on the enhanced road.
Fig. 13The frame rail of the road test result
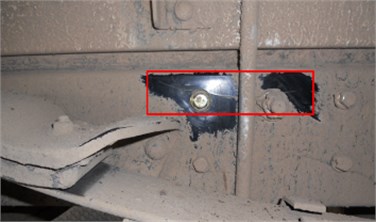
Fig. 14The weld of the road test result
5. Conclusions
In this paper, the finite element model of the frame is established, and the left side rail of the frame above the rear axle is the fatigue failure dangerous position by simulation analysis. Through the FFT analysis of the acceleration data of the road test, the main range of the frame torsion angle is 1°-4°. According to the fatigue damage value of the frame in the bench test and the road test, the frame torsion fatigue bench test method is developed, and the equivalent conversion relationship between the bench fatigue test and the road fatigue test is established. Comparing the frame fatigue results of the bench test and the enhanced road test, it is shown that the torsion fatigue bench test method can improve the frame fatigue life prediction accuracy and reliability.
References
-
Yun S. H. I. The Cradle Fatigue Rig Test and Verification. Second Edition, Drive System Technique, Vol. 3, 2012, p. 44-48.
-
Petrone Nicola, Meneghetti Giovanni Fatigue life prediction of lightweight electric moped frames after field load spectra collection and constant amplitude fatigue bench tests. International Journal of Fatigue, Vol. 127, 2019, p. 564-575.
-
Wang Xiao Wei, Shang De Guang, Sun Yu Juan, Chen Hong Multiaxial high-cycle fatigue life prediction model considering mean shear stress effect under constant and variable amplitude loading. Theoretical and Applied Fracture Mechanics, Vol. 96, 2018, p. 676-687.
-
Bakir Mehmet, Ozmen Basaran, Donertas Caner Correlation of simulation, test bench and rough road testing in terms of strength and fatigue life of a leaf spring. Procedia Engineering, Vol. 213, 2018, p. 303-312.
-
Saranik M., Jézéquel L., Lenoir D. Experimental and numerical study for fatigue life prediction of bolted connection. Procedia Engineering, Vol. 66, 2013, p. 354-368.
-
Li Peng, Tan Zhijun, Ni Chenglin, Song Hua, Li Chengyan Heavy-duty commercial vehicle frame based on the bench test. Journal of Sichuan Ordnance Engineering, Vol. 7, 2014, p. 64-66.
-
Wu Wenchao, Fang Yibo, Ning Jia, Tang Yunfeng Research on fatigue durability test method for automobile chassis components based on rain-flow counting method. Auto Mobile Science and Technology, Vol. 12, 2013, p. 46-49.
-
Sun Yalong, Zeng Falin Study on fatigue life simulation of commercial vehicle frame. Journal of Chongqing Institute of Technology, Vol. 2, 2016, p. 29-36.
-
Kepka Miloslav, Kepka Miloslav Jr, Václavík Jaroslav, Chvojan Jan, Bakir Mehmet, Ozmen Basaran, Donertas Caner Fatigue life of a bus structure in normal operation and in accelerated testing on special tracks. Procedia Structural Integrity, Vol. 17, 2019, p. 44-50.
-
Wang Tao, Wang Liangmo, Tan Li, Zou Xiaojun Fatigue failure assessment based loading reproduction for commercial vehicle cab. Journal of Huazhong University of Science and Technology, Vol. 5, 2017, p. 61-66.
-
Lu Yaohui, Zheng Heyan, Zeng Jing, Chen Tianli, Wu Pingbo Fatigue life reliability evaluation in a high-speed train bogie frame using accelerated life and numerical test. Reliability Engineering and System Safety, Vol. 188, 2019, p. 221-232.
Cited by
About this article

The authors would like to acknowledge the support of Xiaoping Su professor for providing the materials and apparatus to carry out the experimental works.
