Abstract
With the advent of the big data era of air traffic control systems, the application of trajectory clustering in the field of air traffic has received widespread attention. This article reviews the trajectory clustering methods proposed in domestic and foreign literature. According to the different similarity measures and clustering evaluation criteria, the application of different clustering methods in trajectory clustering is introduced from several aspects, and the advantages and applicable scenarios of each algorithm are summarized. Then, based on the real flight history radar data information, the performance of the two different clustering algorithms in track clustering is analyzed. It mainly includes two aspects: First, in the data preprocessing part, data cleaning, filtering, and interpolation are performed. After processing, the data is resampled to obtain research data. Then, according to the characteristics of the track data, the two hyperparameters of the DBSCAN algorithm and the value of the K-means algorithm are determined, and the clustering results are visually displayed in combination with the real flight data from the Capital International Airport to Shanghai Hongqiao International Airport.
Highlights
- First, it reviews the application of different clustering methods in trajectory clustering from multiple aspects.
- Then, the advantages and applicable scenarios of each clustering algorithm are summarized.
- Finally, based on real flight history radar data information, DBSCAN algorithm and K-means algorithm are used to cluster flight history trajectories.
1. Introduction
With the rapid economic development, the civil aviation industry is also developing rapidly. As of 2019, the entire industry has completed a total transportation turnover of 129.325 billion ton-kilometers, an increase of 7.2 % over the previous year. Among them, the total turnover of domestic routes completed was 82.951 billion ton-km, an increase of 7.5 % over the previous year [1]. The relevant characterization data of each link of civil aviation transportation shows the characteristics of massive and multi-source. According to a study by the Federal Aviation Administration, a single jet engine can generate the equivalent of 20 terabytes of data in a year. Huge data resources have become the core resources for industry development, and how to make good use of data resources will determine the future development of the industry [2]. Using data mining methods to turn these data into a source of knowledge for exploration is the focus and difficulty of the entire industry. As a very important data analysis method in the field of data mining, cluster analysis is used by more and more researchers in the process of trajectory data mining. The goal of trajectory clustering is to find those aircraft trajectories with the same motion pattern. Through the analysis of the internal motion patterns and characteristic information of the tracks, the similarity between the tracks is determined, and then the tracks with higher similarity are classified into one category. Comprehensive control operation data such as trajectory data, flight plan data, voice data, etc., through the mining and analysis of massive operation data, it is possible to realize uninterrupted real-time performance of safety-related indicators such as air traffic flow situation, control operation safety, and workload Monitoring and evaluation. This will help industry personnel understand the characteristics of traffic flow in the airspace, assess the traffic potential of the route, and is of great significance to alleviating the pressure of air traffic congestion and ensuring the safe and efficient operation of aircraft.
This article reviews and summarizes the trajectory clustering methods proposed in domestic and foreign literature. Classify and compare these algorithms, find the differences between them, analyze the differences, and put forward some research conclusions. By using two different clustering methods to analyze the real radar track data, the difference between the two is intuitively reflected.
2. Overview of track clustering algorithm
According to different similarity measures and clustering evaluation criteria, the existing spatial clustering algorithms can be roughly divided into: clustering methods based on division, clustering methods based on hierarchy, clustering methods based on density, clustering based on grids Class methods, model-based clustering methods and fuzzy clustering algorithms, etc. Because of the unique characteristics of trajectory data, different clustering algorithms have different applications in trajectory clustering. Scholars at home and abroad have done a lot of research on this.
2.1. Clustering based on partition
The basic idea of the partition-based clustering algorithm is to give the number of clusters in advance and update the data of the clusters cyclically to make the clustering result better. Common partition-based methods include k-means clustering algorithm, k-medoids clustering algorithm, and improved algorithms based on these two algorithms. Among them, the k-means algorithm is simple to use, easy to understand and efficient, and is the most commonly used. In 2009, Adric Eckstein [3] used principal component analysis and K-means algorithm to cluster trajectories, sampled flight positions, and clustered spatially according to the two key components given. In 2013, Wang Jiening et al. [4] based on existing track clustering algorithms at home and abroad, and believed that traditional track clustering algorithms lacked time information, and the distribution of track points was closely related to the arrival time. Thus, a clustering method in time and space was proposed. In 2014, Wang Chao et al. [5] established a 3D grid-based similarity model between trajectories on the basis of analyzing the spatial characteristics of flight trajectories. Using spectral clustering algorithm to cluster the flight trajectory samples in the terminal area, proposed A recognition method of prevailing traffic flow and abnormal trajectory based on trajectory clustering kernel density estimation, realized track clustering and eliminated the influence of abnormal trajectory. In 2015, Ma Yong [6] used a spectral clustering algorithm based on undirected graph segmentation to cluster historical tracks. Xu Tao et al. [7] proposed a track clustering model based on the normal distance of track points. The model used the normal distance of the track points as the track similarity measurement method, and used the K-medoids clustering algorithm to cluster the tracks in 2D and 3D. This model could better measure the similarity between tracks and achieved a good clustering effect. Bai Hao et al. [8] proposed a fuzzy track association algorithm based on K-center point clustering. The algorithm was based on the K-center point clustering algorithm, which taked the system track as the cluster center. It used the strategy of linking the local track with the system track, and used the fuzzy analysis method to describe the similarity between the tracks. In 2017, Zhao Yuandi et al. [9] combined resampling and principal component analysis methods to map high-dimensional trajectory data to low-dimensional space while preserving flight characteristics, and established flight trajectory cluster analysis and abnormal trajectory extraction models based on the Mean Shift method . In 2019, Du Shi et al. [10] performed clustering analysis based on the k-means clustering algorithm of spatially similar distances, and performed the classification results of track clustering with different values through the dynamic time warping (DTW) algorithm. Similarity measure, determine the appropriate value. In this way, the actual flight tracks are classified according to the similarity of space operation among the many tracks, the center track is found, and the track classification is realized. In 2019, Du Shi et al. [10] performed cluster analysis based on the k-means clustering algorithm of spatial similarity distance. And through the dynamic time warping (DTW) algorithm to measure the similarity of the classification results of different values of track clustering, and determine the appropriate value. In this way, the actual flight tracks were classified according to the similarity of space operation among the many tracks, the center track was found, and the track classification was realized.
2.2. Hierarchical clustering
The hierarchical clustering algorithm uses distance as a measurement standard and decomposes the known data set hierarchically until a certain termination condition is met. Hierarchical clustering algorithms are usually divided into aggregation hierarchical algorithms and split hierarchical algorithms. Aggregation hierarchy algorithm, which is also called bottom-up algorithm, treats each data object as a cluster class, and merges adjacent cluster classes through an iterative loop until the termination condition is met. Split clustering algorithm, also called top-down algorithm, treats all data objects as clusters, and classifies each cluster into smaller clusters through an iterative loop until the termination condition is met. Common level-based algorithms include BIRCH (Balanced Iterative Reducing and Clustering Using Hierarchies) algorithm, CURE (Clustering Using Representatives) algorithm, Rock algorithm and Chameleon algorithm. Frank Rehm [11] selected radar data as the research object, and combined the existing trajectory to define the concept of track similarity. At the same time, he clustered the approach procedures of different runways in the same airport as the research object. But before the end of clustering, no extraction of track feature values was performed. In 2013, Wang Chao et al. [12] improved the method of Frank Rehm, established a similarity measurement model between tracks based on the reverse comparison method of corresponding radar track points, and applied hierarchical clustering method to cluster the track data set analysis. In 2016, Xu Tao et al. [13] proposed a track similarity measurement method based on the weighted area between tracks, and used the CURE algorithm to achieve track clustering. In 2020, Zhang Yong et al. [14] aimed at the fact that most of the existing clustering algorithms for processing trajectory data have high time complexity and the clustering effect cannot meet the processing expectations. He proposed a parallel pruning hierarchical clustering algorithm based on fast DTW distance measurement. The hierarchical clustering method is usually suitable for solving and processing the data processing problems with the characteristics of massive increase or complex height changes. Therefore, the hierarchical clustering method has special advantages for the data processing of civil aviation flight trajectories.
2.3. Density-based clustering
The density-based clustering algorithm is based on the distribution characteristics of the data points in the data set. Areas with sufficient density are connected to form a connected density domain. Then the data of the same density domain is classified into the same cluster category. Commonly used density-based clustering algorithms include DBSCAN (Density-Based Spatial Clustering of Applications with Noise) algorithm and OPTICS (Ordering Points to Identify the Clustering Structure) algorithm. In 2005, Cong Rong, Wang Xiukun, Li Jinjun and other scholars [15] started with cluster analysis theory and proposed a new cluster analysis method based on hierarchical and density track cluster analysis. In 2007, J. -G. Lee [16] et al. developed a new track clustering algorithm TRACLUS based on existing algorithms. Experimental results showed that TRACLUS correctly found the true trajectory data of common sub-tracks. In 2011, Yuan Guan et al. [17] divided the trajectory into several trajectory segments according to the turning angle, and then judged the matching degree of the trajectory by calculating the structural similarity of the trajectory segments, and proposed a density-based TC-SS algorithm to complete trajectory clustering.Maxime Gariel et al. [18] and Aude Marzuoli et al. [19] used principal component analysis and density-based clustering methods for trajectory clustering. Zhao Enlai et al. [20] analyzed radar data and proposed an improved density-based clustering method for track data. The algorithm used a distance measurement that combined weighted Manhattan distance and penalty coefficient, customized the neighborhood of points according to the characteristics of target motion, and used time clipping to improve the efficiency of the algorithm. The advantage of the density-based clustering algorithm is that it can obtain clusters of different shapes, and it can also successfully identify and eliminate the sample data of some noise isolated points.
2.4. Grid-based clustering
The grid-based clustering algorithm divides a data sample space into finite grid structures, and then performs clustering operations on these grid structures. Common grid-based algorithms include STING (Statistical Information Grid-based Method) algorithm and Wave Cluter algorithm. Kenneth et al. [21] took the busy area of the airport as the research object and proposed a new grid-based clustering method. This type of algorithm performs cluster analysis and research on the track data corresponding to different airports, so as to obtain the center track clustering results of the arrival and departure routes to each airport. The unique advantage of this type of algorithm is its faster processing speed, because the algorithm processing time is only related to the number of grids, not the number of data.
2.5. Model-based clustering
A model-based algorithm is a fitting method that combines a given data set with a certain mathematical model to form an optimal method and automatically determine the number of clusters according to standard statistical methods. Common model-based algorithms include statistical methods and neural network methods. In 2015, Eerland W. J. [22] selected the Gaussian equation to model uncertainty based on historical data statistics. The method he proposed could choose to filter the track. At the same time, a group of representative trajectories could be automatically generated and several important trajectories could be selected from these representative trajectories.
2.6. Fuzzy clustering algorithm
In the fuzzy clustering algorithm, each object may not only belong to a cluster class, it uses a membership function to associate the relationship between the object and the cluster class. FCM (Fuzzy C Mean) algorithm is one of the most popular and widely used fuzzy clustering algorithms. In 2013, Wang Chao et al. [23] analyzed the characteristics of historical flight paths and used an improved fuzzy C-Means algorithm that fused genetic algorithm and simulated annealing algorithm to cluster feature points. The track similarity matrix was obtained by the longest common subsequence (LCS) algorithm, and the track cluster was obtained by using the matrix, and finally the center track was formed, and the effectiveness of the new algorithm was verified. In 2014, Wang Botao et al. [24] used fuzzy clustering method to directly extract track feature points, and then clustered the track feature points to improve the traditional fuzzy clustering algorithm, which is easy to fall into the problem of local optimization. Eventually he achieved track clustering. Fuzzy clustering algorithm or fuzzy weighted clustering algorithm improves the efficiency of track clustering.
3. Track clustering based on radar data
3.1. Data preprocessing based on clustering
3.1.1. Data introduction
The data used in this article comes from the secondary radar monitoring system. Each flight number corresponds to a piece of track information, usually including multi-dimensional characteristic parameters such as timestamp, flight number, landing and landing airport, latitude and longitude, altitude, speed and so on. The recording interval of each track point is 8 seconds, which determines that each track is composed of a series of discrete track points. The number of track points included in different tracks is also different. Table 1 shows Partial track point information of a flight sorted by time.
Table 1Track data fragment
Time stamp | Call sign | Longitude | Latitude | Height | Ground speed |
20180930230123 | DKH1252 | 1163625 | 400551 | 460 | 220 |
20180930230131 | DKH1252 | 1163632 | 400612 | 580 | 243 |
20180930230139 | DKH1252 | 1163644 | 400627 | 640 | 258 |
20180930230147 | DKH1252 | 1163654 | 400646 | 700 | 258 |
The aircraft trajectory can be expressed in the form of the following collection:
where is the aircraft trajectory set, is the trajectory number, is the total number of trajectories, the flight trajectory of a flight , which is composed of a series of multi-dimensional radar points ordered by time:
where is the -th multi-dimensional radar point in the -th trajectory, is the radar point number, is the number of radar points, and the information contained in each radar point is represented by a vector:
Eq. (3) represents the five characteristic parameters of time, longitude, latitude, altitude and speed of the -th multi-dimensional trajectory point in the -th trajectory.
3.1.2. Data cleaning
The original radar data contains a lot of dirty data, as well as some attribute data that is not useful for research work, so it is very necessary to preprocess the data to improve the quality of the data. First, according to the flight call sign and time stamp, the radar data is fused with the flight plan data of the same period. Flight plan data is used to supplement radar data. Screen the fused data, classify and mark according to flight call signs, time stamps, and airports, and obtain the trajectory sequence of each flight for a specific city. Filter the data set according to the recording time range, record length, etc. to remove obvious erroneous data and incomplete data to ensure the validity of the data. Table 2 shows some trajectory data after fusion.
Table 2Some data fragments after fusion
Time stamp | Call sign | Longitude | Latitude | … | Actual departure time | Actual landing time |
20180930 230123 | DKH1252 | 1163625 | 400551 | … | 2018/10/1 6:59:00 | 2018/10/1 8:40:00 |
20180930 230131 | DKH1252 | 1163632 | 400612 | 2018/10/1 6:59:00 | 2018/10/1 8:40:00 | |
20180930 230139 | DKH1252 | 1163644 | 400627 | 2018/10/1 6:59:00 | 2018/10/1 8:40:00 | |
20180930 230147 | DKH1252 | 1163654 | 400646 | 2018/10/1 6:59:00 | 2018/10/1 8:40:00 |
3.1.3. Interpolation of missing data
The radar system will have missing track points during the work process. Taking the data used in this article as an example, the data is updated once with a time granularity of 8 seconds. the missing data ranges from 20 seconds to 20 minutes. In order to solve this problem, this paper uses a linear interpolation function to interpolate according to the established time granularity. In order to make the trajectory set more suitable for clustering, all the trajectories after interpolation processing are resampled into equal-length sequences, so that each trajectory contains the same number of radar points. the data preprocessing process is shown in Fig 1. the data after data preprocessing can be used for the study of track clustering.
Fig. 1Data preprocessing process

3.2. Algorithm introduction
3.2.1. K-means algorithm
K-Means is a typical partition clustering algorithm, where indicates that the cluster is clusters, Means represents taking the average of the data values in each cluster as the center of the cluster, or called the centroid. That is to describe the cluster with the centroid of each class. K-means basic algorithm flow:
Input: sample data set , number of clusters :
1) Randomly select sample points from the sample as the initial mean vector .
2) Cycle through the following steps until the stop condition is reached.
(2.1) Let .
(2.2) Calculate the distance between them to k mean vectors for all sample points, take the mark of the mean vector corresponding to the shortest distance as the cluster mark of the point, and then add the point to the corresponding cluster .
(2.3) Calculate their new mean vector for each cluster. if there is a change from the previous vector, update the cluster and use it as the new mean vector. if there is no change, it will not change. Finally, the points in the cluster are connected as closely as possible, and the distance between the points between the clusters is as large as possible.
3.2.2. DBSCAN algorithm
The DBSCAN algorithm is a density-based data clustering method. the core idea is to start from a certain core point and continue to expand to the area where the density is reachable, so as to obtain a maximized area including the core point and the boundary point. the density of any two points in the area is connected, and one of the clusters can be uniquely determined by any core object in the area.
The basic algorithm flow of DBSCAN:
Input: Sample data set , scan radius , the minimum number of neighbor points MinPts where the given point becomes the core object in the neighborhood of .
(1) Determine whether the input point is a core object: check the neighborhood of each point in the data set to search for a cluster. If the neighborhood of point contains more points than MinPts, create a cluster with as the core object.
(2) Find all density reachable points in the neighborhood of the core object: find the set of maximum density connected objects for all direct density reachable points in the domain of all core objects, which involves the merge of some density reachable objects.
(3) The neighborhood of all core objects is traversed
3.3. Example analysis
3.3.1. Data set
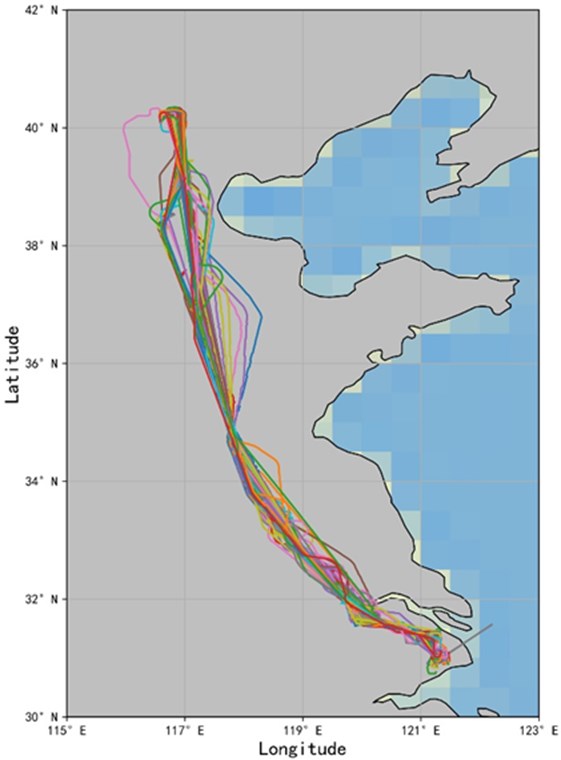
This article selects the flight that took off from Capital Airport in October 2018 to land at Shanghai Hongqiao Airport. the straight-line distance is about 1076.91 kilometers. After data cleaning, interpolation processing and data resampling, the data set used in the study contains 992 tracks. a total of 694,400 track points. the trajectory of some flights from Beijing to Shanghai is shown in Fig. 2.
Fig. 2Beijing-Shanghai flight trajectory
3.3.2. Parameter selection
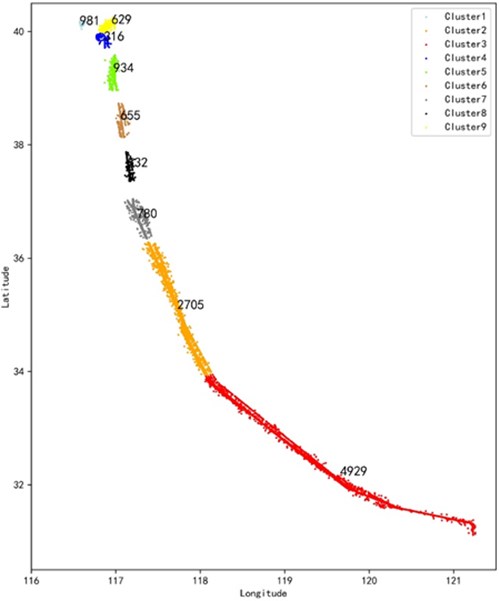
The DBSCAN algorithm mainly determines the two hyperparameter scanning radii and the minimum neighbor points MinPts of the core object. for the selection of the scanning radius and MinPts, this paper firstly fitted and calculated the parameters of each parameter combination, and used the model evaluation score calculated by the combination to be the contour coefficient and the noise ratio. at the same time, the larger the reference score, the better, and the smaller the noise ratio. the better the principle, it is estimated that the value of is between 4.5-7, and the value of MinPts is between 60-90. Based on this and according to the actual clustering graphics, this paper chooses the parameter combination of 6 and MinPts = 80. at this time, the noise data accounts for 9.55 % of the entire data set, and the contour coefficient is 0.454.
The key to the accuracy and effectiveness of the K-means clustering method is to determine the value of properly, but it is often impossible to directly and accurately determine the value of at the beginning. by calculating the error square sum SSE of all clustering samples, the quality of the clustering effect is evaluated, and finally 9 is selected as the optimal value.
3.3.3. Cluster performance analysis
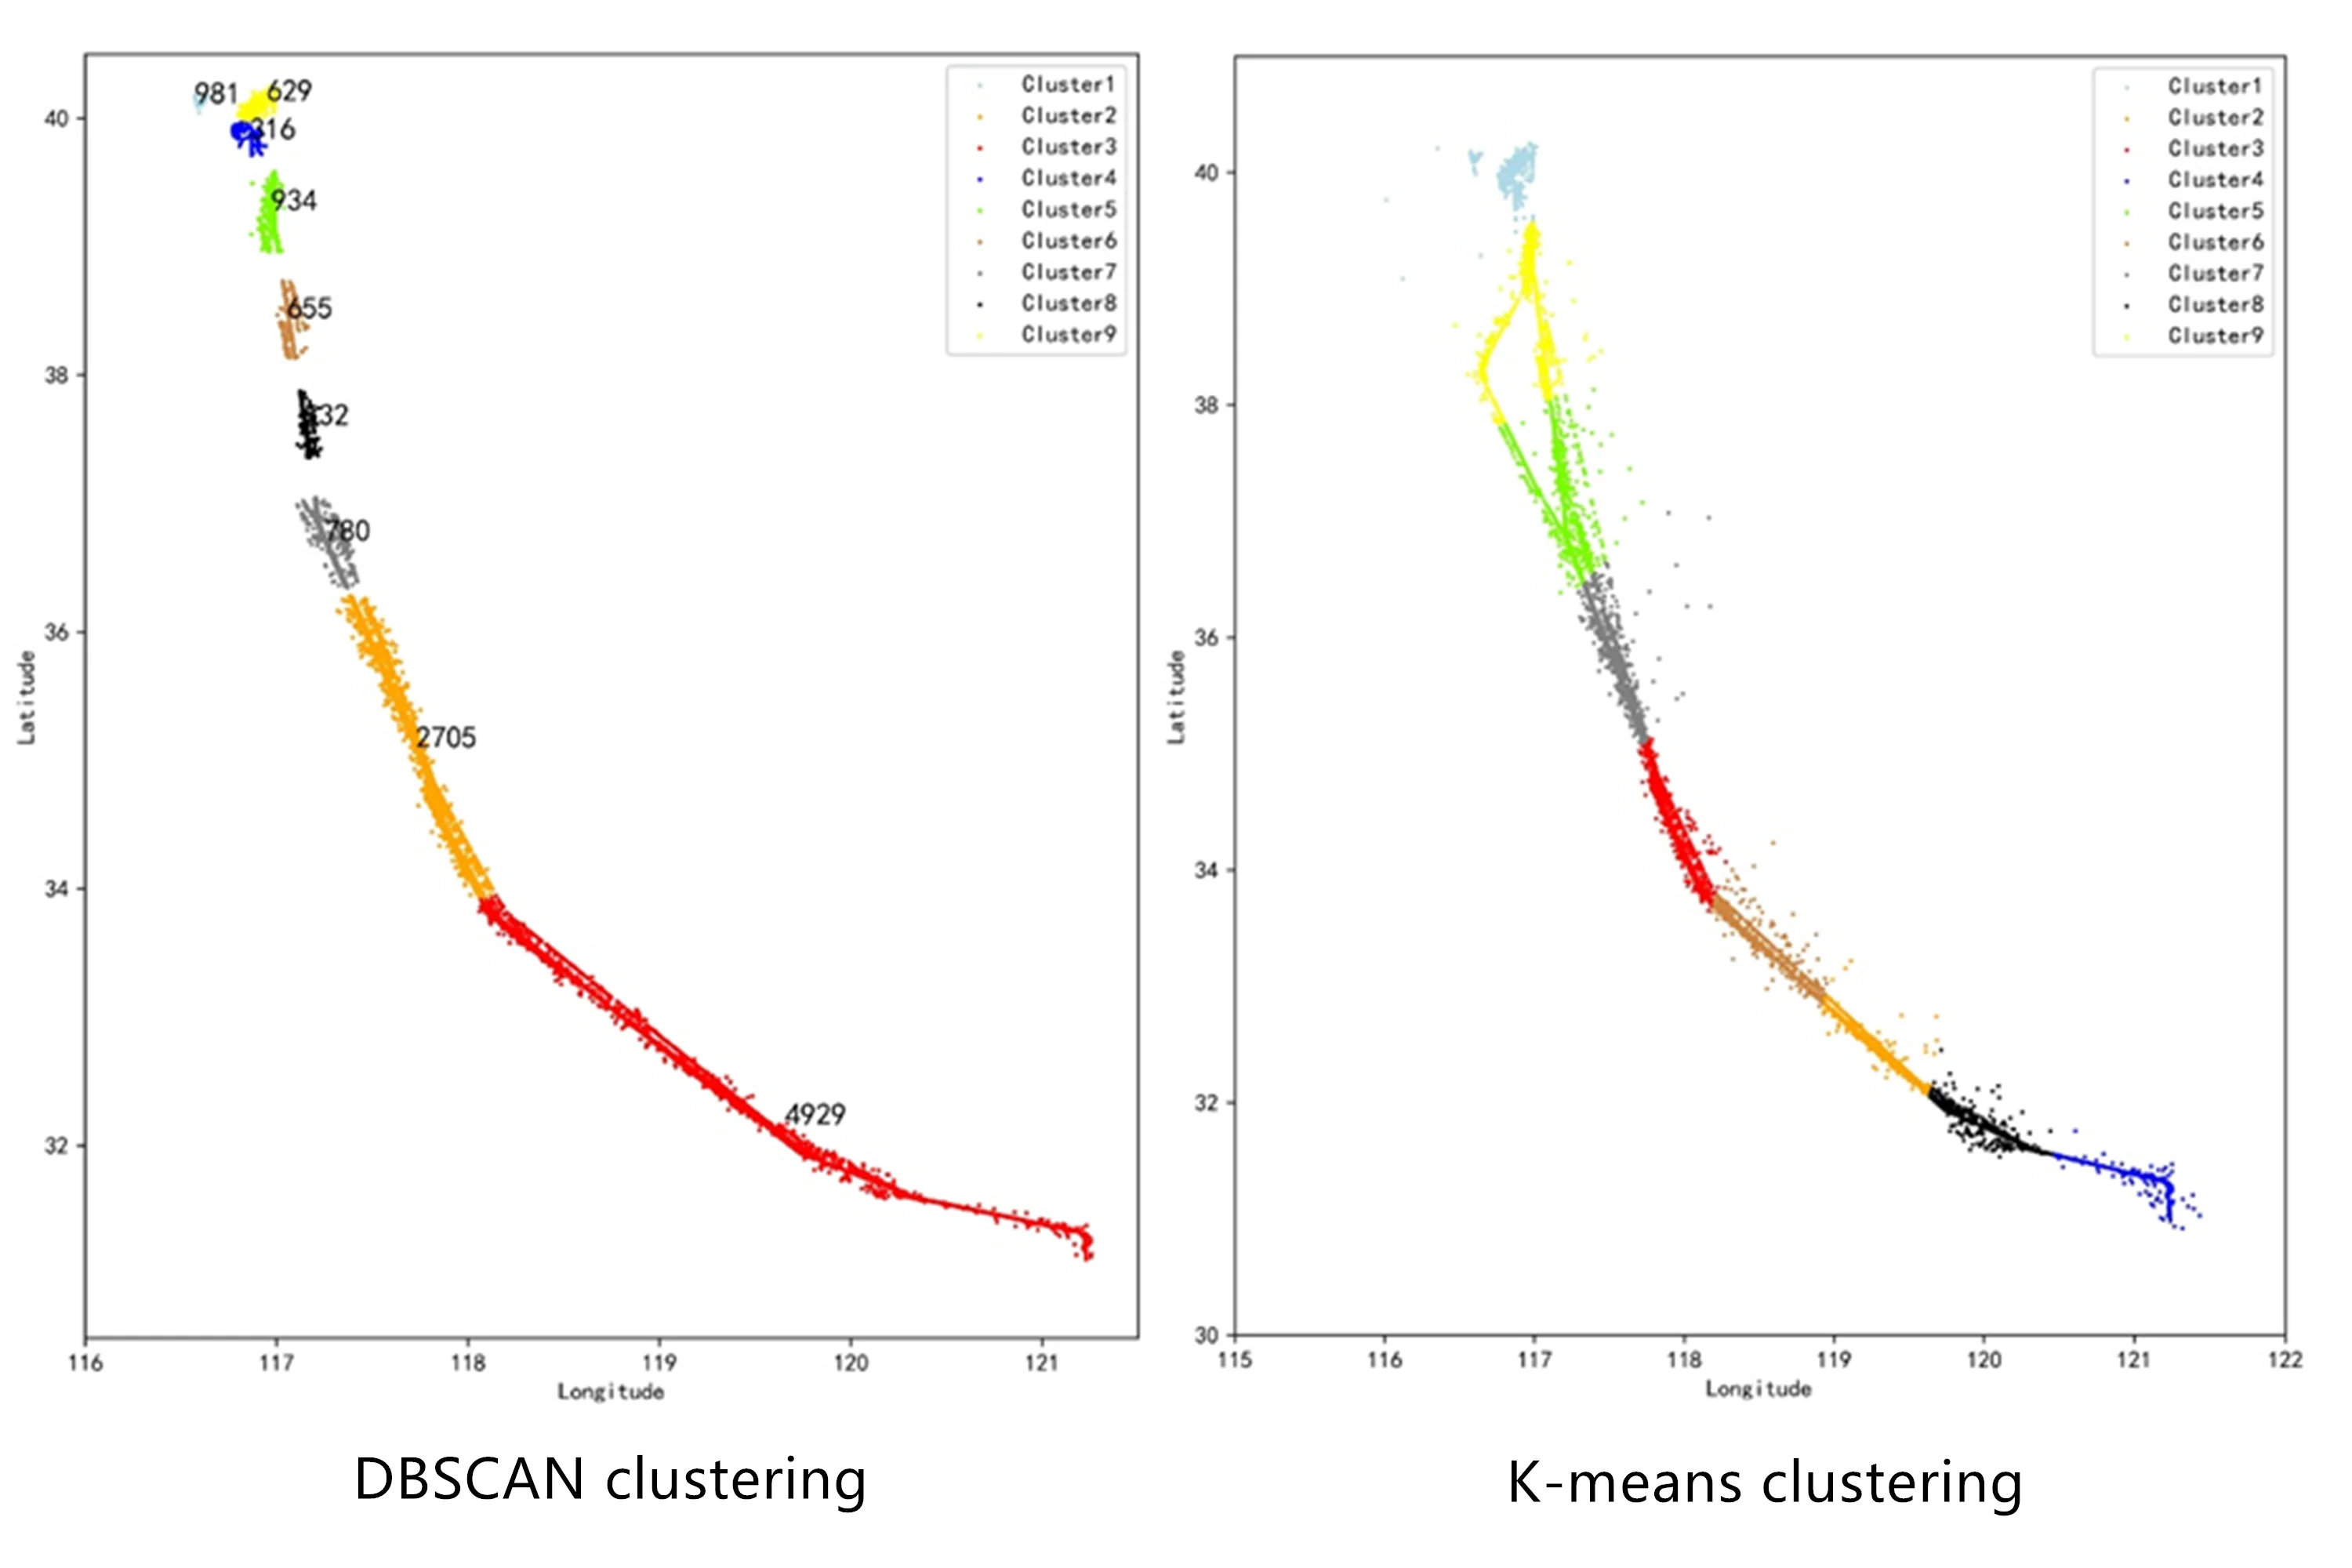
By comparison, it is found that the DBSCAN algorithm clusters according to the set scan radius and the minimum number of neighborhood points MinPts, and eliminates the noise data. As shown in Fig. 4, the trajectories are divided into 9 categories. from Beijing Capital Airport to the cruise stage, the track points are relatively scattered, and the track points are relatively dense during the cruise to landing at Shanghai Hongqiao Airport, which better reflects the different areas. Route distribution characteristics and flight operation status. When K-means clusters all trajectories into 9 categories, as shown in Fig. 3, it is a simple division of the data set based on the prototype-based concept of clusters, which is equivalent to a statistical clustering method and retains outliers data. Comparing the two algorithms, the DBSCAN algorithm can automatically identify noisy data and outliers, and can eliminate them, which can lay the foundation for subsequent work. However, the DBSCAN algorithm is more sensitive to two hyperparameters and has a greater impact on the judgment of noise data. The K-means algorithm is simple to run and needs to rely on pre-processing to improve clustering performance.
Fig. 3K-means clustering cluster
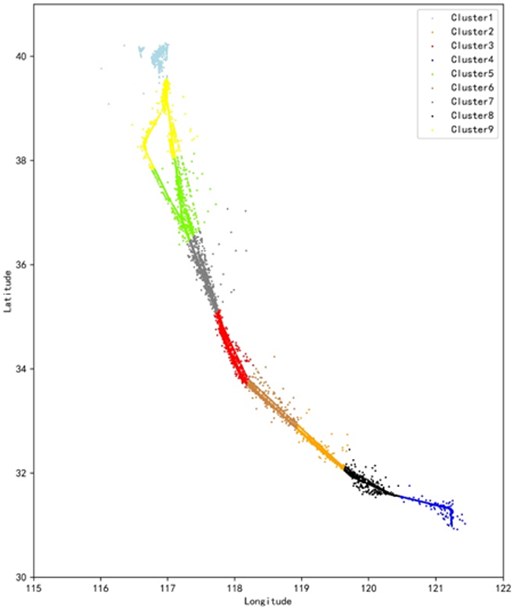
Fig. 4DBSCAN clustering cluster
4. Conclusions
Based on the temporal and spatial characteristics of the track structure, the clustering analysis of the track is mainly composed of the following parts: clustering based on aircraft discrete track points, track clustering based on partial feature similar sub-tracks and targeting Clustering of the overall track trajectory. The main research content includes abnormal data processing, outlier analysis, feature point extraction, and track correlation and track data synthesis. Among them, k-means clustering algorithm is the simplest and most commonly used algorithm, which can better achieve better clustering effect with other algorithms; DBSCAN clustering algorithm performs well in abnormal data processing and outlier analysis; Hierarchical clustering algorithm is suitable for dealing with data processing problems that are characterized by a massive increase in a large amount or a complex pattern of high changes; Fuzzy clustering algorithm is widely used in the recognition of track feature points; Grid-based algorithms can significantly improve the computational efficiency of the algorithm, and are less affected by massive data. In the follow-up research, the characteristics of different clustering algorithms can be combined and applied to their respective applicable scenarios.
References
-
Civil Aviation Administration of China. Civil Aviation Industry Development Statistical Bulletin 2019, http://www.caac.gov.cn/XXGK/XXGK/TJSJ/202006/t20200605_202977.html, (in Chinese).
-
Wu Lei, Liu Nannan, Xiao Chengdong Analysis on the application and prospect of big data in civil aviation safety management. Civil Aviation Management, Vol. 2, 2019, p. 146-148+156, (in Chinese).
-
Adric Eckstein Automated flight track taxonomy for measuring benefits from performance based navigation. Integrated Communications Navigation and Surveillance Conference, 2009.
-
Wang Jiening, Sun He, et al. Cluster analysis of approach flight tracks based on time-space. Science Technology and Engineering, Vol. 33, 2013, p. 10078-10081+10088, (in Chinese).
-
Wang Chao, Han Bangcun, Wang Fei Identification method of prevailing traffic flow in terminal area based on trajectory spectrum clustering. Journal of Southwest Jiaotong University, Vol. 49, Issue 3, 2014, p. 546-552, (in Chinese).
-
Ma Yong, Hu Minghua, Gu Xin, Yuan Ligang Flight trajectory analysis in terminal area based on spectral clustering. Aeronautical Computing Technology, Vol. 45, Issue 5, 2015, p. 46-50, (in Chinese).
-
Xu Tao, Li Yongxiang, Lu Zongping Research on track clustering based on the normal distance of track points. Systems Engineering and Electronics, Vol. 37, Issue 9, 2015, p. 2198-2204, (in Chinese).
-
Bai Hao, Zhao Kai, Wang Yue, Bo Shi Fuzzy track association algorithm based on K-center point clustering. Computer Applications, Vol. 35, Issue 1, 2015, p. 310-312, (in Chinese).
-
Zhao Yuandi, Wang Chao, Li Shanmei, Zhang Zhaoyue Reliable clustering method of terminal area flight trajectory based on resampling. Journal of Southwest Jiaotong University, Vol. 52, Issue 4, 2017, p. 817-825+834, (in Chinese).
-
Du Shi, Che Yutong, Wang Lihang, Ren Jingrui K-means track clustering based on dynamic time warping metric. Chinese Science and Technology Paper, Vol. 14, Issue 6, 2019, p. 664-669+697, (in Chinese).
-
Frank Rehm Clustering of flight tracks. AIAA infotech @ Aerospace, Atlanta, 2010.
-
Wang Chao, Xu Xiaohao, Wang Fei Applicability analysis of approach control of terminal area based on track clustering. Journal of Nanjing University of Aeronautics and Astronautics, Vol. 45, Issue 1, 2013, p. 130-139, (in Chinese).
-
Xu Tao, Chen Xuerui, Lu Zongping Trajectory representation of flight program in terminal area based on track clustering. Journal of Sichuan University (Engineering Science Edition), Vol. 48, Issue 6, 2016, p. 188-196, (in Chinese).
-
Zhang Yong, Zhang Jianwei, Han Yunxiang an improved track clustering method. Modern Computer, Vol. 18, 2020, p. 11-18, (in Chinese).
-
Cong Rong, Wang Xiukun, Li Jinjun, et al. Track correlation algorithm based on hierarchical and density clustering analysis. Journal of System Simulation, Vol. 17, Issue 4, 2005, p. 841-843, (in Chinese).
-
Lee J.-G., Han J., et al. Trajectory clustering: a partition-and-group framework. Proceedings 2007 ACM SIGMOD International Conference on Management of Data, 2007.
-
Yuan Guan, Xia Shixiong, Zhang Lei, Zhou Yong Trajectory clustering algorithm based on structural similarity. Journal of Communications, Vol. 32, Issue 9, 2011, p. 103-110, (in Chinese).
-
Maxime Gariel, Ashok Srivastava N., Feron Eric Trajectory clustering and an application to airspace monitoring. IEEE Transactions on Intelligent Transportation Systems, Vol. 12, Issue 4, 2011, p. 1511-1524.
-
Aude Marzuoli, Popescu Vlad, Feron Eric Two perspectives on graph-based traffic flow management. First SESAR Innovation Days, 2011.
-
Zhao Enlai, Hao Wenning, Zhao Fei, Chen Gang, Shao Xiaosha Sha Improved density-based track clustering algorithm. Computer Engineering, Vol. 37, Issue 9, 2011, p. 270-272, (in Chinese).
-
Kenneth Leiden, Stephen Atkins Trajectory clustering for metroplex operations. Proceedings of 11th AIAA Aviation Technology, Integration, and Operations (ATIO) Conference, 2011.
-
Eerland W. J. Trajectory Clustering, modeling and selection with the focus on airspace protection. AIAA Scitech, 2016.
-
Wang Chao, Wang Mingming, Wang Fei Research on track clustering method based on improved fuzzy C-Means. Journal of Civil Aviation University of China, Vol. 31, Issue 3, 2013, p. 14-18, (in Chinese).
-
Wang Taobo, Huang Baojun Application of improved fuzzy clustering algorithm in track analysis. Chinese Journal of Safety Science, Vol. 24, Issue 2, 2014, p. 23-27, (in Chinese).
About this article

This research is supported by CAAC North China Regional Administration Science and Technology Project, (No. 201904; 202002); 2020 Civil Aviation Safety Ability Building Funding Project: Research and Application on Air Traffic Operation Management Analysis Technologies Based on Multi-Source Big Data.
