Abstract
Compared with the design of traditional fuel vehicles, the design of electric vehicles has its uniqueness, consisting mainly in that the body design must be able to adapt to the new power system and its layout. Power battery pack is an important factor affecting the body design of electric vehicles. In order to study the modeling of power battery packs and its impact on body performance, it was proposed to use the finite element method for modeling the power battery pack and analyzing its influence on the performance of the body-in-white. Based on a certain electric vehicle, the basic body-in-white model and the body-in-white model with the mass point addition and the refined model of the power battery pack were established, the static stiffness of the body-in-white simulation results of different models were compared and analyzed, and finally the effectiveness of the simulation model was verified through bench tests. Based on this effective model, the influence of the power battery pack on the modal and strength of the body-in-white was analyzed. The results show that the established refined model of the power battery pack has higher computational accuracy. Besides, the power battery pack can significantly increase the static stiffness of the electric vehicle body-in-white, effectively optimize the first-order torsion frequency and the first-order front cabin yaw frequency of the body-in-white, reduce the first-order bending frequency of the body-in-white, and greatly increase the risk of static strength failure of the body-in-white. In the setting of body performance goals and structural development, the influence of the power battery pack cannot be ignored.
Highlights
- A method for calculating the static stiffness of the vehicle body is proposed. This calculation method uses the linear interpolation method to calculate the displacement of the projection point of the constraint points of the car body in the simplified rectangular frame plane, and then to calculate the static stiffness of the car body.
- In order to study the impact of the power battery pack on the vehicle body's performance, an analysis process and method for modeling the power battery pack are proposed. Using a certain electric vehicle as an example, the simulation results of the static stiffness of different biw models, including the power battery pack, are obtained and verified by bench tests.
- The free mode and static strength of biw w/ and w/o power battery pack are studied based on the verified model, and the influence of power battery pack on the free mode and static strength of biw is obtained.
1. Introduction
Body-in-white refers to a body that has been assembled and welded but not yet painted, mainly consisting of the front end, rear end, side wall, and floor, and plays a crucial role in the development process of automobiles. The static stiffness, modal, and strength of the body-in-white are important performance indicators for automobiles, which have a significant impact on their safety, handling stability, comfort, and NVH performance. Among them, the static stiffness of the body-in-white mainly includes the bending stiffness and torsional stiffness of the white body, which reflects the body ability to resist deformation when subjected to bending and torsional loads. The body-in-white mode is an inherent attribute of the vehicle body, and its lower order elastic mode reflects the vibration characteristics of the vehicle body. The strength of the body-in-white refers to the body ability to resist external forces, which are closely related to the car safety. They are very important parameters in setting vehicle performance targets and developing vehicle structures [1-3].
In recent years, scholars have conducted a series of studies on the performance of traditional fuel-powered vehicle bodies. Xiaoxia Wen et al. [4] analyzed the basic performance of the vehicle body, identified the risk areas of the vehicle body, and improved the vehicle body characteristics through effective measures. Wang Kefei et al. [5] studied the static stiffness characteristics of vehicle body under fully constrained, over-constrained, and ideal constraint conditions, and verified them through finite element simulation and test; Zhuang Hongjie et al. [6] and Meng Y. et al. [7] proposed the body stiffness chain model and the square box model respectively, which were successfully applied to improve the vehicle performance; Yao W. et al. [7] improved the bending torsional stiffness of the vehicle body by parameterizing the body beam structure and using the gray-fuzzy-Taguchi method. The above research method is mainly used for traditional fuel-powered vehicle body, while for the electric vehicle body, this research method cannot be fully applicable.
Compared to the fuel-powered vehicle body, the electric vehicle body has its own uniqueness, which is mainly reflected in their ability to adapt to a new power system and its out shape. Related studies demonstrated that the power battery pack of electric vehicles had a significant impact on the vehicle collision safety, vibration and noise reduction [10-11]. It can be seen that the power battery pack is an important influencing factor that cannot be ignored in the design of electric vehicle body. To this end, Chen X. [12] et al. adopted the body performance-driven concept and proposed a design method for the electric vehicle body structure based on the battery arrangement, and conducted a test verification on this. Christensen J. et al. [13] used the topology optimization technology to propose a hybrid electric vehicle body structure design method based on crash safety. This research has achieved good results and is a useful exploration for body design considering the impact of power battery packs. However, most of these studies tend to focus on the collision safety and vibration performance of electric vehicle bodies, while neglecting the static stiffness, modal, and strength characteristics of the electric vehicle body.
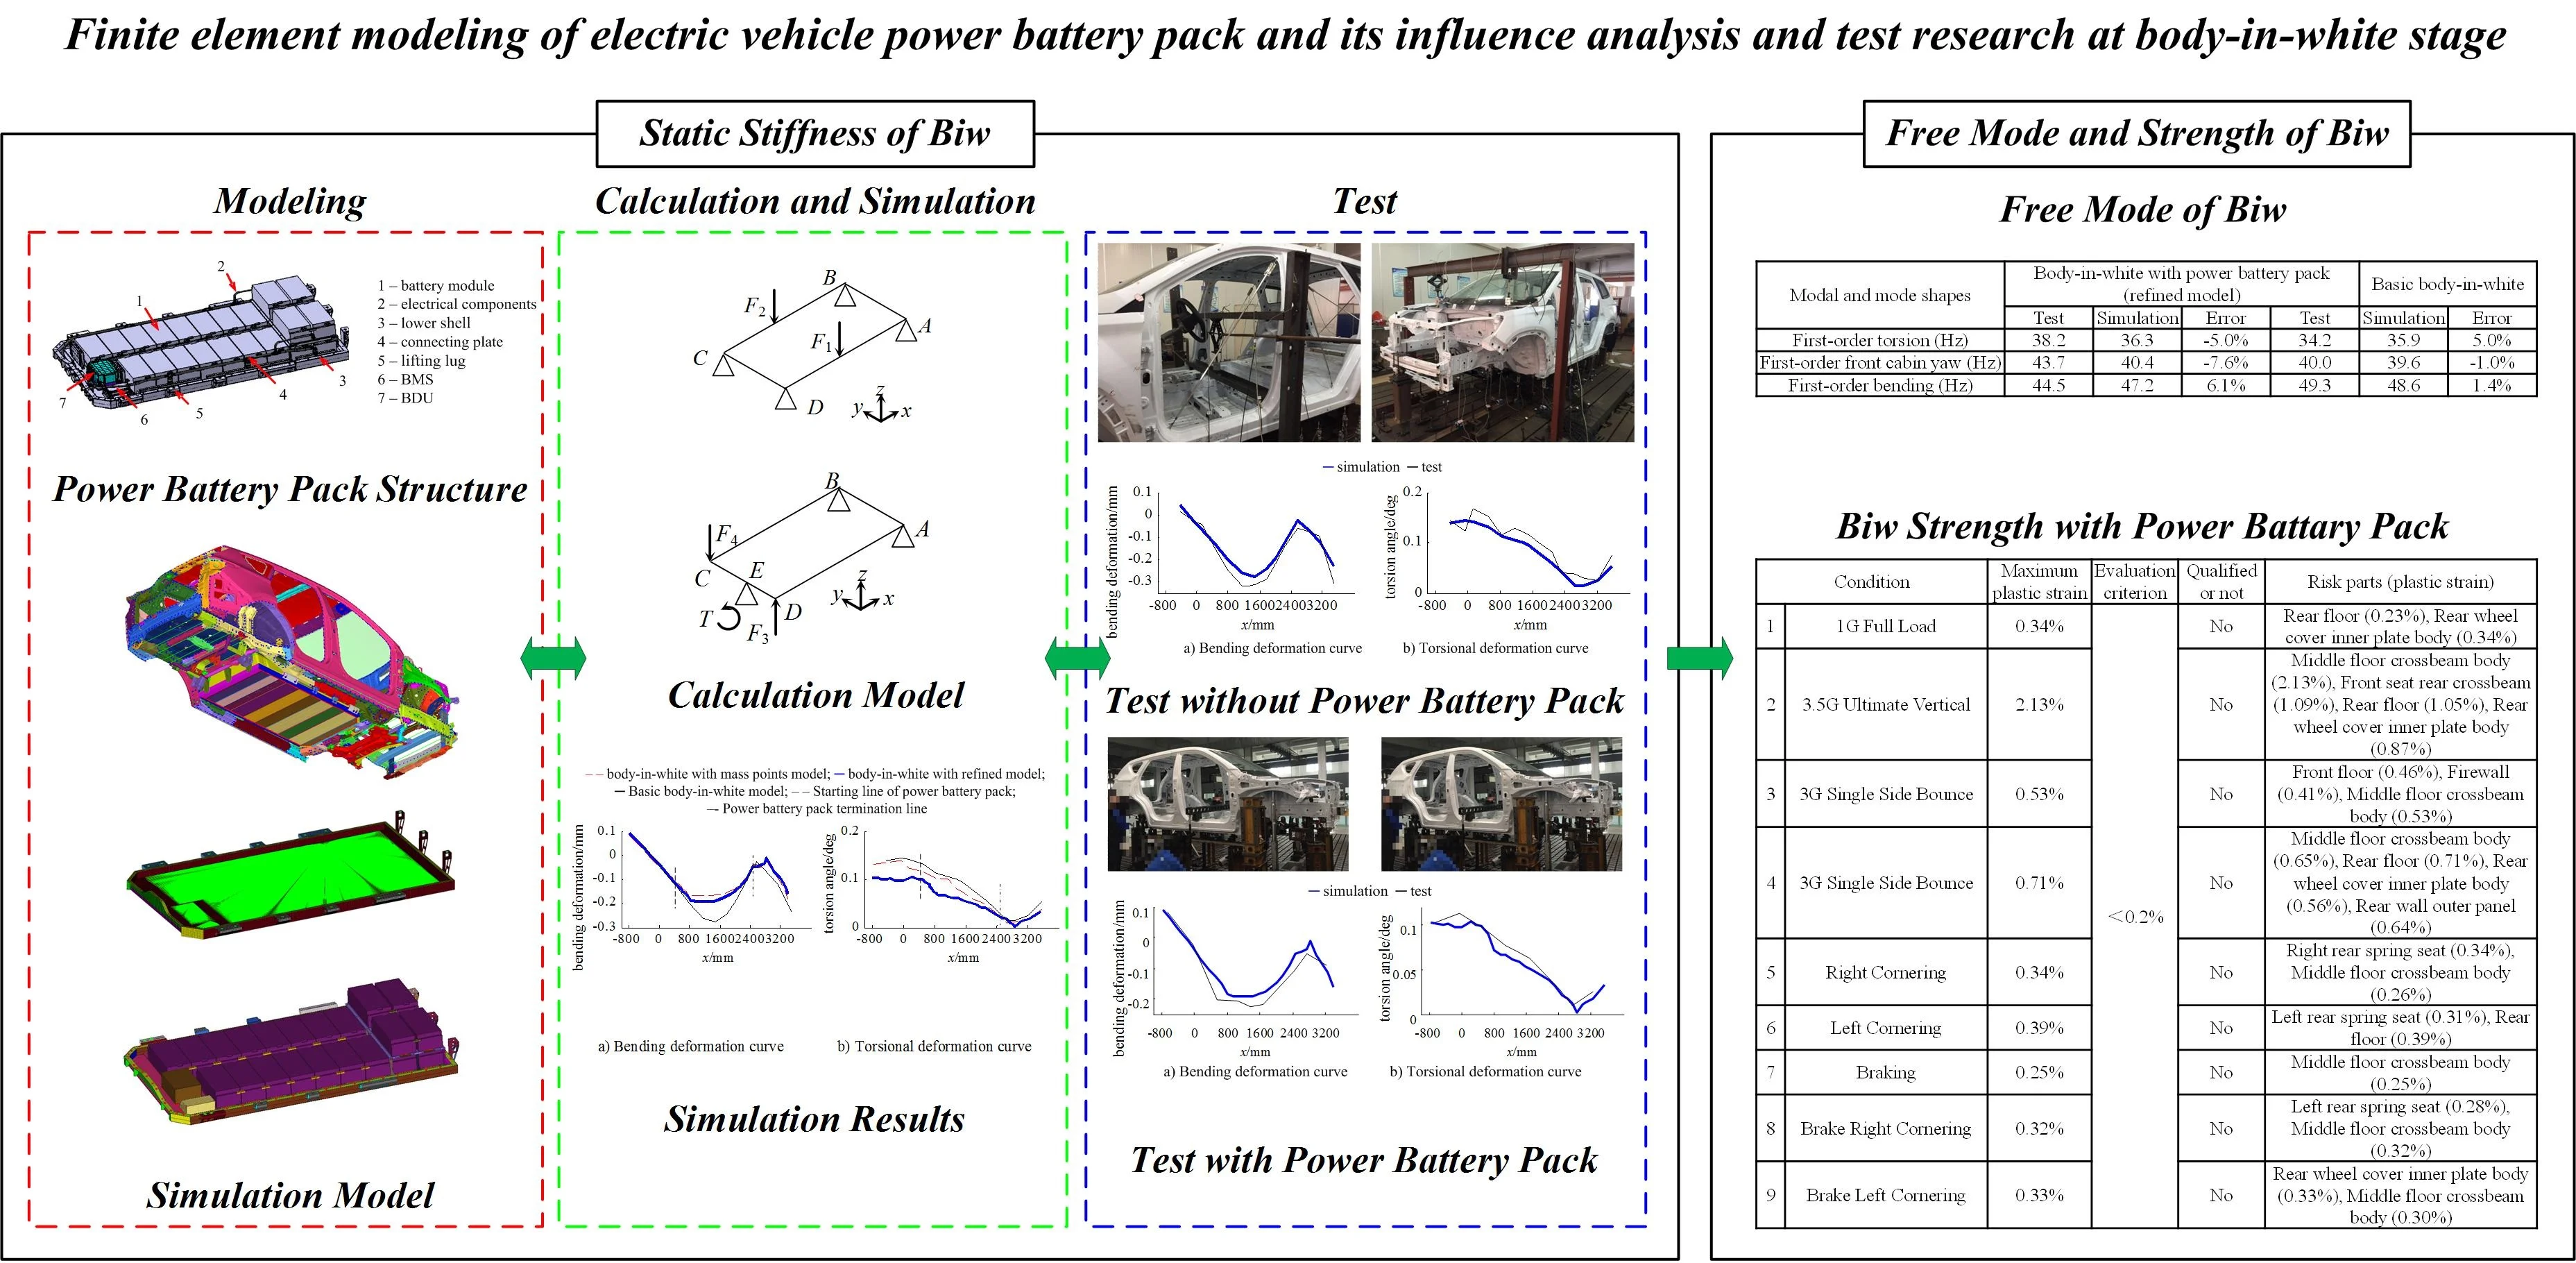
In order to study the static stiffness, modal and strength characteristics of electric vehicle body and improve the design level of electric vehicle body, it is necessary to study the power battery pack and its impact on the static stiffness, modal and strength of the body. This article proposes a procedure for modeling the power battery pack and analyzing its impact on the static stiffness, modal, and strength of the body-in-white. The analysis technology roadmap is shown in Fig. 1. Taking a certain electric vehicle as the research object, the three-dimensional detailed geometric modeling of the power battery pack was first established using Catia software, and then the mass point model and refined model of the power battery pack were established using OptiStruct software; Secondly, based on the finite element model of the basic body-in-white, a static stiffness simulation model of the electric vehicle body-in-white was established, and the simulation model was downloaded into a solver for calculation. The simulation results were analyzed and verified through tests; Finally, based on the validated model, OptiStruct software and Abaqus software were used to establish modal and strength simulation models for the body-in-white, solve the simulation model, and analyze the calculation results. This research method can guide the development of power battery packs and vehicle body design and optimization, avoiding blindness in the early stages of development.
2. Calculation of static stiffness of body-in-white
Body-in-white is actually a complex spatial structure. In engineering, it is often simplified as a rectangular frame structure, and the static stiffness of body-in-white is reflected by studying the stiffness of the rectangular frame. Fig. 2 shows this simplified rectangular frame structure of body-in-white under bending conditions. In the figure, points A and B, C and D are the projection points of the rear spring seat constraint point and the front suspension mounting hole constraint point in the plane of the rectangular frame, respectively, and forces and are the vertical downward forces applied to the left and right sides of the rectangular frame.
Bending stiffness is defined as the ratio of load to displacement towards the load application:
where: is the total load;, are the maximum -direction displacements of left and right frames;, , , are the displacements of points A, B, C and D projected on the longitudinal beam; is distance between the maximum position of frame displacement and the front end of the frame; , are distances between points A and D, B and C.
Fig. 1Technical roadmap of modeling of power battery pack and its influence analysis and test on static stiffness, modal, strength of body-in-white (biw)
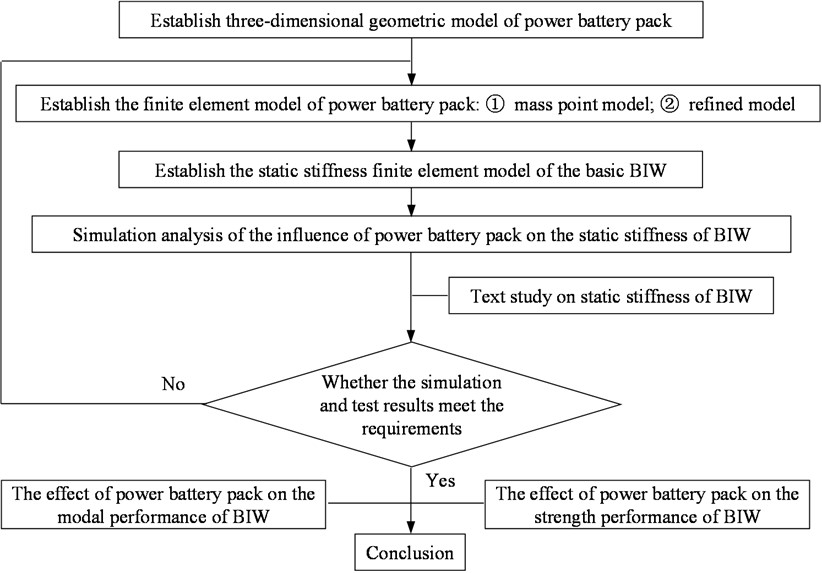
Fig. 2Schematic diagram of simplified rectangular frame structure of body-in-white under bending condition
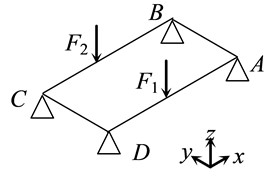
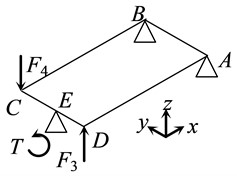
Fig. 3 is the simplified rectangular frame structure diagram of body-in-white under torsion condition. Where: point E is the central constraint point of the front suspension, and and are the forces acting in opposite directions and applied to the transverse plane of the front suspension mounting hole.
Bending stiffness is defined as the ratio of torsional load to relative torque angle:
where: is the torsional load; , are the distances between points A and B, C and D.
Fig. 3Schematic diagram of simplified rectangular frame structure of body-in-white under torsion condition
3. Finite element modeling of power battery pack
3.1. Power battery package structure
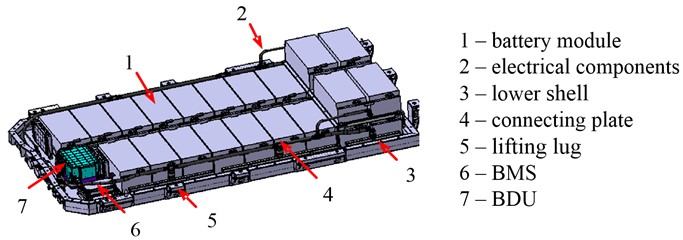
The electric vehicle to be studied uses a lithium iron phosphate power battery pack as the power source. The power battery pack is mainly composed of a shell, battery module components, electrical components, battery management system (BMS), battery system distribution box (BDU), lifting lug, inner frame and connecting plate. The battery modules are arranged horizontally in layers. The lower battery modules are connected with the lower shell through bolts, the upper module is connected with the lower shell through the inner frame, the inner frame is connected with the lower shell through spot welding, bolts, etc., and the battery modules are fixed by connecting plates; BMS and BDU are connected with the lower shell through bolts; The upper and lower shells are fixed by bolts. The structure model of power battery package established by CAD software CATIA (Computer Aided Three-Dimensional Interactive Application) is shown in Fig. 4.
Fig. 4Structural model of power battery pack (upper shell (No. 8) and internal frame (No. 9) are hidden)
3.2. Finite element model of power battery pack
The power battery pack is a complex system with mechanical-electrical-thermal coupling. In the research, it was considered that the stiffness characteristics of the vehicle body are mainly related to the mechanical part of the power battery pack, while the electrical and thermal parts are ignored. There are currently two main modeling methods for finite element modeling of power battery packs: mass point modeling and refined [14-18]. The mass point model does not consider the specific structure of components such as battery modules, electrical components, BMS, BDU, etc. It is simplified as a centralized mass unit at the center of mass and coupled to the installation position. However, the refined model considers the specific structure of each component of the power battery pack and requires detailed modeling. The following will establish the finite element models of the two power battery packs mentioned above, with the main component modeling parameters detailed in Table 1.
Table 1Modeling parameters of main components of power battery pack
Part No. | Material | Elastic modulus / MPa | Density / (kg/m3) | Poisson’s ratio | Yield strength / MPa | Type of finite element | Thickness of finite element / mm | Quality / kg | Barycentric coordinate / mm |
1 | AL6061-T6 | 6.9×10⁴ | 2.7×10³ | 0.33 | 245 | hex8 (CHEXA) | – | 381.9 | (1842.61, 6.62, –170.01) |
2 | – | – | – | – | – | mass (CONM2) | – | 3.2 | (1857.40, –0.2, –213.81) |
3 | AL6061-T6 | 6.9×10⁴ | 2.7×10³ | 0.33 | 245 | hex8 (CHEXA) | – | 15.2 | (1661.61, 0.96, –251.87) |
4 | AL6061-T6 | 6.9×10⁴ | 2.7×10³ | 0.33 | 245 | quad4 (CQUAD4) and tria3 (CTRIA3) | 1.5 | 1.1 | (1801.05, 8.65, –141.62) |
5 | AL6061-T6 | 6.9×10⁴ | 2.7×10³ | 0.33 | 245 | tetra4 (CTETRA) | – | 1.0 | (1760.27, –0.68, –216.04) |
6 | – | 6.9×10⁴ | 1.05×10³ | 0.33 | – | hex8 (CHEXA) | – | 1.7 | (927.92, –390.62, –186.47) |
7 | – | 6.9×10⁴ | 1.05×10³ | 0.33 | – | hex8 (CHEXA) | – | 5.2 | (930.85, –155.27, –190.13) |
8 | SMC | 8.0×10³ | 1.78×10³ | 0.32 | 170 | quad4 (CQUAD4) and tria3 (CTRIA3) | 3 | 6.7 | (1600.59, 0, –112.67) |
9 | AL6061-T6 | 6.9×10⁴ | 2.7×10³ | 0.33 | 245 | hex8 (CHEXA) | – | 2.7 | (1809.06, 2.47, –158.73) |
Mass point modeling: During modeling, a power battery pack structure model is imported into the OptiStruct interface module in Hypermesh, with a mesh size of 8 mm and a mesh quality that meets the quality requirements [5]. Among them, the minimum edge size 2 mm, aspect ratio 5, skew 40°, warpage 15°, triangle element angle [45°, 135°], and quadrilateral element angle [30°, 120°]. The shell and lifting lug of the power battery pack are modeled using shell elements and tetrahedral elements respectively. The battery module components, electrical components, BMS, BDU, and connectors are modeled using centralized mass units, which are located at the centroid of each component and are coupled and connected to each installation position through Rbe3 units. The mass point model of the power battery pack is discretized into 166412 units and 166827 nodes, with shell elements accounting for approximately 92.3 % of all grid elements. In the simulation of connection methods, Cbeam units are used for bolt connections, Adhesives units are used for adhesive connections, and Acm and Rbe2 units are used for spot welding and seam welding connections. The established mass point model of the power battery pack is shown in Fig. 5(a).
Refined modeling: Necessary simplification is required during modeling: 1) Electrical components are allocated to each installation point using non-structural mass units; 2) The single battery is ignored, and the single module is simulated as an entity; 3) Without considering the specific internal structure of BMS and BDU, and the solid unit is used for modeling. The battery module, BMS, BDU, lifting lug and other entities are simulated by hexahedron elements, and the upper and lower shells, inner frames, connecting plates and other thin-walled parts are simulated by shell elements. The upper shell is simulated with SMC material, and other parts are simulated with AL6061 aluminum material (among which, the elastic modulus and Poisson’s ratio of AL6061 aluminum material are used for BMS and BDU, and the density is proportioned according to the mass). The final refined model of the power battery pack is discretized into 543061 units and 590532 nodes, of which only 358985 physical units and 475788 nodes are considered. The established refined model of the power battery pack is shown in Fig. 5(b).
Fig. 5Finite element model of power battery pack (upper shell is hidden)
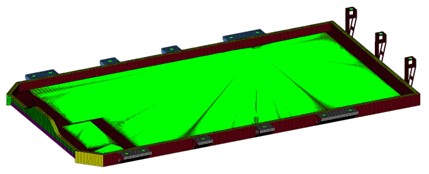
a) Mass point model
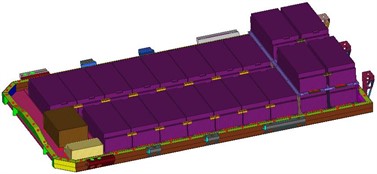
b) Refined model
4. Body-in-white simulation analysis for static stiffness
4.1. Body-in-white simulation model
The body-in-white of electric vehicle (hereinafter referred to as the basic body-in-white) adopts a load-bearing body, with the front end, rear end, side walls, and floor mainly composed of thin-walled sheet metal parts. When modeling the basic body-in-white, thin-walled sheet metal parts are modeled using shell elements [19]. For the calculation efficiency, the element size is basically set at 8×8 mm, the number of quadrilateral units accounts for more than 90 %. The basic body-in-white is assembled by welding, bolt connections and adhesive connections. Acm (welding model), rigid Element (rigid beam element model), bar Element (deformable beam element model) and area (adhesive element model) are used for simulation respectively. Elastic modulus and density of elements in material properties , Poisson’s ratio defined according to mild steel parameters. The electric vehicle power battery pack is installed on the brackets of the basic body-in-white longitudinal beam and rear crossbeam and fixed with 14 bolts M18×120 mm. Among them, there are 6 bolts at the left and right longitudinal beam brackets and 2 bolts at the rear crossbeam. When modeling, considering that the bolt not only provides for a bending moment but also a torque, the hexahedral element is used to simulate the bolt. The upper and lower ends of the bolt are connected to the body-in-white bracket and the power battery pack lifting lug through the Rbe3 element. By assembling the two power battery pack models established earlier with the basic body-in-white model, the body-in-white static stiffness simulation model containing the power battery pack mass point model and the body-in-white static stiffness simulation model containing the power battery pack refined model can be obtained. The static stiffness simulation model of the body-in-white is shown in Fig. 6.
4.2. Simulation calculation and result analysis
At present, the body stiffness calculation and test methods have not been unified still in the automobile industry, and most automobile factories have their own enterprise standards. In this paper, the static stiffness of body-in-white is simulated according to the standard of an automobile enterprise. According to this enterprise standard, the loading method of the bending stiffness test is to symmetrically apply the vertical load 1500 N at the intersection of the sill beam and the body B-pillar. Meanwhile the loading method of the torsion stiffness test is to apply the torque 2000 N·m in the counterclockwise direction on the front suspension spring seat.
Considering the influence of boundary constraint conditions on the static stiffness of the body-in-white, the body-in-white is approximated to form a “two-way simply supported beam” structure in the longitudinal and transverse directions. The constraint method of bending stiffness is to constrain the translational freedom of the front suspension spring seat center and the translational freedom of the rear suspension spring seat center. The constraint method of torsional stiffness is to constrain the translational freedom of the front anti-collision beam center and the translational freedom of the rear suspension spring seat. The loading and restraint diagrams for bending stiffness test and torsion stiffness test of body-in-white are shown in Fig. 7.
Fig. 6Simulation model of static stiffness of body-in-white (including refined model of power battery pack)
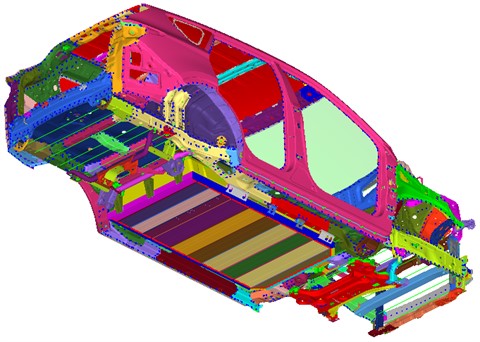
Fig. 7Schematic diagram of bending stiffness test and torsional stiffness test loading and restraint of body-in-white
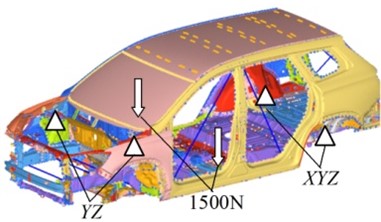
a) Bending stiffness test
b) Torsional stiffness test
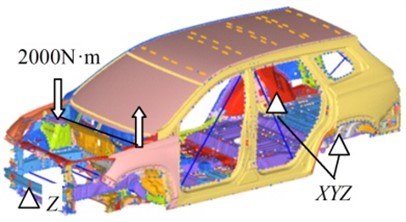
The above-mentioned three simulation models were downloaded into the OptiStruct solver for calculation, and the calculation results were analyzed in the post-processing software HyperView. Then the -direction deformation of the bottom center of the left and right stringers is extracted from the three simulation models, and the bending deformation curve and torsion deformation curve of the body-in-white stringers is drawn along the -axis direction, as shown in Fig. 8. It can be seen that the bending deformation curve of the body-in-white longitudinal beam is approximately of M type, and the torsion deformation curve is approximately of S type. The bending deformation curve is quite different in the section where the power battery pack is installed on the body, and the torsion deformation curve is quite different in the front body with the power battery pack. Among them, the maximum bending displacement of the body-in-white longitudinal beam with mass point model is –0.182 mm, and the maximum torsion angle is 0.139°; The maximum bending displacement of the body-in-white longitudinal beam with the refined model is –0.195 mm, and the maximum torsion angle is 0.106°; The maximum bending displacement of the body-in-white longitudinal beam without the power battery pack model is –0.279 mm, and the maximum torsion angle is 0.143°. The simulation results show that body deformation is small and within a reasonable range.
According to the Eqs. (1-2) for calculating the static stiffness of body-in-white, the static stiffness of body-in-white is calculated, as shown in Table 2. It can be seen from Table 2 that the bending stiffnesses of the basic body-in-white, the body-in-white with the power battery pack mass point model and with the refined model are 13208 N/mm, 20748 N/mm and 20491 N/mm respectively. It can be seen from the comparison that the contribution of the mass point model and the refined model to the bending stiffness of the basic body-in-white are 7540 N/mm and 7283 N/mm, respectively, that is equal to 57.09 % and 55.14 %. This shows that the power battery pack significantly improves the bending stiffness of the body-in-white, and the contributions and increase of the mass point model and the refined model to the bending stiffness of the body-in-white are basically the same. The simulation results of the two models used for the bending stiffness of the body-in-white are equivalent.
Fig. 8Bending deformation and torsional deformation curve of body-in-white longitudinal beam
The torsional stiffnesses of the basic body-in-white, mass point model with power battery pack and refined model are 15711 N·m/°, 16192 N·m/° and 18826 N·m/° respectively. The contributions of the mass point model and the refined model to the torsional stiffness of the basic body-in-white are 481 N·m/° and 3115N·m/°, respectively, with corresponding increases of 3.06 % and 19.83 %. This shows that the refined model of the power battery pack can greatly improve the torsional stiffness of the body-in-white, while the mass point model is not an obvious indicator for improving the torsional stiffness of the body-in-white.
Table 2Simulation results of static stiffness of body-in-white for three finite element models
Static stiffness | Simulation results | ||||
Basic body-in-white model | body-in-white with mass points model | Amplification | body-in-white with refined model | Amplification | |
Bending stiffness (N/mm) | 13208 | 20748 | 57.09 % | 20491 | 55.14% |
Torsional stiffness (N·m/°) | 15711 | 16192 | 3.06 % | 18826 | 19.83% |
5. Static stiffness test of body-in-white
In order to verify the accuracy of the above finite element simulation results, the static stiffness of the body-in-white is tested in two steps. The first step is to test the static stiffness to verify the accuracy of the relevant simulation results of the basic body-in-white; The second step is to test the static stiffness of the body-in-white with the power battery pack to verify the accuracy of the relevant simulation results.
5.1. Static stiffness test of basic body-in-white
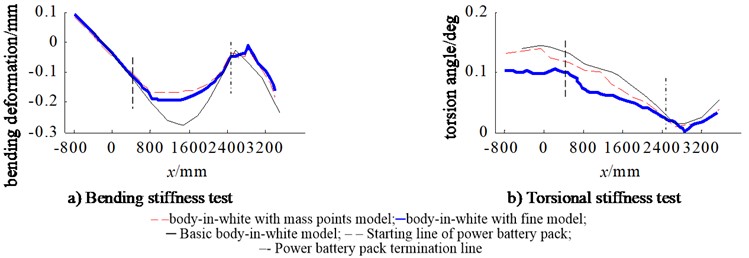
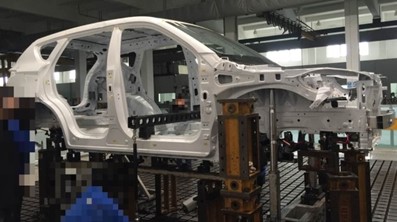
The basic body-in-white static stiffness test bench is shown in Fig. 9. The test equipment is mainly composed of test bench, loading system, constraint system and data acquisition system. The loading and constraint conditions during the test are as described in section 4.2. The loading shall be carried out step-by-step to eliminate the influence of fixture interference, welding gap and other negative factors; The adjustable restraint devices in , and directions are used for restraint to eliminate the influence of restraint on the static stiffness of body-in-white [20]. The displacement measuring points are symmetrically arranged on the lower surface of the longitudinal beam and the sill beam. There are 15 measuring points on one side, including 10 measuring points at the longitudinal beam and 5 measuring points at the sill beam. The distance between each adjacent measuring point is 200-300 mm. After the test load is added near the specified load and stabilized, the readings of the measuring points under the corresponding load are recorded. This test is repeated five times, and the consistency of each group of measuring data is checked to control the variance within a reasonable range. Then the displacement data of each measuring point are averaged, the deformation curve of the body-in-white longitudinal beam is drawn, and it is compared with the finite element simulation results, as shown in Fig. 10. It can be seen from Fig. 10 that the bending deformation and torsion deformation simulation of the longitudinal beam of the basic body-in-white are basically consistent with the real test results. Although the torsion deformation test curve has some non-uniformity, the overall trend is consistent with the simulation.
Fig. 9Basic body-in-white static stiffness test bench
a) Bending stiffness test of basic body-in-white
b) Torsional stiffness test of basic body-in-white
Fig. 10Bending and torsional deformation curve of basic body-in-white longitudinal beam
According to the formula for calculating the static stiffness of body-in-white, the bending stiffnesses and torsional stiffnesses of the basic body-in-white test are obtained, as shown in Table 3. It can be seen from Table 3 that the bending stiffness test value of the basic body-in-white is 14314 N/mm, and the relative error in the bending stiffness value obtained by finite element simulation is only –7.73 %. The torsional stiffness test value of the basic body-in-white is 14688 N·m/°, and the relative error with the torsional stiffness value obtained by finite element simulation is only 6.97 %. Compared with the test results, the error of the bending stiffness and torsional stiffness simulation results of the basic body-in-white is within ±8 %, so the finite element analysis of the static stiffness of the basic body-in-white can be considered as credible.
Table 3Comparison of static stiffness simulation and test results of basic body-in-white
Static stiffness | Simulation results | Test results | Error |
Bending stiffness (N/mm) | 13208 | 14314 | –7.73 % |
Torsional stiffness (N·m/°) | 15711 | 14688 | 6.97 % |
5.2. Static stiffness test of body-in-white with power battery pack
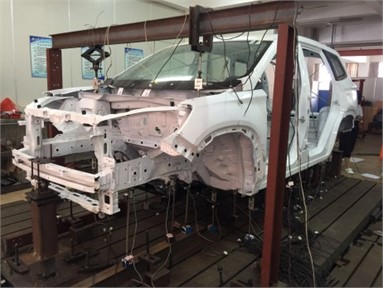
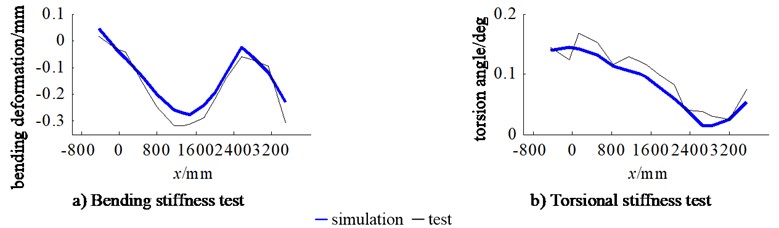
The power battery package is equipped with the basic body-in-white, and the static stiffness of the body-in-white is tested on the bench. The body-in-white static stiffness test bench with power battery pack is shown in Fig. 11. The test equipment, loading method, constraint conditions, measuring point arrangement and data processing methods are all described in Section 5.1. So, the displacement data of each measuring point are also averaged, the deformation curve of the body-in-white longitudinal beam is drawn, and it is compared with the finite element simulation results, as shown in Fig. 12. It can be seen from the figure that the simulation and test results of bending deformation and torsion deformation of body-in-white longitudinal beam with power battery pack are consistent.
Fig. 11Bending and torsional stiffness test of body-in-white with power battery pack
a) Bending stiffness test of body-in-white
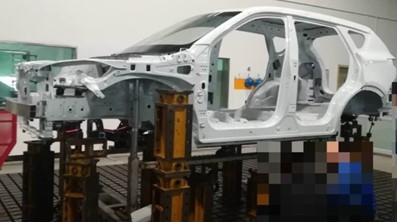
b) Torsional stiffness test of body-in-white
Fig. 12Bending and torsional deformation curve of body-in-white longitudinal beam with power battery pack
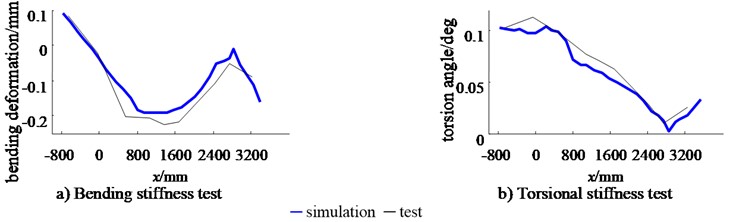
According to the formula for calculating the static stiffness of the body-in-white, the bending stiffness and torsional stiffness of the body-in-white test with the power battery pack are obtained, as shown in Table 4. It can be seen from Table 4 that the bending stiffness test value of the body-in-white with power battery pack is 19229 N/mm, and the relative error between the bending stiffness value obtained by finite element simulation is only 6.56 %; The torsion stiffness test value is 14688N·m/°, and the relative error between the torsion stiffness value obtained by finite element simulation is only –3.30 %. Compared with the test results, the error of bending stiffness and torsional stiffness simulation results of body-in-white with power battery pack is within ±7 %, so it can be considered that the finite element analysis of static stiffness of body-in-white with power battery pack is reliable.
According to the above analysis, the static stiffness of the basic body-in-white is compared with that of the body-in-white with power battery pack, as shown in Table 5. It can be seen from Table 5 that the power battery pack can significantly improve the static stiffness of the body-in-white, and its increase in bending stiffness and torsional stiffness can reach 34.34 % and 32.54 %; When the mass point model of the power battery pack is used to simulate the static stiffness of the body-in-white, the error is within –17 %-17 %, and the calculation accuracy cannot meet the requirements. When the precision model is used, the error is within –7 %-7 %, and the ideal effect can be achieved.
Table 4Comparison of static stiffness simulation and test results of body-in-white with power battery pack
Static stiffness | Simulation results | Test results | Error |
Bending stiffness (N/mm) | 20491 | 19229 | 6.56 % |
Torsional stiffness (N·m/°) | 18826 | 19468 | –3.30 % |
Table 5Contribution of power battery pack to body-in-white static stiffness
Static stiffness | Body-in-white with power battery pack | Basic body-in-white | |||||||
Test | Error | Simulation | Test | Simulation | Error | ||||
Mass point model | Error | Refined model | Error | ||||||
Bending stiffness (N/mm) | 19229 | 34.34 % | 20748 | 7.90 % | 20491 | 6.56 % | 14314 | 13208 | –7.73 % |
Torsional stiffness (N·m/°) | 19468 | 32.54 % | 16192 | –16.83 % | 18826 | –3.30 % | 14688 | 15711 | 6.97 % |
6. Effect of power battery pack on modal and strength performance of body-in-white
6.1. Effect of power battery pack on modal performance of body-in-white
The above verified body-in-white model with refined power battery pack and the basic body-in-white model are used for a mode calculation. According to the theory of modal analysis, the modal characteristics of an undamped free vibration system can be obtained by solving the eigenvalues and eigenvectors of the vibration equation. In the OptiStruct software, multiple eigenvalue solutions such as tracking method, variation method and Lanzos method are provided. Lanzos method, which is an improved algorithm based on the tracking method and variation method, which is very effective for solving the eigenvalue of sparse matrix. Therefore, the modal calculation algorithm for the body-in-white adopts the Lanzos method, and the modal calculation frequency range is set to 0.1-50 Hz.
Table 6Influence of power battery pack on free mode of body-in-white
Modal and mode shapes | Body-in-white with power battery pack (refined model) | Basic body-in-white | ||||
Test | Simulation | Error | Test | Simulation | Error | |
First-order torsion (Hz) | 38.2 | 36.3 | –5.0 % | 34.2 | 35.9 | 5.0 % |
First order front cabin yaw (Hz) | 43.7 | 40.4 | –7.6 % | 40.0 | 39.6 | –1.0 % |
First-order bending (Hz) | 44.5 | 47.2 | 6.1 % | 49.3 | 48.6 | 1.4 % |
The free mode simulation models of the basic body-in-white and body-in-white with the refined power battery pack are downloaded to the solver for calculation, and the free mode calculation results are compared with the test results, as shown in Table 6. From Table 6, it can be seen that the test values of the first-order torsion frequency, first-order front cabin yaw frequency, and first order bending frequency of the body-in-white with refined power battery pack are 38.2 Hz, 43.7 Hz, and 44.5 Hz respectively, with relative errors of –5.0 %, –7.6 %, and 8.1 % compared to the simulation calculation values; The test values of the first-order torsion frequency, first-order front cabin yaw frequency, and first order bending frequency of the basic body-in-white are 34.2 Hz, 40.0 Hz, and 49.3 Hz, respectively. The relative errors with the simulation calculation values are 5.0 %, –1.0 %, and 1.4 % respectively. The relative errors of the test and simulation are within ±8 %. Therefore, it can be considered that the body-in-white model with a refined power battery pack is reliable. From Table 6, it can also be concluded that the power battery pack can significantly increase the first-order torsion frequency and first-order front cabin yaw frequency of the body-in-white, with an increase of 11.7 % and 9.3 %, while the first order bending frequency of the body-in-white will decrease by 9.7 %. This may be caused by factors such as torsion specific stiffness (ratio of torsion stiffness to mass), bending specific stiffness (ratio of bending stiffness to mass), and different distribution of mass in the longitudinal and transverse directions of the power battery pack.
6.2. Effect of power battery pack on strength performance of body-in-white
Using the Convert tool in OptiStruct software, the body-in-white model with refined power battery pack and basic body-in-white model are converted Abaqus model and perform static strength calculations. The static strength calculation conditions of the vehicle body are shown in Table 7. During calculation, the multi-body dynamics model of the vehicle body is used to extract the forces and moments at the attachment point between the body-in-white and the chassis, and the extracted forces and moments are applied at the attachment points. The constraint boundary is released using inertia, and the body-in-white model with refined power battery pack and basic body-in-white model are submitted to the solver for calculation. The calculation results are shown in Table 8.
Table 7Calculation conditions for static strength of vehicle body
Condition | Left front wheel loading (Gravity) | Right front wheel loading (Gravity) | Left rear wheel loading (Gravity) | Right rear wheel loading (Gravity) | |||||||||
X | Y | Z | X | Y | Z | X | Y | Z | X | Y | Z | ||
1 | 1G Full Load | 1 | 1 | 1 | 1 | ||||||||
2 | 3.5G Ultimate Vertical | 3.5 | 3.5 | 3.5 | 3.5 | ||||||||
3 | 3G Single Side Bounce | 3 | 1 | 1 | 1 | ||||||||
4 | 3G Single Side Bounce | 1 | 1 | 1 | 3 | ||||||||
5 | Right Cornering | –1 | 1 | –1 | 1 | –1 | 1 | -1 | 1 | ||||
6 | Left Cornering | 1 | 1 | 1 | 1 | 1 | 1 | 1 | 1 | ||||
7 | Braking | 1 | 1 | 1 | 1 | 1 | 1 | 1 | 1 | ||||
8 | Brake Right Cornering | 0.7 | –0.7 | 1 | 0.7 | –0.7 | 1 | 0.7 | –0.7 | 1 | 0.7 | –0.7 | 1 |
9 | Brake Left Cornering | 0.7 | 0.7 | 1 | 0.7 | 0.7 | 1 | 0.7 | 0.7 | 1 | 0.7 | 0.7 | 1 |
From Table 8, it can be seen that in the calculation of the static strength of the basic white body, the first, fifth, seventh, eighth, and ninth operating conditions are the safety conditions for the static strength of the basic body-in-white, while the second, third, fourth, and sixth operating conditions are the risky conditions for the static strength of the body-in-white. Among them, the plastic strain of parts such as middle floor crossbeam body, front seat real crossbeam, rear floor, rear wheel cover inner plate body, rear wall outer panel, etc. is greater than 0.2 %, indicating at a risk of strength failure. In the calculation of the static strength of the body-in-white model with refined power battery pack, all operating conditions are considered as risky conditions for the static strength of the body-in-white. Among them, the plastic strain of parts such as middle floor crossbeam body, front seat real crossbeam, rear floor, rear wheel cover inner plate body, rear wall outer panel, right real spring seat, left real spring seat, etc. is much greater than 0.2 %, posing a great risk of strength failure. This indicates a risk of failure in the static strength of the basic body-in-white under extreme operating conditions with a vertical direction greater than 3G, and there is almost no risk of failure under other typical operating conditions. However, the static strength of the body-in-white model with refined power battery pack has a significant risk of failure under all typical operating conditions, indicating that the power battery pack greatly increases the risk of static strength failure of the body-in-white. Through research on optimizing the structure of the body-in-white, it was found that the addition of welding or structural adhesive to the overlap between the middle floor and the door frame can significantly improve the risk of strength failure of the middle floor; The addition of structural adhesive to the plastic strain area of the rear floor can effectively solve the risk of strength failure of the rear floor, while the addition of partitions at the corners of the rear door frame can reduce the risk of strength failure of the rear door frame and rear wheel housing inner panels.
Table 8Calculation results of vehicle body static strength
Basic body-in-white | |||||
Condition | Maximum plastic strain | Evaluation criterion | Qualified or not | Risk parts (plastic strain) | |
1 | 1G Full Load | 0.12 % | < 0.2 % | Yes | No |
2 | 3.5G ultimate vertical | 1.26 % | No | Middle floor crossbeam body (1.26 %), Front seat rear crossbeam (0.71 %), Rear floor (0.77 %), Rrear wheel cover inner plate body (0.64 %) | |
3 | 3G single side bounce | 0.29 % | No | Middle floor crossbeam body (0.29 %) | |
4 | 3G single side bounce | 0.36 % | No | Rear floor (0.36 %), Rear wheel cover inner plate body(0.29 %), Rear wall outer panel (0.36 %) | |
5 | Right cornering | 0.16 % | Yes | No | |
6 | Left cornering | 0.21 % | No | Rear floor (0.21 %) | |
7 | Braking | 0.11 % | Yes | No | |
8 | Brake right cornering | 0.15 % | Yes | No | |
9 | Brake left cornering | 0.16 % | Yes | No | |
Body-in-white with power battery pack (refined model) | |||||
Condition | Maximum plastic strain | Evaluation criterion | Qualified or not | Risk parts (plastic strain) | |
1 | 1G full load | 0.34 % | < 0.2 % | No | Rear floor (0.23 %), Rear wheel cover inner plate body (0.34 %) |
2 | 3.5G ultimate vertical | 2.13 % | No | Middle floor crossbeam body (2.13 %), Front seat rear crossbeam (1.09 %), Rear floor (1.05 %), Rear wheel cover inner plate body (0.87 %) | |
3 | 3G single side bounce | 0.53 % | No | Front floor (0.46 %), Firewall (0.41 %), Middle floor crossbeam body (0.53 %) | |
4 | 3G single side bounce | 0.71 % | No | Middle floor crossbeam body (0.65 %), Rear floor (0.71 %), Rear wheel cover inner plate body (0.56 %), Rear wall outer panel (0.64 %) | |
5 | Right cornering | 0.34 % | No | Right rear spring seat (0.34 %), Middle floor crossbeam body (0.26 %) | |
6 | Left cornering | 0.39 % | No | Left rear spring seat (0.31 %), Rear floor (0.39 %) | |
7 | Braking | 0.25 % | No | Middle floor crossbeam body (0.25 %) | |
8 | Brake right cornering | 0.32 % | No | Left rear spring seat (0.28 %), Middle floor crossbeam body (0.32 %) | |
9 | Brake left cornering | 0.33 % | No | Rear wheel cover inner plate body (0.33 %), Middle floor crossbeam body (0.30 %) | |
7. Conclusions
1) A process and method for modeling the power battery pack and analyzing its influence on the performance of the body-in-white were proposed, to provides a reference for the development of the power battery pack and the design and optimization of the body.
2) A refined power battery pack model considering the internal structure of the power battery pack was established, and its effectiveness was verified through tests, laying the foundation for modal and strength analysis of the body-in-white.
3) The mass point model and the refined model of the power battery pack were compared in terms of the calculation accuracy of the static stiffness of the body-in-white. The calculation accuracy of the mass point model did not meet the requirements, while the refined model could achieve the desired effect.
4) The power battery pack can significantly increase the static stiffness of the electric vehicle's body-in-white, effectively increase the first-order torsion frequency and the first-order front cabin yaw frequency of the body-in-white, reduce the first-order bending frequency of the body-in-white, and greatly increase the risk of static strength failure of the body-in-white. In the setting of body performance goals and structural development, the influence of the power battery pack cannot be ignored.
References
-
W. Chen and W. Zuo, “Component sensitivity analysis of conceptual vehicle body for lightweight design under static and dynamic stiffness demands,” International Journal of Vehicle Design, Vol. 66, No. 2, p. 107, 2014, https://doi.org/10.1504/ijvd.2014.064546
-
W. Hou, C. Shan, P. Hu, and H. Zhang, “Multilevel optimisation method for vehicle body in conceptual design,” International Journal of Vehicle Design, Vol. 73, No. 1/2/3, p. 157, 2017, https://doi.org/10.1504/ijvd.2017.082589
-
Zhang Wentao et al., “A calculation method of car body in white’s static stiffness based on modal theroy,” (in Chinese), China Mechanical Engineering, Vol. 29, No. 5, pp. 511–518, 2018, https://doi.org/10.3969/j.issn.1004-132x.2018.05.002
-
X. Wen and Z. Du, “Analysis of structure strength and fatigue of mini car body,” Advances in Intelligent and Soft Computing, Vol. 162, pp. 551–558, 2012, https://doi.org/10.1007/978-3-642-29455-6_77
-
Wang Kefei et al., “Static stiffness analysis of automotive BIW under different boundary constraint conditions,” (in Chinese), Chinese Journal of Engineering design, Vol. 26, No. 4, pp. 441–451, 2019, https://doi.org/10.3785/j.issn.1006-754x.2019.04.010
-
Zhuang Hongjie et al., “Design method of vehicle body stiffness chain combined with strain energy analysis,” (in Chinese), Journal of Automotive Safety and Energy, Vol. 10, No. 3, pp. 317–325, 2019, https://doi.org/10.3969/j.issn.1674-8484.2019.03.007
-
Y. Meng, Y. Liang, Q. Zhao, and J. Qin, “Research on torsional property of body-in-white based on square box model and multiobjective genetic algorithm,” Mathematical Problems in Engineering, Vol. 2021, pp. 1–13, Jan. 2021, https://doi.org/10.1155/2021/7826496
-
W. Yao, K. Cai, and Y. Xu, “Optimizing the beam-like structure of a vehicle body using the grey-fuzzy-Taguchi method,” Engineering Optimization, Vol. 53, No. 1, pp. 49–70, Jan. 2021, https://doi.org/10.1080/0305215x.2019.1698033
-
M. S. Kumar and S. T. Revankar, “Development scheme and key technology of an electric vehicle: An overview,” Renewable and Sustainable Energy Reviews, Vol. 70, pp. 1266–1285, Apr. 2017, https://doi.org/10.1016/j.rser.2016.12.027
-
Lan Fengchong et al., “Deformation and response analysis of pack and internal structure of electrical vehicle battery in collision,” (in Chinese), Journal of South China University of Technology (Natura Science Edition), Vol. 45, No. 2, pp. 1–8, 2017, https://doi.org/10.3969/j.issn.1000-565x.2017.02.001
-
Hu Shenglong et al., “Vibration and noise reduction of battery pack in vehicle based on the improvement of transfer path,” (in Chinese), Journal of Vibration, Measurement and Diagnosis, Vol. 39, No. 6, pp. 1348–1354, 2019, https://doi.org/10.16450/j.cnki.issn.1004-6801.2019
-
X. Chen, J. Wang, K. Zhao, and L. Yang, “Electric vehicles body frame structure design method: An approach to design electric vehicle body structure based on battery arrangement,” Proceedings of the Institution of Mechanical Engineers, Part D: Journal of Automobile Engineering, Vol. 236, No. 9, pp. 2025–2042, Aug. 2022, https://doi.org/10.1177/09544070211052957
-
J. Christensen, C. Bastien, M. Blundell, A. Gittens, and O. Tomlin, “Lightweight hybrid electrical vehicle structural topology optimisation investigation focusing on crashworthiness,” International Journal of Vehicle Structures and Systems, Vol. 3, No. 2, pp. 113–122, 2011.
-
J. Li and M. S. Mazzola, “Accurate battery pack modeling for automotive applications,” Journal of Power Sources, Vol. 237, pp. 215–228, Sep. 2013, https://doi.org/10.1016/j.jpowsour.2013.03.009
-
F. Lan, “Study on the method of structural dynamic modeling and analyzing of the EV’s battery pack,” (in Chinese), Journal of Mechanical Engineering, Vol. 54, No. 8, p. 157, 2018, https://doi.org/10.3901/jme.2018.08.157
-
Huang Peixin, Lan Fengchong, and Chen Jiqing, “The structural response analysis of EV battery pack under random vibration and impact conditions,” (in Chinese), Automotive Engineering, Vol. 39, No. 9, pp. 1087–1093, 2017, https://doi.org/10.19562/j.chinasae.qcgc.2017.09.017
-
X. Hu and S. Stanton, “A complete li-ion battery simulation model,” in SAE 2014 World Congress and Exhibition, Apr. 2014, https://doi.org/10.4271/2014-01-1842
-
Chen Yu et al., “Vibration analysis of electric vehicle battery packs based on a precise dynamic model of battery units,” (in Chinese), Noise and Vibration Control, Vol. 38, pp. 19–23, 2018, https://doi.org/10.3969/j.issn.1006-1355.2018.z1.004
-
J. Lee, G. Zi, I. Lee, Y. Jeong, K. Kim, and W. Kim, “Numerical simulation on concrete median barrier for reducing concrete fragment under harsh impact loading of a 25-ton truck,” Journal of Engineering Materials and Technology, Vol. 139, No. 2, p. 02101, Apr. 2017, https://doi.org/10.1115/1.4035766
-
Wang Kefei et al., “Automotive body torsional stiffness testing restraint device and its restraint method,” Chinese Patent CN110057597A, 2019.
Cited by
About this article

The authors would like to thank the financial supports of the general project of Natural Science Research in Anhui University and the Youth Scientific Research Fund Project of Anhui Institute of Information Technology (22QNJKJ004), and the Natural Science Foundation of Anhui Province (2208085MF173).
The datasets generated during and/or analyzed during the current study are available from the corresponding author on reasonable request.
Kefei Wang lead the research, ideas, simulation analysis and writing. Peicheng Shi test support and coordination of research activities. Zhendong Zhang test and data analysis.
The authors declare that they have no conflict of interest.
