Abstract
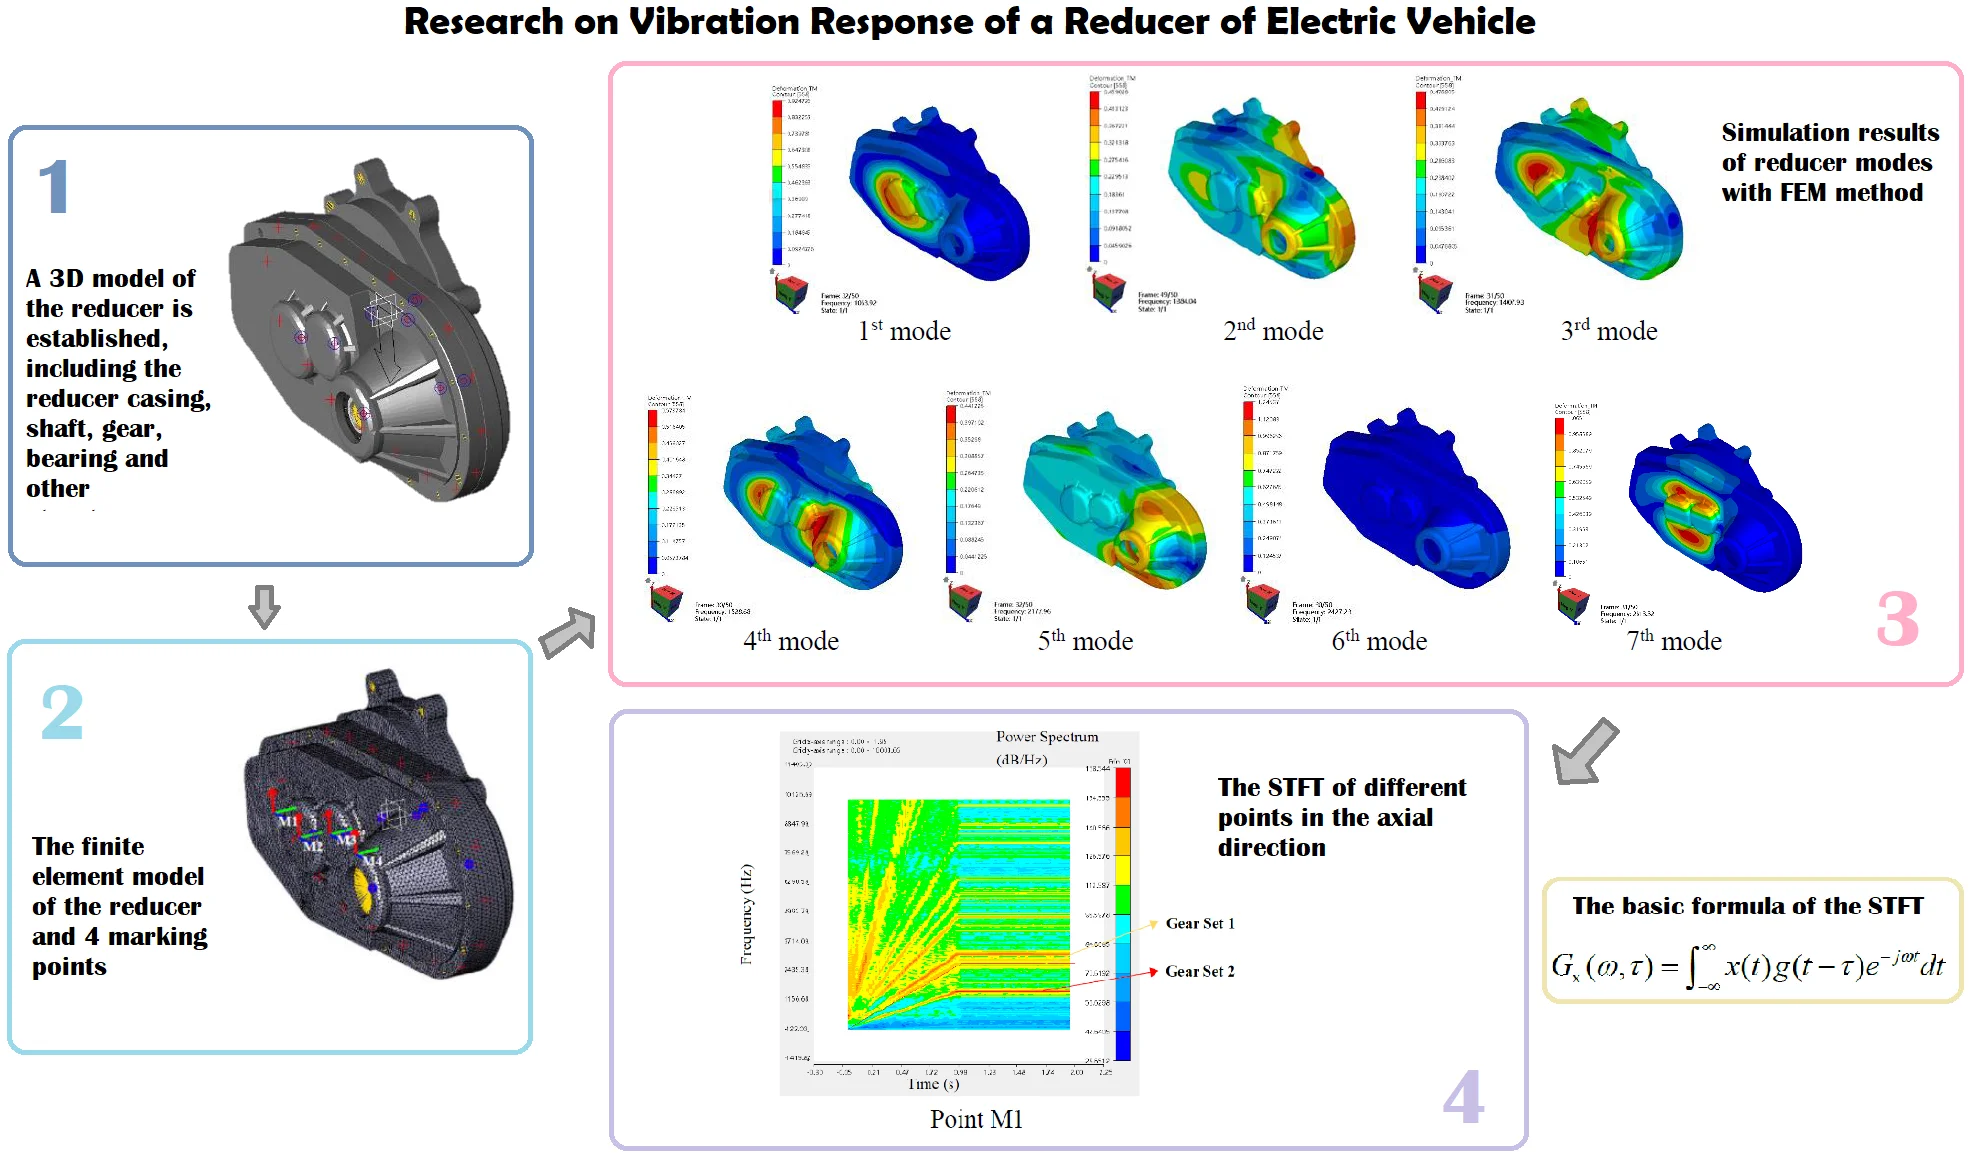
In order to study the vibration response of reducer of electric vehicle, a model for the reducer is established in ANSYS Motion, a multi-body dynamics software. Firstly, a 3D model of the reducer is built, including such assemblies as its shaft, gears, bearing, and its case. Secondly, based on the finite element model, the modal simulation is carried out. Finally, under the specified operating condition when the motor speed increases from 0 rpm to 10000 rpm, with using the STFT method, the vibration response of the reducer is obtained through the multi-body dynamics simulation. After comparing the simulation results between different marked nodes, the conclusion indicates that this process can calculate the vibration characteristics of the reducer quickly and accurately and can lay the foundation for the structural optimization in terms of vibration and acoustic properties.
Highlights
- The process described in this paper can calculate the vibration characteristics of the reducer quickly and accurately.
- The structure of the reducer should be optimized to avoid the natural frequency close to that of the permanent magnet synchronous motor.
- According to the STFT graph, the vibration response of mark point M3 is the strongest.
1. Introduction
With the rapid development of the electric vehicle industry, the motor is constantly improving towards the direction of high efficiency and high-power density, and the speed of the motor is also constantly increasing. In order to comply with the development trend of the motor, the input speed of the reducer matched with it is also constantly improving, and the maximum input speed demand has reached more than 10000 rpm, which poses a huge challenge to the NVH of high-speed gear transmission [1].
Due to not only the demand for the characteristics of electric vehicle motors with high speed and high torque, but also the lack of masking effect of engines, the gear noise is particularly prominent [2]. Scholars have carried out the acoustic and vibration characteristic tests on pure electric vehicle driving system, and have analyzed the contribution components and causes of vibration noise. The experimental results show that the reducer and differential mechanism are the main contribution components of vibration and noise of electric vehicle [3].
For the reducer, due to different kinds of processing and assembly errors and time-varying meshing stiffness and other factors, the meshing process produces vibration, which is transmitted to the box body through the gear shaft to cause vibration and thus radiates noise.
2. The causes of reducer’s vibration and its signal analysis method
Due to the influence of factors such as errors in the design, processing and assembly of gears, as well as the fluctuation of external load, etc., a series of noises are generated during the operation of the gear reducer, which are generally divided into two categories: airborne noise and structural radiated noise.
The airborne noise is mainly the abnormal signal caused by transmission error of meshing gear, which leads to the self-noise caused by the friction between gear teeth and the noise transmitted through the air to the outside world through the shell structure. The radiated noise of the structure is mainly caused by the vibration excitation of the gear meshing which is transmitted to the reducer housing by the bearing and radiated directly into the air by the vibration of the housing surface [4].
At present, FFT (fast Fourier transform) method is widely used in gearbox vibration analysis and the technology is relatively mature. However, FFT method cannot satisfy the analysis of non-stationary signals, and there are inevitable defects in the analysis of non-stationary processes [5]. FFT method can only give the statistical average results in frequency domain, but it can’t provide the information of signal localization in time domain and frequency domain. However, the STFT is quite good at overcoming the shortcoming of the FFT [6].
STFT (Short-time Fourier transform or Short-term Fourier transform), related on FFT (Fast Fourier transform), is used to determine the sinusoidal frequency and phase content of local sections of a signal as it changes over time. STFT analysis is widely used in vehicle NVH performance analysis, such as fast and effective identification of start-stop shake vibration characteristics. The principle is to select a time-frequency localized window function. Assume that the analysis window function is stationary in a short time interval, and then move the window function so that is stationary signal in different finite time widths, and then calculate the power spectrum of the vibration signal at different times.
STFT can be used to calculate the amplitude of non-stationary signals. The calculated value is very close to the real value, which basically meets the application needs. Therefore, it can be known that STFT with using fixed time window function has good locality in both time domain and frequency domain, which is suitable for the analysis of non-stationary signals [7].
The basic formula of the STFT is as follows:
where is integral function, is limited frequency function, is time function, reflects the signal frequency component of with frequency at time .
3. Simulation and analysis
3.1. 3D model of the reducer
A 3D model of the reducer is established, including the reducer casing, shaft, gear, bearing and other structures. Among them, the reducer housing 3D model is shown in Fig. 1. The assembly 3D models of shaft, gear and bearing are shown in Fig. 2. The gear parameters used in this paper are shown in Table 1.
Fig. 13D model of the reducer housing
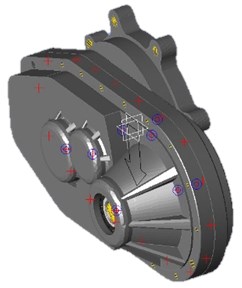
Fig. 2Assembly 3D models of reducer’s shaft, gear and bearing
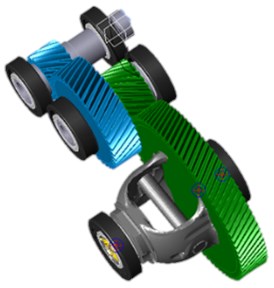
Table 1Parameters of reducer gear sets
Parameters | Gear Set 1 | Gear Set 2 | ||
Driving Gear | Driven Gear | Driving Gear | Driven Gear | |
Gear type | Helical | Helical | Helical | Helical |
Hand of helix | Right | Left | Right | Left |
Module | 2.5 | 2.5 | 2.4 | 2.4 |
Number of teeth | 19 | 42 | 21 | 80 |
Face width (mm) | 30 | 28 | 33 | 30 |
Pressure angle (°) | 14.5 | 14.5 | 22.5 | 22.5 |
Helix angle (°) | 24 | 24 | 26.5 | 26.5 |
Profile shift coefficient | 0.072 | –0.099 | 0.501 | –0.834 |
3.2. Modal simulation
The structure of the vibration system is discretized by finite element method, and the eigenvectors and eigenvalues of the vibration system (i.e. the natural frequency and the natural mode of the system) are obtained by establishing a mathematical model.
Firstly, the finite element model is established in this paper. The finite element grids are meshed for the 3D model of the reducer, and the 4 marking points are selected on one side of the output end, as shown in Fig. 3.
Fig. 3The finite element model of the reducer and 4 marking points (M1~M4)
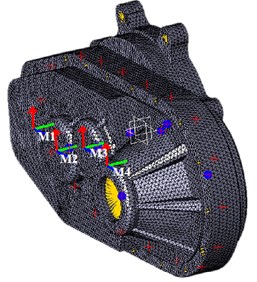
Secondly, the boundary conditions are determined. Since the mode of the reducer is an inherent property of the structure, it has nothing to do with its external constraints. At the same time, it is necessary to simulate the free boundary condition when the structure is tested and verified, so the simulation needs to analyze the free mode of the reducer [8]. Since the reducer is subjected to modal calculation in a free state, no constraint is imposed.
The natural frequencies and modes of the reducer are calculated by the ANSYS Motion software. The first seven natural frequencies and their corresponding modes are extracted from the modal calculation of the reducer in the free state. The simulation results are shown as Table 2 and Fig. 4.
Table 2Simulation results of reducer modal
Order | Frequency (Hz) | Vibration modes |
1 | 1063.9 | Breathing in the direction |
2 | 1384.0 | Bending in the direction |
3 | 1407.9 | Twisting in the direction |
4 | 1528.7 | Bending in the direction |
5 | 2178.0 | Bending in the direction on the output side |
6 | 2427.2 | Bending in the direction on the output side |
7 | 2613.3 | Breathing in the direction on the input side |
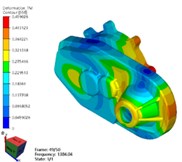
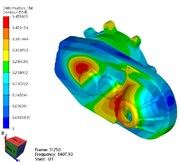
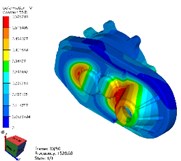
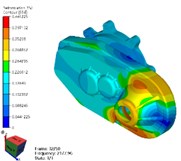
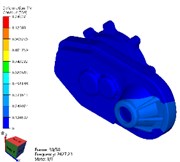
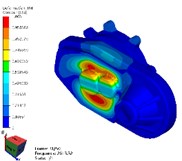
Fig. 4Simulation results of reducer modes with FEM method
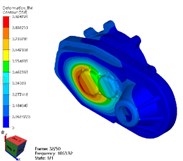
a) 1st mode
b) 2nd mode
c) 3rd mode
d) 4th mode
e) 5th mode
f) 6th mode
g) 7th mode
3.3. Modal analysis
As shown in Table 2 and Fig. 4, the results of modal simulation analysis are analyzed as follows. The first vibration mode is the breathing at the bearing position of the input shaft of the reducer housing, accompanied by the bending of the housing. The second mode is the bending of the shell along the -axis, in which the strong bending vibration occurs at the connection between the reducer and the motor. The third mode is torsional vibration around axis. The fourth mode is bending vibration in the -axis direction, and the vibration phenomenon appears in the weak position of the shell reinforcement. The fifth mode is bending vibration along the -axis direction, in which the cover of the reducer output shaft end appears more obvious vibration phenomenon. The sixth mode is bending vibration in the direction of -axis, in which the vibration at the end cover of the reducer output shaft is more obvious. The seventh mode is concave and convex vibration in the direction of -axis, and the vibration of the shell reinforcement at the side of the input shaft of the reducer is obvious.
However, by comparing the modal analysis data of the PMSM matched with the reducer, it is found that the mode frequency of the two-order mode of the reducer is quite similar to that of the corresponding PMSM. The first natural frequency of the reducer is 1063.9 Hz, which is close to the third natural frequency of the corresponding PMSM stator (1095.5 Hz). The seventh natural frequency of the reducer is 2613.3 Hz, which is close to that of the corresponding PMSM stator (2689.2 Hz) [9]. In the next step, it is necessary to optimize the two orders mode of the reducer so as to prevent the deterioration of the vehicle’s NVH performance caused by the resonance between the motor and the reducer during driving.
3.4. Multi-body dynamics simulation
The restraint connections of motion pair are respectively applied to the reducer parts. Since there is no relative motion between the gear and the shaft, fixed pair constraints are used to connect them separately. The reducer is bolted to the motor. In order to simulate the connection of the reducer in the bench test, the degrees of freedom between the reducer and the motor shell are all limited when analyzing the vibration response of the reducer housing.
After loading the results of modal simulation analysis on the reducer housing, the input parameters of the reducer are set according to the relevant output parameters of the vehicle driving motor, as shown in Table 3. During simulation, the initial speed is 0rpm, and the speed is accelerated to 10000 rpm after 1 s of acceleration time, and the speed is kept constant.
Finally, the multi-body dynamics analysis of the reducer is carried out with ANSYS Motion software. The simulation results can be used for STFT analysis of reducer casing. By comparing the STFT results of each marking point, it is found that the axial power spectrum results of each nodes are the most significant, as shown in Fig. 5.
Table 3Input parameters set according to the matching motor
Parameters (unit) | Value |
Input power (kW) | 85 |
Max torque (Nm) | 225 |
Max speed (rpm) | 10000 |
Fig. 5The STFT of different points in the axial direction
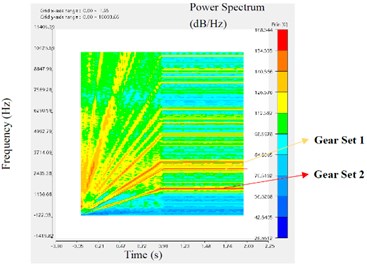
a) Point M1
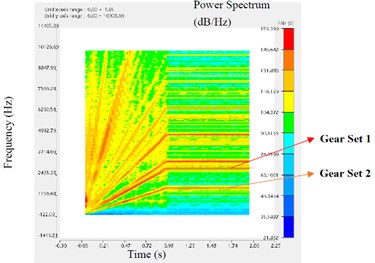
b) Point M2
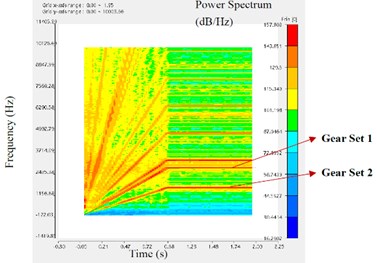
c) Point M3
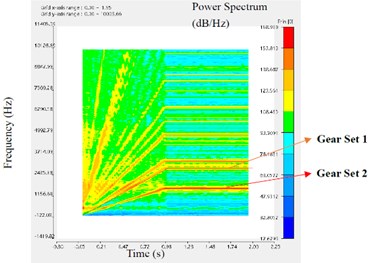
d) Point M4
3.5. STFT analysis
The analysis results of STFT are as follows. As the speed of the reducer increases linearly in the beginning and then remains constant, all spectral lines on each STFT graph are radially upward from the origin and then remain horizontal. In each figure, the horizontal axis represents the time axis and the vertical axis represents the frequency. The redder the spectral line color, the greater the corresponding power spectral density. The ANSYS Motion software can automatically calculate the influence of two sets of gears on the marking point’s STFT, and mark corresponding spectral lines in the map.
As shown in Fig. 5, the STFT at M3 has the largest red and yellow areas and the darkest color, followed by M2, M1, and M4. This means that, among the four marker points, the intensity of vibration response from large to small is M3, M2, M1 and M4 respectively. The middle shaft has a strong vibration response, followed by the input shaft, then the housing beside the input shaft, and finally the output shaft. Therefore, in the future structural optimization, priority should be given to the intermediate shaft of the reducer.
At the same time, it is found that the spectral color of gear set 2 is darker than that of gear set 1. This may be because gear set 2 transmits a greater torque than gear set 1. It is also possible that the structural parameters of gear set 2 are not as reasonable as gear set 1. Therefore, the influence factors of vibration response between gears need to be further studied.
4. Conclusions
In order to analyze the vibration characteristics of reducer for electric vehicle, the modal analysis and the multi-body dynamics simulation of the reducer was carried out in this paper. The main conclusions are as follows:
1) The finite element modal analysis of the reducer was carried out. The axial stiffness of the output-side reducer housing and the weak position of the reducer housing’s reinforcement is weak. It is suggested to strengthen the axial stiffness of reducer properly.
2) Compared with the modal analysis data of the permanent magnet synchronous motor matched with the reducer, the first and seventh natural frequencies of the reducer are close to the natural frequencies of the matching PMSM’s stator. It is suggested that the structure of the reducer be optimized to avoid the natural frequency close to that of the permanent magnet synchronous motor.
3) Gear set 2 has great influence on NVH performance response. It is suggested to optimize the structure parameters of gear set 2, such as tooth shape, gear center distance and tooth side clearance, to improve the vehicle NVH performance.
4) The STFT graph of mark point M3 has the darkest color and the highest power spectral density, which means that the vibration response of this point is the strongest. It is suggested to optimize the stiffness of the intermediate shaft corresponding to M3 point and the strength of the reducer housing near this area.
References
-
Shao P. Research on NVH optimization of high-speed reducer for electric vehicle. CN Auto Time, Vol. 4, 2020, p. 35-36, (in Chinese).
-
Fang Y., Zhang T., Yu P., Chen F. F., Guo R. Acoustic characteristic analysis and experimental study of centralized driving electric vehicle. Journal of Vibration and Shock, Vol. 34, Issue 13, 2015, p. 89-94, (in Chinese).
-
Li Z. X., Sui N., Wang G. Experimental study on vibration and noise of pure electric vehicle (PEV) drive system. International Conference on Electric Information and Control Engineering, 2011, (in Chinese).
-
Zhao F. Z., Yang R. G. Voltage sag disturbance detection based on short time Fourier transform. Proceedings of the CSEE, Vol. 27, Issue 10, 2007, p. 28-34.
-
Chen J., Ding J. X., Bai Z. J. Research on the comprehensive evaluation method of main reducer Assembly quality based on multiple parameters. Journal of Mechanical Transmission, Vol. 34, Issue 4, 2010, p. 28-32, (in Chinese).
-
Hu X. Y., He Q. F., Wang H. S., et al. Vibration signal demodulation method based on STFT and its application in rolling bearing fault detections. Journal of Vibration and shock, Vol. 27, Issue 2, 2008, p. 82-86.
-
Hu Z. B., Xu M. X., Jiang G. D., Zhang D. S. Analysis of non-stationary signal of the sudden unbalanced spindle based on wavelet noise reduction and short-time Fourier transform. Journal of Vibration and Shock, Vol. 33, Issue 5, 2014, p. 20-23.
-
Zhang Z. Q. Research on Noise Radiation of Electrical Vehicle Reducer Housing. Yanshan University, 2016, (in Chinese).
-
Li H. B., Zhang D., Xu P. Y., et al. Analysis on the vibration modes of the electric vehicle motor stator. Vibroengineering Procedia, Vol. 22, 2019, p. 81-86.
About this article

The authors express their gratitude to the SAIC Industrial Foundation Fund (1729) for the financial support of the study.
