Abstract
As a core component of wind turbines, wind power gear speed increasers often work in harsh environments, so it is necessary to study the vibration characteristics of gear transmission systems. Taking a wind turbine gearbox high-speed stage helical gear transmission system as the research object, the dynamics model of multi-degree-of-freedom helical gear-rotor-bearing transmission system is established by the lumped parameter method and solved by Runge-Kutta method, taking into account the tooth side clearance of the gear, transmission error, eccentricity and support force of the nonlinear bearing. The effects of input torque, transmission error and tooth side clearance on the vibration characteristic response of the helical gear train were analyzed. The relationship between the trend of amplitude change in each direction of the gear and the trend of change in the major frequency components was analyzed under the conditions of changing internal and external excitation. The results show that torsional vibration dominates in the system. As the input torque increases, the vibration amplitude of the driving and driven gears decreases, and the frequency amplitude decreases significantly at multiple locations. Gear transmission errors and changes in tooth side clearance have significant effects on gear vibration amplitudes, but are sensitive only to the meshing frequency. The trend of gear vibration amplitude caused by the change of external excitation of the gear set is synchronized with the trend of main frequency amplitude in the corresponding direction, while the change of vibration amplitude caused by internal excitation is consistent with the trend of mesh frequency amplitude in the corresponding direction. The results of this paper can pave a certain foundation for the design and fault diagnosis of wind power gearbox transmission system.
Highlights
- A dynamic model of a 22 degree of freedom helical gear-rotor-bearingtransmissionsystem was established, taking into account multiple excitations in the system, and the vibration response of the system was solved.
- The effects of input torque, tooth pitch error, and tooth side clearance on the system vibration response were analyzed separately.
- Studied the relationship between the amplitude change trend at each position of the gear and the main frequency amplitude change trend under internal and external excitation changes.
1. Introduction
As a very widely used motion and power transmission device in industry, the gear-rotor-bearing transmission system plays an important role in key equipment in industries such as vehicles, ships, aerospace, wind power generation and machine building [1]. Due to the meshing action of the gears, the vibration characteristics of this rotating structure are very different from those of a simple rotor-disc system, and the vibrations in all directions of the system caused by the gear meshing forces need to be considered. Because most gear systems work in harsh environments and are accompanied by the coupling effect of multiple internal and external excitations, this leads to an increase in system vibration, which decreases the accuracy, increases the noise and decreases the reliability of the entire mechanical drive system. Therefore, it is essential to study the vibration characteristics of gear-rotor-bearing system and analyze the factors affecting the vibration response of the system for the design and fault diagnosis of wind turbine gear transmission system.
In recent years, many scholars have studied the dynamics model and vibration characteristics of gear-rotor-bearing transmission systems, and some remarkable results have been achieved. Özgüven considered the time-varying mesh stiffness and developed a 6-degree-of-freedom spur gear-shaft-bearing model to investigate the effect of transverse torsional vibration coupling on gear dynamics [2]. Kahraman studied the nonlinear frequency response characteristics of spur gear-rotor-bearing system and established a 3-degree-of-freedom dynamics model[3], after that, he proposed a dynamics model of a multi-shaft helical gear reducer, completed the prediction of free and forced vibrations of the system using eigenvalue solutions and modal summation techniques, and presented the results of an experimental study of the helical gear-shaft-bearing system to verify the correctness of the model[4]. Walha and Fakhfakh developed a 12-degree-of-freedom dynamics model of a two-stage spur gear train considering tooth side clearance and time-varying meshing stiffness, and investigated the nonlinear dynamic response of the system using linearization techniques [5]. Kang and Hsu investigated the dynamic behavior of a viscoelastic supported spur gear-rotor system under the influence of gear eccentricity, gear mesh transfer error and residual shaft bowing [6]. Gao and Zhang developed a dynamic model of nonlinear time-varying spur gear-rotor-bearing transmission system considering the influence of nonlinear factors such as time-varying meshing stiffness and nonlinear oil film force, and analyzed the influence of nonlinear oil film force and dynamic meshing force on the transmission system [7]. Li established a dynamics model of a helical gear-rotor-bearing transmission system with 22-degrees-of-freedom using the lumped parameter method, and analyzed the corresponding effects of rotational speed, eccentricity and bearing clearance on system vibration [8]. Hu established a finite element nodal model of a high-speed spur gear-rotor-bearing system and studied the effect of tooth profile adjustment on the dynamic behavior of the system [9]. Zhou established the nonlinear dynamics models of spur gear-rotor-bearing with 8 and 12 degrees of freedom respectively, and studied the nonlinear response of the system and analyzed the effects of some parameters on the vibration response of the system [10], [11]. Ling established a 16-degree-of-freedom nonlinear dynamics model of a gear-rotor-rolling bearing transmission system under the consideration of time-varying meshing stiffness, eccentricity and nonlinear bearing forces, and obtained the effects of different parameter variations on the dynamic response of the system [12]. Lu established a mathematical model of the two-axis rotor-bearing-gear coupling system and verified the correctness of the model [13]. Tatar developed a 6-degree-of-freedom dynamics model for an equally spaced planetary gear-rotor system considering gyroscopic effects [14]. Lu developed a dynamic model of a misaligned spline coupling gear-rotor system taking into account the gear meshing force and the spline coupling meshing force [15]. Liu considered the composite dynamic tooth clearance and variable meshing stiffness during tooth root crack failure, and established a 16-degree-of-freedom faulty spur gear-rotor-bearing coupled transmission system, compared the system vibration response of the three clearance models and explored the dynamic response of the system with the increase of crack depth [16]. Lu proposed a coupling method between a multi-stage gear rotor and a box, concluding that the gearbox vibration level can be doubly reduced to the coupled box model [17]. Ouyang investigated the dynamic characteristics of the spur gear-rotor-bearing system through experimental tests and theoretical modeling [18]. Wang fully considered the bearing time-varying support stiffness, the relationship between gear meshing stiffness and multiple meshing phases, and the integrated error, and established a coupled spur gear-rotor-bearing dynamics model [19]. Huang and Wang developed a coupled helical gear-rotor-bearing dynamics model based on the Timoshenko beam element model in finite element theory and the envelope mass method, and analyzed the effects of meshing stiffness, tooth clearance and bearing stiffness on the vibration characteristics of the system [20]. Shi developed a novel nonlinear dynamic model of a spur gear-rotor-bearing system with five meshing states, including time-varying tooth gap and time-varying meshing stiffness, is developed by introducing multiple state subfunctions and the effects of gear temperature and load on the meshing stiffness are analyzed [21]. Xu developed a nonlinear spur gear-shaft-bearing-housing vibration model with 14-degrees-of-freedom to study the vibration response under the action of dynamic gear meshing forces and progressive radial clearance [22].
In summary, most of the current literature focuses on the vibration characteristics of spur-rotor-bearing systems, while there is not much literature on helical gear-rotor-bearing. In this paper, a 22-degree-of-freedom helical gear-rotor-bearing dynamics model (HGRBS) is re-established based on the literature [8] by adding the tooth-side clearance of helical gears, and the vibration response of the system is solved. The effects of input torque, tooth pitch error, and tooth side clearance on the vibration response of the system were analyzed. The relationship between the trend of amplitude variation and the trend of major frequency amplitude variation at each location of the gear under the change of internal and external excitation is investigated.
2. Modeling the dynamics of the coupled helical gear-rotor-bearing system
2.1. Modeling of gear system dynamics
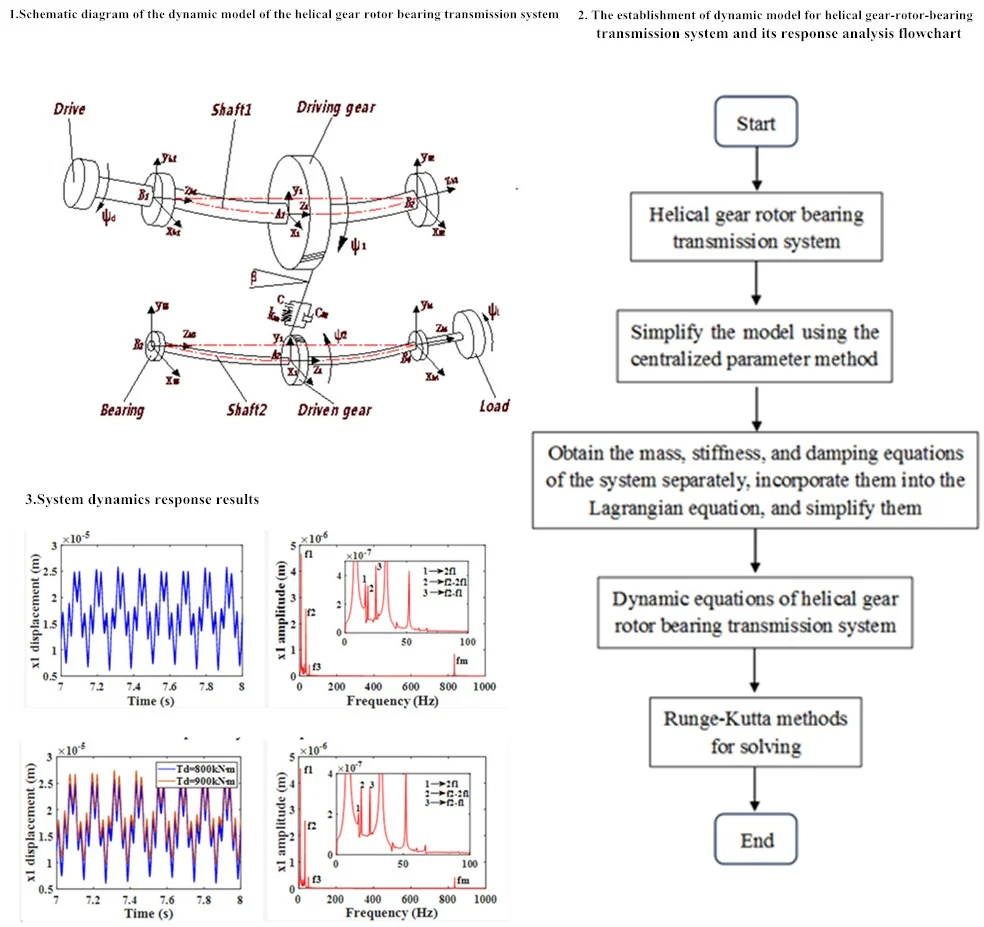
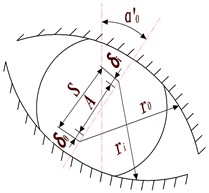
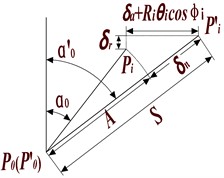
The structural diagram and geometrical positional relationship of the dynamic model of helical gear-rotor-bearing transmission system are shown in Fig. 1.
Fig. 1Dynamics model of helical gear-rotor-bearing transmission system
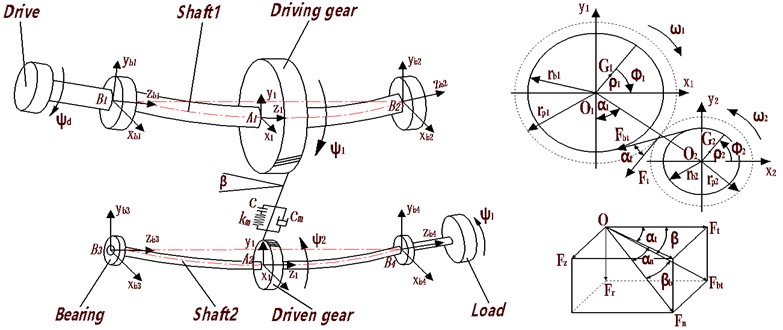
As shown in the Fig. 1, the fixed coordinate system is established in the ideal center of the driving and driven gears, and the fixed coordinate system - is established in the ideal center of the bearing; the rotation center coordinates of the driving and driven gears are and respectively; the center of mass coordinates and ; the mass of helical gear is , ; the moment of inertia relative to the center of mass is , ; , are the eccentricity; , are the base circle radius; the equivalent mass at the bearing is ; The moment of inertia of the input device and the load are and respectively; , and are respectively the tangential force; radial force and axial force when the gears are engaged; , are the end face pressure angle and normal phase pressure angle respectively; , are the spiral angles of graduation circle and Base circle, and is the angle between the center line of two gears and the vertical direction.
Based on the geometric relationship shown in Fig. 1, the angular displacement of the input/ output device, driving and driven gears can be represented by Eq. (1):
where, , , , are the torsional vibration angular displacement of the input device, the driving and driven gears, and the load respectively. At , the starting rotation angle of the driving and driven gears is 0, and the direction of rotation of the driving gears is positive. Then the relationship between the center of mass , and the center of rotation , is shown in Eq. (2):
where , , are the horizontal, vertical and axial vibrational displacements of the driving and driven gears, respectively. According to the geometric relationship, the dynamic deformation displacement of the helical gear pair in the meshing line direction can be expressed by Eq. (3):
where, is the integrated transmission error of the system, is the mean value of error, is the amplitude of error, and is the meshing frequency. The meshing force of the gear meshing system along the meshing line direction can be expressed as , is the average meshing stiffness and the values are shown in Table 1; is the tooth side clearance function can be expressed by Eq. (4):
The meshing force between the gears is decomposed into the -, - and -directions, and the forces in each direction are shown in Eq. (5):
2.2. Rolling bearing vibration analysis model
A plane model of an angular contact ball bearing is shown in Fig. 2. It is assumed that the outer ring of the bearing is fixed on the housing and the inner ring is fixed on the rotating shaft. The rolling bodies are arranged at equal angular intervals between the inner/outer rings. The velocity , at the contact point between the rolling body and the inner/outer ring of the bearing is shown in Eq. (6):
where, and are the radius of bearing inner/outer rings respectively; and are angular speeds of bearing inner/outer rings respectively; Assuming that the rolling body is purely rolling in the ideal state, then the rotational angular velocity of the cage and the rolling body are equal, and the linear velocity of the rolling body can be expressed as:
In general, the inner ring of the rolling bearing rotates with the rotating shaft, while the outer ring is bound with the bearing seat is not rotating, then there is , . Therefore, the formula of the angular velocity of the cage can be obtained as shown in Eq. (8):
Then the rotation angle of the -th rolling body in timeis shown in Eq. (9):
where, is the number of bearing rollers.
Fig. 2Diagram of angular contact ball bearing
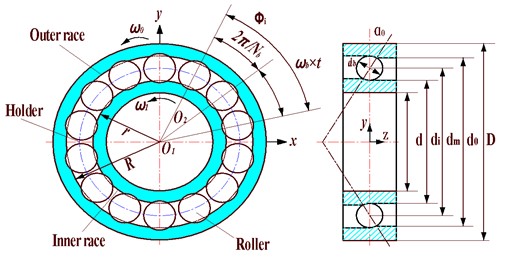
In Fig. 2, is the rolling body diameter of the bearing; is the diameter of the axis; , are groove diameters of inner/outer rings of bearings respectively; is the pitch diameter of the bearing, and ; is the diameter of the bearing outer ring. The centrifugal force and gyroscopic moment generated by the rolling body are neglected in the bearing model because of the low rotational speed of the system studied in this paper. The deformation of the bearing at different positions is shown in Fig. 3.
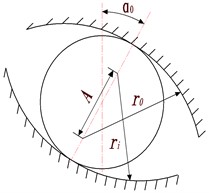
Fig. 3a) Before loading, b) after loading, c) geometric deformation relation
a)
b)
c)
In Fig. 3, is the initial contact angle, and is the contact angle after stress. and are the position of bearing outer ring raceway curvature center before/after the force respectively, because the bearing outer ring is fixed, so the position of both is the same. and are the position of the center of curvature of the inner ring raceway of the bearing before/after the force respectively. , and are the radial deformation, axial deformation and angular deformation caused by the force and torque respectively. is the radius of the inner ring raceway curvature center track. is the angle of the current rolling body relative to the position of the bearing; , , are the contact deformation and total deformation of the inner and outer channel of the ball bearing respectively.
Because the rolling body ignores centrifugal force and gyroscopic moment, it has the same contact angle and contact force with the inner and outer ring grooves. As shown in Fig. 3(b), the deformation of the rolling body at the position Angle can be expressed by Eq. (10):
According to the geometric relationship in Fig. 3(c), the distancebetween the curvature center locus of the inner and outer ring channels after loading can be expressed as:
Then, the normal contact deformation of the -th ball and raceway is shown in Eq. (12):
Let , , then Eq. (13) can be reduced to:
where, , and are vibration displacements along -, - and -directions respectively; is the radius of the locus of curvature center of the inner ring channel, ; is the distance between the initial inner and outer ring channel curvature centers .
According to the geometric relation, the actual contact Angle of the ball is at the position Angle (the contact Angle of the inner and outer rings is equal):
According to Hertz contact theory, the contact pressure generated by the -th ball and raceway is . It is considered that only normal positive pressure can be generated between the ball bearing and the raceway, so there is a force when the , as shown in Eq. (15):
Eq. (15) is the normal load acting on the trench along the contact angle direction, where is the Hertzian contact stiffness; is the Heaviside function, and the axial and radial components of this load decomposition can be expressed by Eq. (16):
The components , and of bearing force generated by angular contact bearing in -, - and -directions are respectively:
2.3. Establishment of coupling dynamics equation of helical gear-rotor-bearing
Transverse, torsional and axial deformations of helical gear-rotor-bearing systems are considered. Then the displacement array of the system is:
where, , and , are the vibration displacements of the driving and driven gears along the -, - and -directions respectively; , and , are the vibration displacements of the bearings at both ends of the driving and driven shafts along the -, - and -directions respectively. Considering that the helical gear-rotor-bearing system is composed of gears, bearings, drive and load devices. Therefore, the kinetic energy , potential energy and dissipation function of the system were established, as shown in Eqs. (19-21), which were substituted into Lagrange Eq. (22), and the control differential equation of the system was derived as shown in Eqs. (23-28).
The kinetic energy is given by the following formula:
Considering the changes in shaft, bearing and tooth profile, potential energy can be expressed as follows:
When meshing damping, bearing damping and shaft damping are considered, the dissipation function is:
The Lagrange equation is shown in Eq. (22):
The control differential equations of the input device and the left end bearing of the drive shaft are shown in Eqs. (23-24):
The control differential equation of the driving gear is shown in Eq. (25):
The control differential equations of the right bearing of the drive shaft and the left bearing of the driven shaft are given in Eq. (26):
The control differential equation of the driven gear is shown in Eq. (27):
The control differential equation of the bearing at the right end of the driven shaft and load device are given in Eq. (28):
where, , and , are the bending stiffness of the shafts Ⅰ and Ⅱ; , are the torsional stiffness of the shafts Ⅰ and Ⅱ; , and ,are the bending damping of the shafts Ⅰ and Ⅱ. , are the torsional damping of the shafts Ⅰ and Ⅱ; , is the damping at the bearing; , and ,are nonlinear support force in -, - and -directions at the bearing. The gear system parameters studied in this paper are the actual parameters of high-speed stage helical gears in wind turbine gearboxes, some of which are referred to literature [8], as shown in Tables 1-3.
Table 1Gear parameters
Parameter name | Parameter symbol | Value |
Number of teeth | , | 100, 25 |
Pressure angle | / (°) | 20 |
Spiral angle | / (°) | 15 |
modulus | 8 | |
Driving/Driven gear mass | , / (kg) | 668, 141 |
Rotational inertia of driving/driven gear | , / (kgm2) | 44.35, 0.21 |
Meshing damping ratio | 0.1 | |
Mean value of meshing stiffness | 1.811109 | |
Error mean/magnitude value | , / (m) | 2×10⁻⁵, 2×10⁻⁵ |
Lateral clearance | / (um) | 10 |
Eccentric distance | , / (m) | 5×10⁻⁵ |
Table 2Bearing parameters
Parameter name | Parameter symbol | Value |
Bearings 1, 2, 3 and 4 concentrate mass | , , , / (kg) | 115.2, 115.2, 73.2, 73.2 |
Bearing 1, 2 support stiffness | , / (N∙m-1) | 6×10⁸ |
, / (N∙m-1) | 9×10⁸ | |
, / (N∙m-1) | 4.8×10⁸ | |
Bearing 3, 4 support stiffness | , / (N∙m-1) | 2×10⁸ |
, / (N∙m-1) | 3×10⁸ | |
, / (N∙m-1) | 1.6×10⁸ | |
Brace damping ratio | 0.01 | |
Contact stiffness of bearings 1 and 2 | / (N∙m-1) | 1.334×10⁸ |
Contact stiffness of bearings 3 and 4 | / (N∙m-1) | 1.034×10⁸ |
Number of rollers | , | 14, 10 |
Bearing 1, 2 inner/outer radius | , / (m) | 0.2, 0.25 |
Bearing 3, 4 inner/outer radius | , / (m) | 0.1, 0.125 |
Bearing clearance | , / (m) | 2.5×10⁻⁷, 5×10⁻⁷ |
Table 3Axis parameters
Parameter name | Parameter symbol | Value |
Shaft I and Ⅱ bending stiffness | , , , / (N∙m-1) | 6×10⁸, 6×10⁸, 1.5×10⁸, 1.5×10⁸ |
Bending damping ratio | 0.07 | |
Shaft I and II torsional stiffness | ,/(N∙m-1) | 8×10⁸, 1.5×10⁸ |
Torsional damping ratio | 0.07 | |
Moment of inertia of the driving and load device | , / (kg∙m2) | 20, 5 |
Input and output revolutions | , / (r/min) | 500, 2000 |
3. Analysis of vibration response and influencing factors of HGRBS system
3.1. Vibration response analysis of HGRBS system
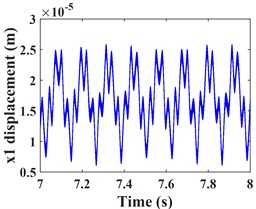
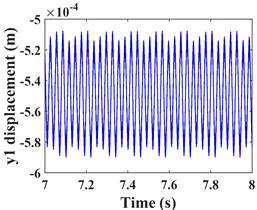
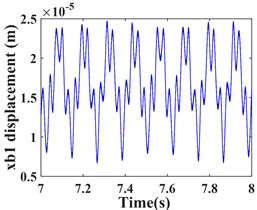
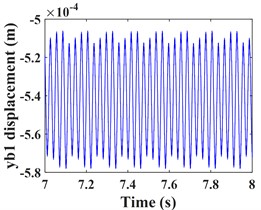
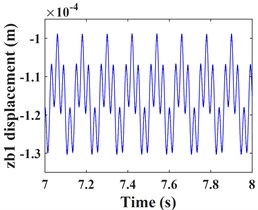
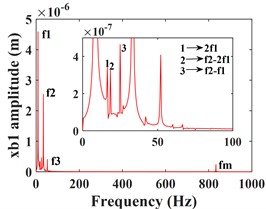
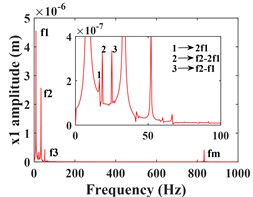
Based on the data in Tables 1, 2 and 3, the vibration response of the gear-rotor-bearing transmission system with input torque = 800 kN∙m and input speed = 500 r/min has been calculated by decoupling the equations of the transmission system dynamics using ode15s in MATLAB, and the simulation results are shown in Figs. (4-6). the time domain waveforms and frequency spectra of the driving and driven gears and their corresponding left end bearings in the -, - and -directions are shown respectively (the plots include local amplification of some frequency bands). In the plots, the vibration displacements in the two translational, axial, and torsional directions of the driving gear are denoted by , , and respectively, and the two translational and axial vibration displacements of its corresponding left bearing are denoted by , and , , , , and , , are the displacements at the corresponding positions of the driven device (the same expressions are used in the later sections).
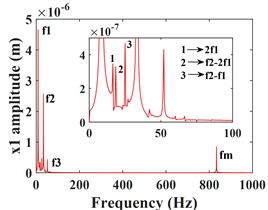
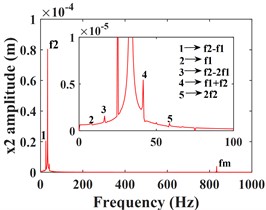
As can be seen from Fig. 4, the time domain characteristics of the vibrations of the driving gear (Fig. 4(a-c)) and the corresponding bearing (Fig. 4(g-i)) in the -, - and -directions show significant differences. the amplitude and principal frequency components of the vibrations in the -direction are significantly larger than those in the - and -directions. From the spectrograms corresponding to the driving gear (Fig. 4(d-f)) and the bearing position (Fig. 4(j-l)) it can be seen that the main frequency of the vibration in the - and -directions is the driving shaft rotation frequency component (/60 = 8.3 Hz), while the main frequency in the -direction is the driven shaft rotation frequency component (/60 = 33.3 Hz), due to coupling effects, both transverse and axial vibrations contain both frequency components. In addition, the variable stiffness frequency (52 Hz) of the bearing appears in the -direction of the driving gear and bearing, but is not evident in the other two directions. At the same time, complex frequency components are exhibited in the -, - and -directions, in addition to the combined frequency components (16.7 Hz), (25 Hz), (58.3 Hz) with multiplies frequency (16.7 Hz) and other components, the high frequency component (meshing frequency /60 = 833.3 Hz) was also found, but this frequency component was not as strong as and . From the previous analysis, it can be seen that the vibration frequencies of the system in the three directions are mainly expressed as the low-speed shaft rotation frequency , the high-speed shaft rotation frequency and the gear meshing frequency .
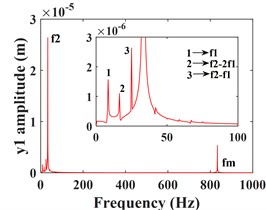
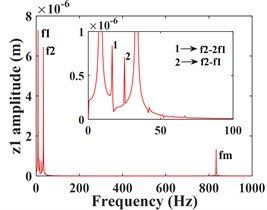
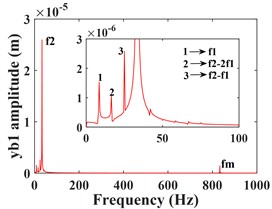
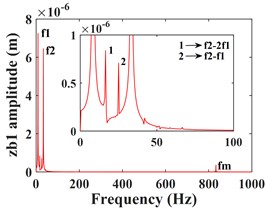
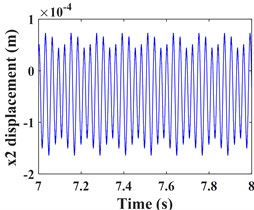
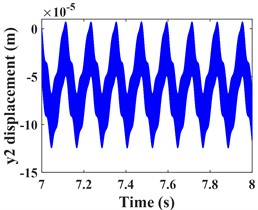
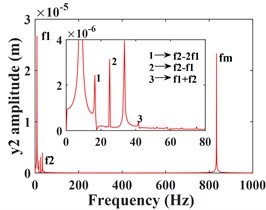
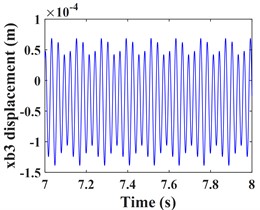
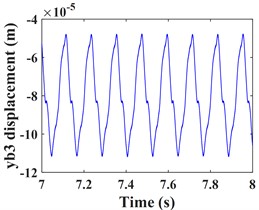
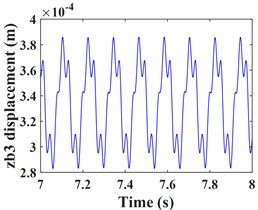
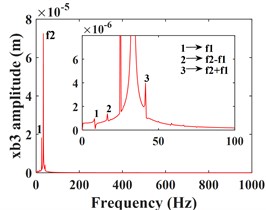
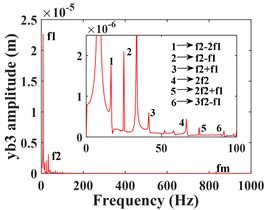
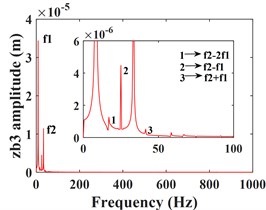
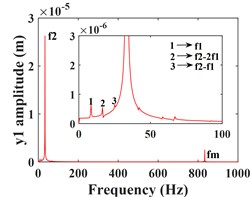
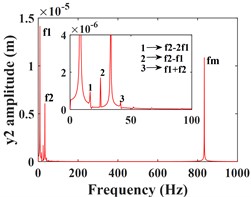
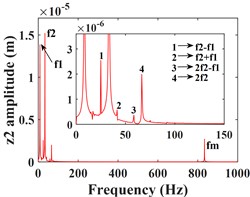
Fig. 5 shows the vibration response of the driven gear (Fig. 5(a-c)) and the bearing position (Fig. 5(g-i)). It can be seen that compared to the driving gear, the amplitude of the driven gear becomes larger in the -, - and -directions, and the change in the -direction is very significant, the vibration waveform in -direction becomes very complex and the vibration amplitude is still larger than that in - and -directions, which is consistent with that of the driving gear, mainly due to the meshing form of the helical gear and the established coordinate system. According to the spectrograms corresponding to the time domain response (Fig. 5(d-f)) and (Fig. 5(j-l)), it can be seen that the vibrations in the - and -directions are dominated by , and in the -direction, is the dominant frequency. In addition to and , the -direction of the driven gear exhibits a stronger meshing frequency compared to each direction of the main gear, and the frequency components become more complex. For example, combined frequencies appear in all three directions, and more complex components such as combined frequencies , , and multiplication frequency appear in the -direction.
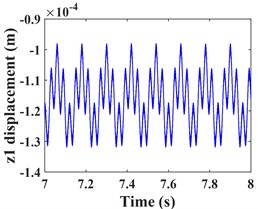
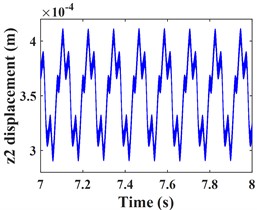
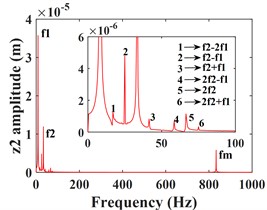
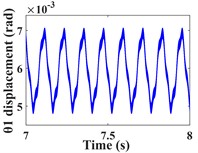
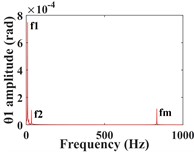
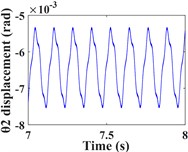
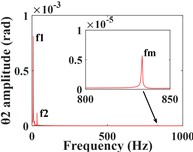
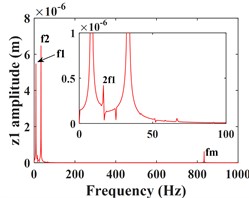
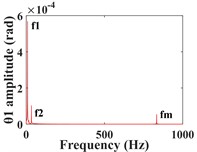
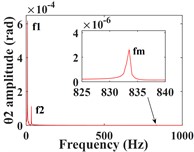
Fig. 6 shows the time domain (Fig. 6(a-b)) and frequency domain responses (Fig. 6(c-d)) of the driving and driven gears in the torsional direction. From the time domain response, it can be seen that the torsional vibration of the driving gear is positive, while the opposite is true for the driven gear, this is caused by the meshing force of the driving and driven gear as a pair of action and reaction forces. In addition, the amplitude of the torsional vibration of the pinion shaft is slightly larger due to its smaller torsional stiffness (= 1.5×10⁸ N/m). In the frequency domain response, both are mainly represented by the shaft rotation frequencies , and the mesh frequency components of the gears, and both have the low-speed shaft rotation frequency as the dominant frequency.
From the previous analysis, it can be seen that the gears and bearings in the HGRBS system exhibit different vibration response characteristics in the transverse and axial directions, in addition to the frequency of the rotating shaft and the meshing frequency component of the gear, variable stiffness frequencies caused by rolling bearings appear in individual directions and complex combined frequency components as well as multiplicative frequency components also appear in transverse and axial vibration, and the vibration frequency in the torsion direction is relatively simple. It is clear that the system studied in this paper is very complex. Therefore, in order to have a detailed understanding of the dynamic characteristics of this complex transmission system, it is necessary to carry out an in-depth study of the influence of each key parameter on the system. The effects of input torque, transmission error and variation of tooth side clearance on the vibration response will be discussed later.
Fig. 4Transverse and axial time/frequency domain response of driving gears and bearing Ⅰ; a)-c) is driving gear time domain waveform, d)-f) is the diving gear spectrogram; g)-i) is the time domain waveform of bearing Ⅰ, j)-l) is the spectrogram of bearing Ⅰ
a)
b)
c)
d)
e)
f)
g)
h)
i)
j)
k)
l)
Fig. 5Transverse and axial time/ frequency domain response of driven gears and bearing Ⅲ; a)-c) is driven gear time domain waveform; d)-f) is the driven gear spectrogram; g)-i) is the time domain waveform of bearing Ⅲ; j)-l) is the spectrogram of bearing Ⅲ
a)
b)
c)
d)
e)
f)
g)
h)
i)
j)
k)
l)
Fig. 6Torsional time/ frequency domain response of driving/driven gears; a)-b) is the time domain waveform and spectrum of driving gear; c)-d) is the time domain waveform and spectrum of driven gear
a)
b)
c)
d)
3.2. Effect of input torque on vibration response of HGRBS system
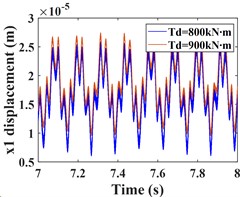
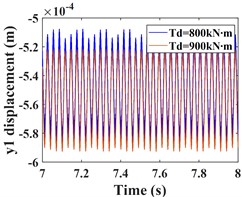
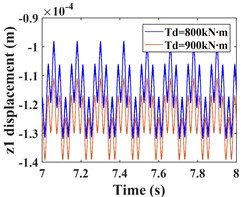
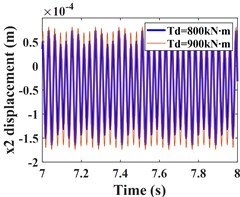
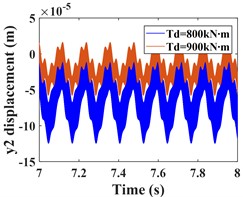
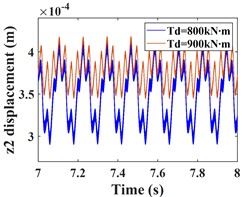
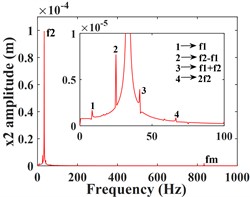
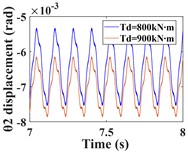
This subsection focuses on the effect of the variation of the input torque on the response of the system vibration. Increasing the input torque from 800 kN∙m to 900 kN∙m, the comparative of the time-domain response of the system at different torques, and the frequency-domain response of the system a torque of 900 kN∙m are shown by Fig. 7 and Fig. 8, respectively. The time domain waveforms in Fig. 7(a-c) and Fig. 8(a-c) show that the amplitude of the driving gear vibration changes less significantly as the input torque changes, however, the amplitude of the driven gear vibration decreases significantly in the - and -directions, and the vibration waveforms of the driving/driven gears remain almost identical in all directions. From the corresponding spectrogram (Fig. 7(d-f)), it can be seen that for the driving gear, the dominant frequency in the -direction is still , and the main frequency components are still , and , and the magnitude of the frequencies is almost constant, in this direction there are still combination frequencies (, ...), the bearing variable stiffness frequency and the multiplication frequency , but, the magnitude of the combined and multiplication frequencies in this direction is reduced compared to = 800 kNm. In the y-direction, the frequency components are almost constant. In the -direction, the dominant frequency changes from to , but the magnitude of the frequency amplitude between and does not differ much. The spectrogram of the driven gear vibration is shown in (Fig. 8 (d-f)). In the -direction of the driven gear, the amplitudes of and increase slightly, but the frequencies of each combination decrease significantly. In the -direction, the amplitudes of and decrease nearly two times, and the amplitude of increases slightly, but the amplitudes of all other frequencies decrease significantly. In the -direction, the amplitudes of frequencies and decrease nearly three times, the amplitude of increases slightly, and the amplitude of is smaller than that of , which is consistent with the driving gear, and the dominant frequency in this direction also has changed to . The frequency of each combination in the -direction decreases nearly two times, and some complex combination frequencies (such as ) disappear.
Fig. 7Comparison of driving gear time domain waveforms at Td = 800, 900 kN∙m and the frequency spectrum at Td = 900 kN∙m; a)-c) is the comparison of driving gear time domain waveforms; d)-f) is the spectrum of driving gear
a)
b)
c)
d)
e)
f)
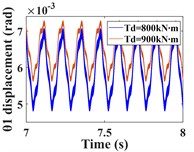
Fig. 9 shows the vibration response of the gear in the torsional direction, the amplitudes of the driving and driven gears in the twisting direction decreased significantly as the input torque of the system increased, but the waveforms did not change significantly. In addition, by comparing the frequency domain plots of torsional vibration in 3.1 (Fig. 6), it can be seen that the frequency components do not change, but the amplitude of and the amplitude of decrease significantly, but remains almost unchanged.
From the previous analysis, it can be seen that the increase of input torque has less significant effect on the transverse and axial vibration of the driving gear. However, the transverse and axial of the driven gear, the amplitude and the main frequency of the torsional direction of the driving/driven gear are significantly reduced. To further discuss the effect of input torque on the gear system response, this parameter is discussed in detail below.
Fig. 8Comparison of the time-domain waveforms of the driven gear at Td = 800, 900 kN∙m, and the frequency spectrum at Td = 900 kN∙m; a)-c) is the comparison of driven gear time domain waveforms; d)-f) is the spectrum of driven gear
a)
b)
c)
d)
e)
f)
Fig. 9Comparison of time domain waveforms in the direction of driving/driven gear rotation at Td = 800, 900 kN∙m and the frequency domain response at Td = 900 kN∙m; a)-b) is the time domain waveform and spectrum of driving gear; c)-d) is the time domain waveform and spectrum of driven gear
a)
b)
c)
d)
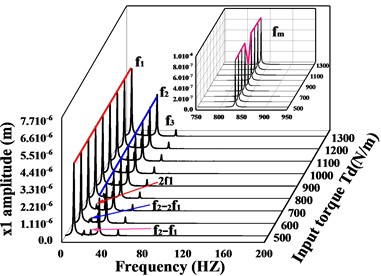
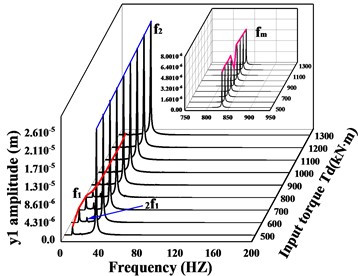
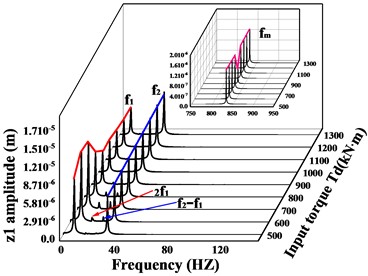
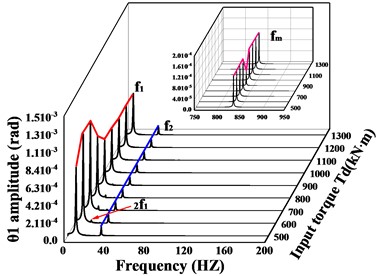
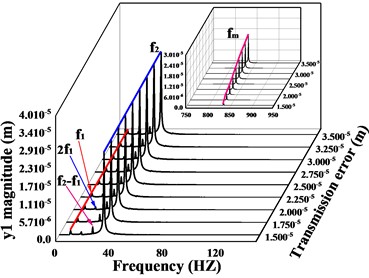
In the previous paragraph, the vibration response of the transmission system under two operating conditions with input torque of = 800 kN∙m and = 900 kN∙m were compared and analyzed respectively. To better learn the effect of input torque on the system response, the spectral waterfall plots of the driving and driven gears in the -, -, - and -directions respectively, are given in Figs. 10-11 when the input torque increases (the waterfall plot only gives the frequencies of the main bands and the local zoomed-in plot of). From Fig. 10(a-f), it can be seen that the frequency of the driving/driven gears changes significantly as the input torque increases, and the meshing frequency of the driving/driven gears in all directions reaches a minimum value at = 900 kN∙m ( = 225 kN∙m). Fig. 10(a, c, e) shows the vibration response of the driving gear in -, -, and -directions respectively. For the -direction of the driving gear, the variation of frequencies other than the meshing frequency is quite insignificant. In the -direction, firstly, the amplitude of increases with the increase of input torque, then decreases, and finally remains stable, reaching the maximum value at = 700 kN∙m, the multiplier frequency changes in a trend of increasing and then decreasing. In the -direction, the changes of , and are basically the same as those in the y-direction, but the dominant frequency changes. When is less than 800 kN∙m, the dominant frequency is , and when is greater than this value, the amplitude of the rotational frequency of the high-speed axis is greater than , and the dominant frequency changes to .
Fig. 10Spectral waterfall of transverse and axial vibration of driving/driven gear with varying input torque; a), c) and e) is the spectral waterfall of the driving gear in the transverse and axial directions; b), d) and f) is the spectral waterfall of the driven gear in the transverse and axial directions
a)
b)
c)
d)
e)
f)
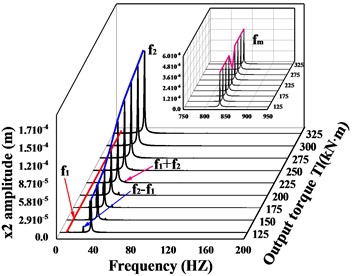
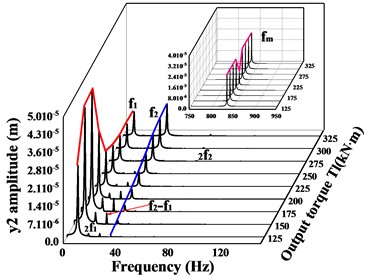
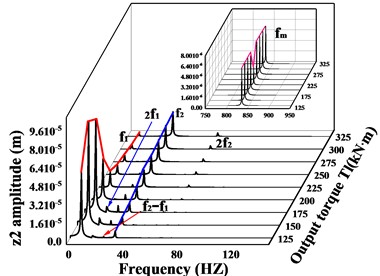
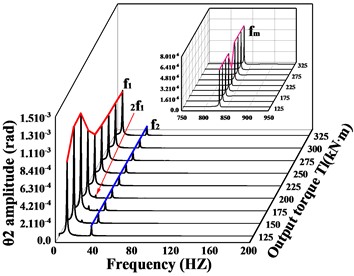
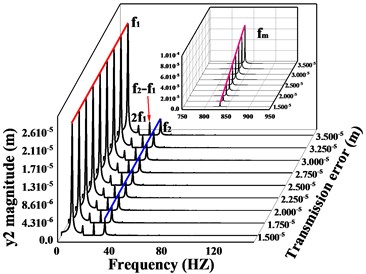
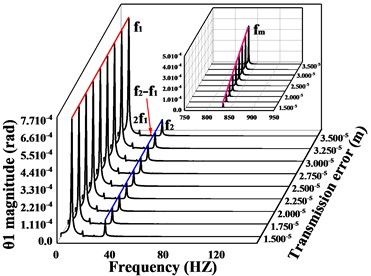
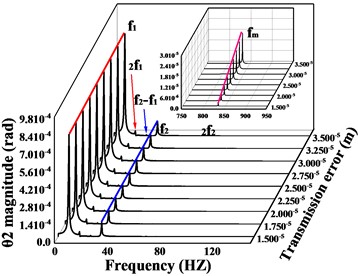
For the driven gear (Fig. 10(b, d, f)), the amplitude of the frequency increases monotonically with increasing input torque. In the -direction, is always the dominant frequency in this direction, and the change trend of is not obvious, which is consistent with the -direction of the active gear. The -direction and -direction are the same, and the trend of amplitude both increases and then decreases before leveling off, reaching the maximum value when = 175 kN∙m ( = 700 kN∙m), and when the output torque ≤ 225 kN∙m ( ≤ 1100 kN∙m), is the dominant frequency, and is the dominant frequency when it is greater than this value. The multiplication frequency and each combination frequency are increasing and then decreasing, and the multiplication frequency is monotonically increasing. In the torsion direction (Fig. 11(a-b)), the frequency amplitude of the driving/driven gears at each location changes the same, the amplitude of the rotational frequency increases then decreases and finally remains stable and unchanged, the change of the rotational frequency is not obvious, and the amplitude of the frequency is always larger than .
In conclusion, as the input torque increases, both gears in the -direction exhibit the rotational frequency component of their rotary axis as the dominant frequency. Both gears in the torsion direction reflect as the dominant frequency. In the -direction, when ≤ 900 kN∙m ( ≤ 225 kN∙m), the two gears are dominated by the rotational frequency not of their axis of rotation, but the rotational frequency component of their axis is not very weak, and when > 900 kN∙m ( > 225 kN∙m), the dominant frequency in the -direction of the driven gear changes to the rotation frequency of its shaft. In the -direction, when ≤ 900 kN∙m ( ≤ 225 kN∙m) the component is the dominant frequency. However, when > 900 kN∙m ( > 225 kN∙m), the dominant frequencies in the -direction of the driving and driven gear change from the previous to . The amplitude of the meshing frequency in all directions of gears changes abruptly at = 900 kN∙m ( = 225 kN∙m) and reaches a minimum value. There is no uniform variation in the other frequency components.
Fig. 11Spectral waterfall plot of driving/driven gear torsional vibration with varying input torque; a) is the spectral waterfall of the driving gear in the torsional direction; b) is the spectral waterfall of the driven gear in the torsional direction
a)
b)
3.3. Effect of transmission error on vibration response of HGRBS system
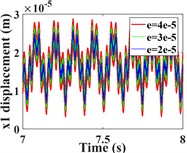
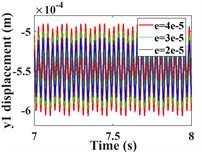
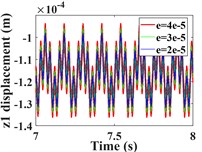
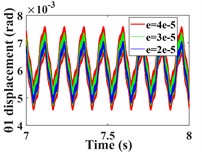
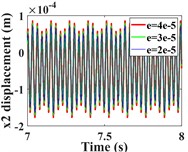
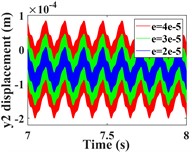
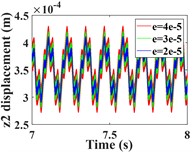
This section focuses on analyzing the effect of transmission error on the vibration response of the system. First, the vibration response of the system is calculated for transmission errors of 2e-5, 3e-5 and 4e-5m, respectively. A comparison of the time-domain response of the vibration is shown in Fig. 12, and the spectral waterfall plot is shown in Fig. 13 (the 2D spectral plot is not given in this subsection, and the frequency amplitude change is analyzed directly in conjunction with the spectral waterfall plots of the gear in the y- and torsion directions, which are the same in all the subsequent sections). From Fig. 12(a-c, e-g), it can be seen that the transverse and axial amplitudes of the driving/driven gears increase significantly with the increase of transmission error, and the vibration waveforms are always consistent, but the harmonic components in the -direction of the driven gears become obviously complex.
Fig. 12Comparison of time domain response of driving/driven gear vibration for different transmission errors; a)-b) is time domain waveforms in the x-, y-, z- and θ-directions of the driving gear; e)-h) is time domain waveforms in the x-, y-, z- and θ-directions of the driven gear
a)
b)
c)
d)
e)
f)
g)
h)
Fig. 13Spectral waterfall of vibration in the transverse, axial and torsional directions of the driving/driven gears for variations in transmission errors; a) and c) are the spectral waterfall plots of the driving gear in the y-direction and torsion direction, respectively; b) and d) are the spectral waterfall plots of the driven gear in the y-direction and torsion direction, respectively
a)
b)
c)
d)
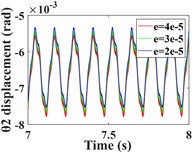
From the torsional vibration of the gears in Fig. 12(d, h), it can be seen that with the increase of transmission error, the amplitude of the driving gear increases significantly, and the vibration time-domain waveform becomes more complex, but the vibration amplitude of the driven gears does not change much. The spectral waterfall plot of the gear in each direction is obtained by varying the magnitude of the transmission error (Fig. 13). In Fig. 13, it is obvious that as the gear transmission error increases, the magnitude of the is proportional to it, and by referring to the spectrum plot in 3.1 (= 2e-5m), it can be seen that the increase or decrease of the gear transmission error has no obvious effect on the frequency amplitude other than , and the components of each order of frequency do not change significantly. Combined with the time domain response diagram of the gear, the trend of the amplitude change of the gear vibration is consistent with the trend of the amplitude change of the gear meshing frequency. This shows that the transmission error of the gear only affects , and the other frequency components are not sensitive to it. From the previous analysis, we can see that the increase of error will lead to the increase of gear vibration amplitude. Therefore, the gear transmission error should be reduced as much as possible during the manufacturing process to avoid serious vibration and failure of the gear system.
3.4. Effect of tooth side clearance on the vibration response of HGRBS system
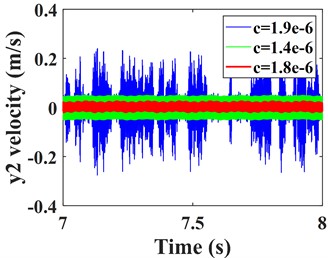
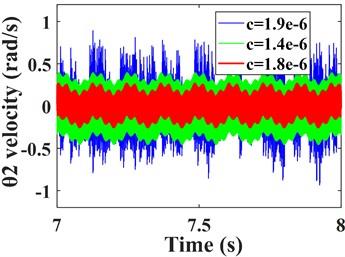
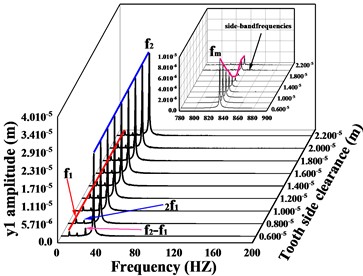
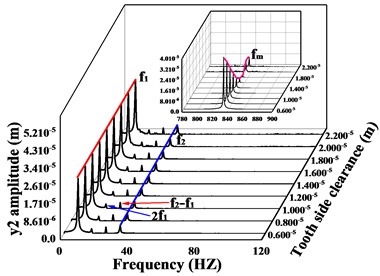
In this section, the effect of variation of tooth side clearanceon the vibration response of the transmission system is investigated and analyzed. The vibration response of the system is solved for the tooth side clearance of 1.4×10⁻⁶m, 1.8×10⁻⁶m and 1.9×10⁻⁶m, respectively. The velocity-time comparison of the -direction and torsion direction of the driven gear for different is shown in Fig.14, and the spectral waterfall is shown in Fig. 15.
Fig. 14Comparison of time domain response of driven gear vibration with different tooth side clearances; a) and b) are the time-domain waveforms in the y- and torsion directions of the driven gears respectively
a)
b)
As shown in Fig. 14, as the tooth side clearance increases, the vibration speed of the gear first decreases, and then the vibration undergoes a sudden change and the vibration speed increases sharply. It can be seen from Fig. 15 that with the increase of tooth side clearance, the gear meshing frequency and time domain response change the same law, also showed a trend of decreasing and then increasing, when the tooth side clearance = 1.8e-6 m, meshing frequency reaches the minimum value, but when the tooth side clearanceexceeds 1.8e-6 m, a significant sideband frequency is generated near the meshing frequency, which is caused by the increase in the impact excitation of gear meshing when the tooth side clearance of the gear is too large, thus leading to a surge in the vibration amplitude of the gear in all directions. The size of the tooth side clearance obviously affects the vibration of the gear, therefore, the gear tooth side clearance should be selected reasonably. Based on the above analysis, there is a certain relationship between the mesh frequency amplitude of gears and the trend of vibration amplitude, but whether the gear vibration amplitude reaches the minimum when the mesh frequency is smallest is to be determined. In order to investigate the connection between the two, the effect of gear mesh frequency on gear vibration under different parameters will be analyzed later.
Fig. 15Spectrum waterfall of driving/driven gears in transverse, axial and torsional directions during Tooth side clearance changes; a) and c) are the spectral waterfall plots of the driving gear in the y-direction and torsion direction, respectively; b) and d) are the spectral waterfall plots of the driven gear in the y-direction and torsion direction, respectively
a)
b)
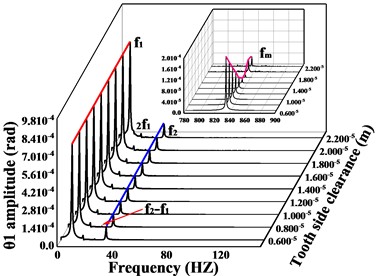
c)
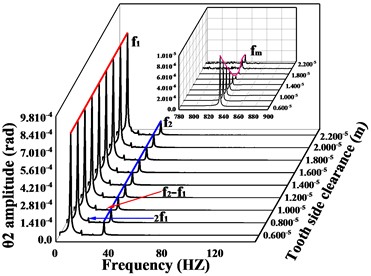
d)
3.5. Effect of gear meshing frequency on the response amplitude of a gear train
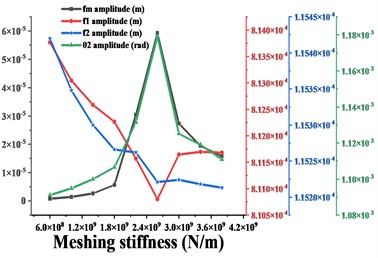
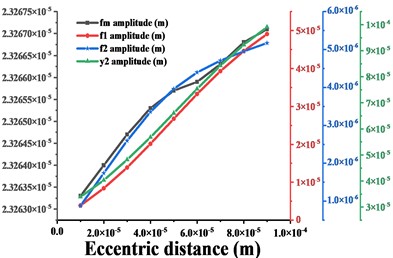
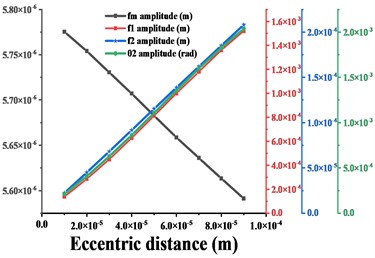
From the analysis in sections 3.3 to 3.4 of this paper, it can be seen that both the meshing frequency and the vibration amplitude of the gear increase monotonically with the increase of the error. As the tooth side clearanceincreases, the trend of the gear amplitude is synchronized with the trend of . Next, we will explore the relationship between the amplitude trends of the gears and the amplitude trends of the major frequencies (include , and ). Firstly, based on the results in Sections 3.2 to 3.4, the amplitude variation curves of , , and the amplitude variation curves of time domain waveforms of the driven gears are deduced for different excitation changes, and the results are compared in Figs. 16-18. In order to fully explore this problem, we will consider changes in the other excitations of the gear system. Firstly, the average meshing stiffness of the gear is increased from 6e8 N/m to 3e9 N/m, and then the eccentricityof the gear is increased from 1e-5m to 9e-5m. The vibration response of the system under the above two excitations is solved and the variation of its major frequency amplitude and the variation of the amplitude of the time domain waveforms in the y-direction and torsion direction are obtained, respectively, and the results are shown in Figs. 19-20.
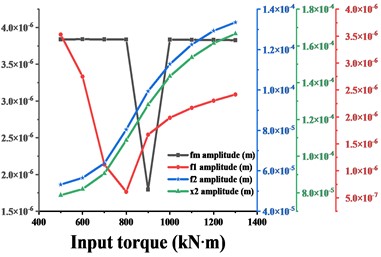
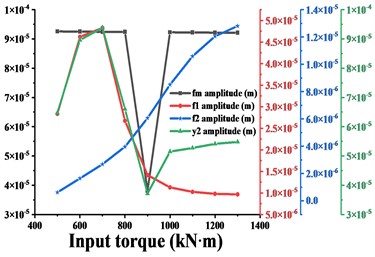
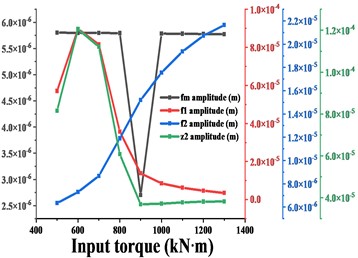
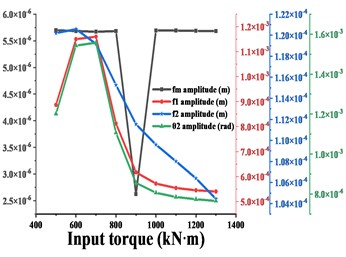
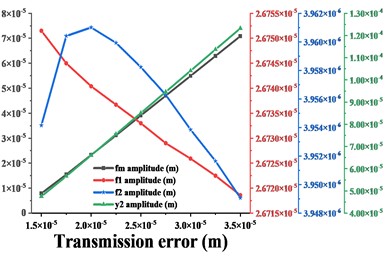
Fig. 16 shows the variation of vibration amplitude in each direction of the driven gear and the variation of amplitude of , , when the input torque is from 500 kN∙m to 1300 kN∙m. From the conclusion 3.2, it can be seen that the dominant frequency in the -direction of the driven gear is always , and the frequency increases monotonically, which is consistent with the trend of the amplitude curve in this direction. When < 900 kN∙m, the dominant frequency in - and - direction is , before = 900 kN∙m, the trend of amplitude curve in this direction is consistent with , when > 900 kN∙m, the dominant frequency in this direction is , then the trend of amplitude curve in this direction is consistent with . The dominant frequency in the torsional direction is always , and the trend of the amplitude curve is always consistent with . In short, as the input torque increases, the amplitude of the gear in each direction has the same trend as the dominant frequency in that direction. As shown in Fig. 17-20, (except for the torsional excitation, the differences in the vibration response of the gears in the all directions due to other excitation variations are not significant, so only the results in the - and torsional directions are given) the variation of , , of the gear system and the variation of vibration amplitude in - and torsion direction of the gear are compared for different transmission errors, tooth side clearance, average values of meshing stiffness and eccentricity respectively. As shown in Fig. 17, with the increase of gearing error, the vibration amplitude in - and torsion direction of the gear is synchronized with the amplitude of the meshing frequency in that direction, and they all tend to increase monotonically. As shown in Fig. 18, with the increase of tooth side clearance, the vibration amplitude of gears in - and torsion directions and the change of meshing frequency are decreasing first and then increasing, and reach the minimum value at = 1.8e-5 m.
Fig. 16a)-d) are respectively the amplitudes of the driven gears in x-, y-, z- and torsional directions compared with the amplitudes of fm, f1, f2 in the corresponding directions for different input torques Td
a)
b)
c)
d)
As shown in Fig. 19, with the increase of meshing stiffness, the vibration amplitude of - and torsion direction of the gear is consistent with the amplitude of the meshing frequency in that direction, and the trend is first increasing and then decreasing, and the minimum value is taken at = 5e8 N/m; the maximum value is taken at = 2.5e9 N/m. Thus, the traditional belief that the greater the gear mesh stiffness gear, the smaller the vibration of the gear system, the more stable the operation is incorrect. As shown in Fig. 20, the vibration amplitudes of , , of the gear system vary with - and torsion direction of the gear when the gear eccentricity is 1e-5 m to 9e-5 m. It can be seen from the figure that the variation of the amplitude of the gears in - and torsion direction is consistent with the variation of the main frequency amplitude in its corresponding direction, which all show a monotonic upward trend.
Fig. 17a)-b) are respectively the amplitudes of the driven gears in y- and torsional directions compared with the amplitudes of fm, f1, f2 in the corresponding directions for different transmission error e
a)
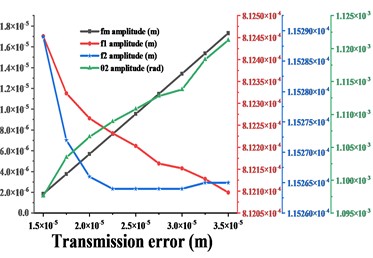
b)
Fig. 18a)-b) are respectively the amplitudes of the driven gears in y- and torsional directions compared with the amplitudes of fm, f1, f2 in the corresponding directions for different tooth side clearance c
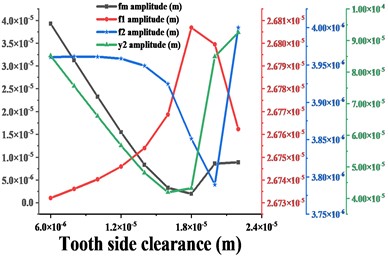
a)
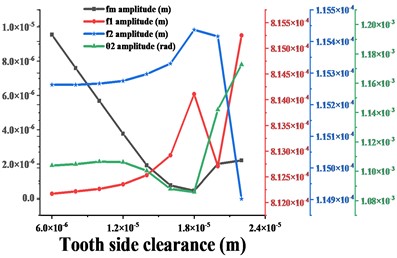
b)
Fig. 19a)-b) are respectively the amplitudes of the driven gears in y- and torsional directions compared with the amplitudes of fm, f1, f2 in the corresponding directions for different mean meshing stiffness km
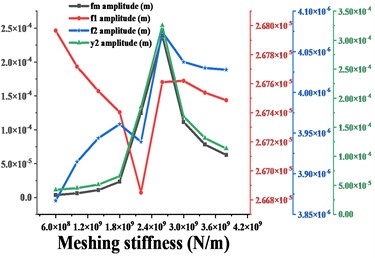
a)
b)
In summary, the input torque and gear eccentricity are the external excitations affecting the gear set, while the transmission error, meshing stiffness and tooth side clearance are the internal excitations of the gear set. From the above analysis, it can be seen that the change of vibration in each direction of the gear caused by the change of the external excitation of the gear set is synchronized with the trend of the change of the main frequency amplitude in the corresponding direction, while the change of vibration in each direction of the gear caused by the change of the internal excitation of the gear set is consistent with the trend of the change of the mesh frequency amplitude in the corresponding direction. Therefore, in the gear design, we can avoid the gear to be at the vibration peak according to this change law.
Fig. 20a)-b) are respectively the amplitudes of the driven gears in y- and torsional directions compared with the amplitudes of fm, f1, f2 in the corresponding directions for different eccentric distance ρ
a)
b)
4. Conclusions
In order to study the effect of several important excitations on the response of the gear rotating system and to analyze the relationship between the trend of amplitude change in each direction of the helical gear and the trend of amplitude change in several important frequencies in that direction when the internal and external excitations change, this paper establishes a dynamics model of the Multi-degree-of-freedom helical gear-rotor-bearing transmission system using the lumped parameter method, taking into account the time-varying meshing stiffness, comprehensive transmission error, tooth side clearance, gear eccentricity and non-linear support force of angular contact ball bearings, and solves the dynamics response of the system based on the Runge-Kutta method, and the results show the following:
1) The vibration amplitude in the -direction of the system is significantly larger than that in the - and -directions, while the vibration in the direction of torsion is significantly larger than that in the transverse and axial directions, so the system is dominated by torsional vibration. The main frequencies of the system include the low-speed shaft rotation frequency , the high-speed shaft rotation frequency and the engagement frequency , and the above frequencies are present in each direction.
2) With the increase of input torque , the vibration amplitude of the driving/driven gears decreases except for the -direction, and the amplitude of the driven gears decreases very significantly, and the low-speed shaft rotation frequency in individual directions decreases significantly, and changes from as the dominant frequency to the high-speed shaft rotation frequency as the dominant frequency. The combination frequency of gear vibration in each direction is significantly reduced, and some complex combination frequencies even disappear.
3) Gear transmission errors and changes in tooth side clearance have a significant effect on the amplitude of gear vibration, but the effect on other frequencies at various points in the gear is not significant, except for a significant effect on the meshing frequency.
4) The relationship between the change trend of the gear vibration amplitude and the change trend of the main frequency amplitude in each direction of the gear was analyzed. The results show that the change trend of vibration amplitude in each direction of the gear caused by the change of external excitation of the gear system is synchronized with the change trend of the main frequency amplitude in the corresponding direction; while the change trend of vibration amplitude in each direction of the gear caused by the change of internal excitation of the gear system is consistent with the change trend of the mesh frequency amplitude in the corresponding direction. The research results can provide reference for the design of gear set parameters.
References
-
Z. Wan, Y. Dou, H. Li, and X. Wei, “Modeling and vibration analysis of a gear rotor-bearing system with a shaft crack,” Journal of Failure Analysis and Prevention, Vol. 21, No. 2, pp. 610–618, Apr. 2021, https://doi.org/10.1007/s11668-020-01090-7
-
H. N. Özgüven, “A non-linear mathematical model for dynamic analysis of spur gears including shaft and bearing dynamics,” Journal of Sound and Vibration, Vol. 145, No. 2, pp. 239–260, Mar. 1991, https://doi.org/10.1016/0022-460x(91)90590-g
-
A. Kahraman and R. Singh, “Non-linear dynamics of a geared rotor-bearing system with multiple clearances,” Journal of Sound and Vibration, Vol. 144, No. 3, pp. 469–506, Feb. 1991, https://doi.org/10.1016/0022-460x(91)90564-z
-
M. Kubur, A. Kahraman, D. M. Zini, and K. Kienzle, “Dynamic analysis of a multi-shaft helical gear transmission by finite elements: model and experiment,” Journal of Vibration and Acoustics, Vol. 126, No. 3, pp. 398–406, Jul. 2004, https://doi.org/10.1115/1.1760561
-
L. Walha, T. Fakhfakh, and M. Haddar, “Nonlinear dynamics of a two-stage gear system with mesh stiffness fluctuation, bearing flexibility and backlash,” Mechanism and Machine Theory, Vol. 44, No. 5, pp. 1058–1069, May 2009, https://doi.org/10.1016/j.mechmachtheory.2008.05.008
-
C. H. Kang, W. C. Hsu, E. K. Lee, and T. N. Shiau, “Dynamic analysis of gear-rotor system with viscoelastic supports under residual shaft bow effect,” Mechanism and Machine Theory, Vol. 46, No. 3, pp. 264–275, Mar. 2011, https://doi.org/10.1016/j.mechmachtheory.2010.11.011
-
H. Gao and Y. Zhang, “Nonlinear behavior analysis of geared rotor bearing system featuring confluence transmission,” Nonlinear Dynamics, Vol. 76, No. 4, pp. 2025–2039, Jun. 2014, https://doi.org/10.1007/s11071-014-1266-8
-
C.-F. Li, S.-H. Zhou, J. Liu, and B.-C. Wen, “Coupled lateral-torsional-axial vibrations of a helical gear-rotor-bearing system,” Acta Mechanica Sinica, Vol. 30, No. 5, pp. 746–761, Oct. 2014, https://doi.org/10.1007/s10409-014-0063-4
-
Z. Hu, J. Tang, J. Zhong, S. Chen, and H. Yan, “Effects of tooth profile modification on dynamic responses of a high speed gear-rotor-bearing system,” Mechanical Systems and Signal Processing, Vol. 76-77, pp. 294–318, Aug. 2016, https://doi.org/10.1016/j.ymssp.2016.01.020
-
S. Zhou, G. Song, Z. Ren, and B. Wen, “Nonlinear dynamic analysis of coupled gear-rotor-bearing system with the effect of internal and external excitations,” Chinese Journal of Mechanical Engineering, Vol. 29, No. 2, pp. 281–292, Mar. 2016, https://doi.org/10.3901/cjme.2015.1019.124
-
S. Zhou, G. Song, M. Sun, and Z. Ren, “Nonlinear dynamic response analysis on gear-rotor-bearing transmission system,” Journal of Vibration and Control, Vol. 24, No. 9, pp. 1632–1651, May 2018, https://doi.org/10.1177/1077546316667178
-
L. Xiang and N. Gao, “Coupled torsion-bending dynamic analysis of gear-rotor-bearing system with eccentricity fluctuation,” Applied Mathematical Modelling, Vol. 50, pp. 569–584, Oct. 2017, https://doi.org/10.1016/j.apm.2017.06.026
-
X. Lu et al., “Effects of misalignment on the nonlinear dynamics of a two-shaft rotor-bearing-gear coupling system with rub-impact fault,” Journal of Vibroengineering, Vol. 19, No. 8, pp. 5960–5977, Dec. 2017, https://doi.org/10.21595/jve.2017.18476
-
A. Tatar, C. W. Schwingshackl, and M. I. Friswell, “Dynamic behaviour of three-dimensional planetary geared rotor systems,” Mechanism and Machine Theory, Vol. 134, pp. 39–56, Apr. 2019, https://doi.org/10.1016/j.mechmachtheory.2018.12.023
-
C. R. Lu, Y. N. Li, and Z. C. Dou, “Nonlinear vibration characteristics of bending-torsional coupling of gear rotor-bearing system,” Journal of Vibration Engineering, Vol. 31, No. 2, pp. 238–244, 2018, https://doi.org/10.16385/j.cnki.issn.1004-4523.2018.02.006
-
J. Liu, W. Zhao, and W. Liu, “Frequency and vibration characteristics of high-speed gear-rotor-bearing system with tooth root crack considering compound dynamic backlash,” Shock and Vibration, Vol. 2019, pp. 1–19, Nov. 2019, https://doi.org/10.1155/2019/1854263
-
W. Lu, Y. Zhang, H. Cheng, Y. Zhou, and H. Lv, “Research on dynamic behavior of multistage gears-bearings and box coupling system,” Measurement, Vol. 150, p. 107096, Jan. 2020, https://doi.org/10.1016/j.measurement.2019.107096
-
T. Ouyang, Z. Su, S. Li, G. Huang, and N. Chen, “Experimental and numerical investigations on dynamic characteristics of gear-roller-bearing system,” Mechanism and Machine Theory, Vol. 140, pp. 730–746, Oct. 2019, https://doi.org/10.1016/j.mechmachtheory.2019.06.034
-
S. Wang, R. Zhu, and Jinfeng, “Study on load sharing behavior of coupling gear-rotor-bearing system of GTF aero-engine based on multi-support of rotors,” Mechanism and Machine Theory, Vol. 147, p. 103764, May 2020, https://doi.org/10.1016/j.mechmachtheory.2019.103764
-
F. Huang, X. Wang, H. Fu, L. Sima, and Y. Cui, “Nonlinear vibration characteristics of gear-rotor-bearing system,” Journal of Physics: Conference Series, Vol. 2229, No. 1, p. 012002, Mar. 2022, https://doi.org/10.1088/1742-6596/2229/1/012002
-
J.-F. Shi, X.-F. Gou, and L.-Y. Zhu, “Five-state engaging model and dynamics of gear-rotor-bearing system based on time-varying contact analysis considering gear temperature and lubrication,” Applied Mathematical Modelling, Vol. 112, No. 1, pp. 47–77, Dec. 2022, https://doi.org/10.1016/j.apm.2022.07.028
-
M. Xu, Y. Han, X. Sun, Y. Shao, F. Gu, and A. D. Ball, “Vibration characteristics and condition monitoring of internal radial clearance within a ball bearing in a gear-shaft-bearing system,” Mechanical Systems and Signal Processing, Vol. 165, p. 108280, Feb. 2022, https://doi.org/10.1016/j.ymssp.2021.108280
Cited by
About this article

This research was funded by basic scientific research projects of
Liaoning Provincial Department of Education (JYTMS20230216), Liaoning Province Basic Research Projects of Higher Education Institutions (Grant No. LG202107), the construction plan of scientific research and innovation team of Shenyang Ligong University (SYLU202101).
The datasets generated during and/or analyzed during the current study are available from the corresponding author on reasonable request.
Hongyuan Zhang was mainly responsible for the organization and structure definition and provided the initial review of the contribution. Shuo Li was to the highest extent responsible for the draft version preparation, figures, and literature research. Xin Zhang introduced ideas, suggested the organization of the work, and was also responsible for proofreading.
The authors declare that they have no conflict of interest.
