Abstract
The sleeve grouting connection stands as a customary method for interlinking precast shear walls within assembly construction. In the realm of on-site construction, achieving complete avoidance of sleeve grouting defects remains a challenge. In an endeavor to scrutinize the seismic performance and the subsequent progression of damage within shear wall structures riddled with sleeve grouting defects, a two-story shear wall model was formulated through the utilization of ABAQUS software. Employing numerical simulation of low cycle reciprocating loading, the study was conducted across three distinct operational contexts: absence of defects, localized defects, and comprehensive defects. The outcomes proffer insight into the exacerbated concrete damage triggered by defects present within shear wall structures. These defects contribute to premature yielding of reinforcement and a consequent amplification in the plastic length of the reinforcement, consequently impeding the harmonized deformation of reinforcement and concrete. The “pinch phenomenon” is particularly conspicuous within fully defective structures during the nascent loading stages. As cyclic loads mount, the hysteretic curves of both defective and defect-free structure tend to converge. While the skeleton curve of structures, whether grouting defects are present or not, demonstrates remarkable parity prior to reaching the pinnacle reaction force, the defective structure displays premature waning in reaction force. This, in turn, curtails the efficacy of early warning concerning structural deformation and jeopardizes safety. In light of the foregoing analysis, it is manifest that the presence of sleeve grouting defects significantly impacts the seismic performance and subsequent damage trajectory of shear wall structures. As a corollary, addressing and mitigating these defects during on-site construction emerge as imperative prerequisites for upholding the comprehensive safety and stability of the structure.
1. Introduction
Prefabricated structures have gained widespread adoption due to their inherent advantages in terms of convenience and rapid construction. The design, processing, material grouting, and on-site installation of prefabricated components are often managed by distinct units. While specifications regulate the interconnections between these elements, certain uncontrollable factors can still exert an influence on the process. Among the methods employed to connect longitudinal reinforcements in prefabricated concrete structures, sleeve grouting stands out. This technique entails the insertion of ribbed reinforcements into metal sleeves, with force transmission achieved through the solidification of a grout mixture. The thoroughness of the grouting process plays a pivotal role in ensuring effective force transmission. Nonetheless, sleeve grouting remains a concealed procedure and is susceptible to certain limitations. Factors encompassing the quality of prefabricated parts, the sleeves themselves, the composition of grouting materials, on-site construction methodologies, and detection techniques can collectively contribute to potential deficiencies in grouting integrity. Consequently, the possible grouting defects introduce uncertain risks to structural safety.
Several scholars have directed their attention towards evaluating the performance of prefabricated shear wall structures with diverse connection types. Wu M. [1], for instance, conducted low cycle reciprocating loading tests on prefabricated short leg shear walls employing sleeve grouting connections. These tests demonstrated that the load-bearing capacity of each characteristic point within the prefabricated shear wall mirrors that of the cast-in-place shear wall, albeit with slightly diminished ductility and energy dissipation performance. The reliability of the sleeve grouting connection in shear walls was thereby substantiated. Jia L. G. [2] conducted low cycle reciprocating loading tests on cast-in-place shear wall specimens and two distinct prefabricated frame shear wall specimens assembled through varying schemes. These experiments probed the influence of different assembly methodologies on the hysteresis performance of grouted sleeve-connected frame shear wall structures. Jiang S. F. [3] introduced an innovative bolted composite shear wall, designed specimens and conducted loading tests to scrutinize the mechanical traits and shear strength of shear walls under this connection configuration.
In terms of numerical simulation of shear wall structures, İlker Kazaz [4], leveraging a 5-story reinforced concrete structure shake table test, constructed a finite element model to analyze a spectrum of responses. The outcomes demonstrated substantial coherence with the experimental findings. Furthermore, Buddika [5] carried out numerical simulation analyses of fabricated frame shear wall structures utilizing the OPENSEES computing platform. Ding M. J. [6] established and validated a finite element model for grouted sleeve precast concrete columns, undertaking thorough detailed parameter studies to dissect the seismic performance of these precast concrete columns. Notably, the Abquas software emerged as a robust tool boasting potent nonlinear functions and a distinctive concrete plastic damage model, facilitating the effective emulation of plastic damage in concrete structures subjected to low cycle reciprocating loading [7-12]. Therefore, this paper adopts Abquas software to simulate shear wall structures. In the context of studying seismic performance, low cyclic loading test have garnered prevalence as a conventional avenue for exploring the behavior of shear wall structures. of Experimental parameter selection is pivotal, with loading frequency informed by insights from vibration control research [13-15].
Considering the scrutiny of prefabricated shear walls afflicted by defects, Zhang X. H. [16] delved into the ramifications of diverse defect positions or quantities in the lower stratum of reinforced grouting sleeve connections on bearing capacity and stiffness through numerical simulation. Xiao S. [17] took a different approach, investigating the impact of sleeve grouting defects on the seismic performance of prefabricated shear walls through on-site cyclic loading test tests. While the above research largely focuses on individual walls, a dearth of research exists concerning the progression and evolution of damage.
At present, research concerning the seismic performance of prefabricated shear wall structures primarily revolves around comparative evaluations between cast-in-place and prefabricated shear wall configurations. However, a paucity of studies delves into the analysis of seismic performance and damage progression in shear walls harboring connection defects.
Within this study, we present a finite element model for an assembled shear wall featuring defective sleeve grout connections, subjecting it to seismic performance analysis. Notably, in the context of defect simulation, the method of serving holes to separate the reinforcement at the defect from the grooving material is proposed. The analysis outcomes stand to offer enhanced insights into the impact of defects on seismic performance of members. Additionally, the nuanced development of shear wall structural damage trends can be discerned. This endeavor holds promise in guiding related experimental research on shear wall structures. Ultimately, the simulation findings will illuminate the mechanisms underpinning the influence of sleeve grouting defects on the seismic performance of prefabricated shear walls.
2. Model configuration
2.1. Establishment of analytical model
The analytical model employed in this study revolves around a 2-story prefabricated shear wall structure. Engineered to withstand a seismic fortification intensity of 7, the building’s site classification is designated as class II, accompanied by a seismic grade II rating. The geometric characteristics of the shear wall structure, depicted in Fig. 1, encompass planar dimensions of 3420 mm × 6000 mm, with each floor boasting a height of 3000 mm.
2.2. Establishment of calculation analytical model
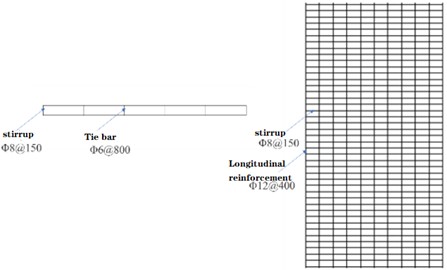
The analytical calculation model employed in this study revolves around on a 2-story prefabricated shear wall structure. Engineered the building to withstand a seismic fortification intensity of 7, the building’s site classification is designated as with a site classification of class II, accompanied by a seismic grade II rating. The geometric characteristics of the shear wall structure, depicted in Fig. 1, encompass planar dimensions of 3420 mm × 6000 mm, with each floor boasting a in planar size and have a floor height of 3000 mm. To connect with the lower structure, a reinforced concrete ground beam is positioned at the bottom. The concrete shear wall has a thickness of 210 mm, along with a protective layer thickness of 25 mm. The longitudinal reinforcement has a diameter of 12 mm and is spaced at intervals of 400 mm. Similarly, the stirrups have a diameter of 8 mm with a spacing of 150 mm. Additionally, tie bars with a diameter of 6 mm are installed between the longitudinal reinforcements, as illustrated in Fig. 2. The prestressed reinforcement has a diameter of 20 mm, while the grouting sleeve measures 400 mm in length and 60 mm in diameter.
Fig. 1Schematic representation of the shear wall structure
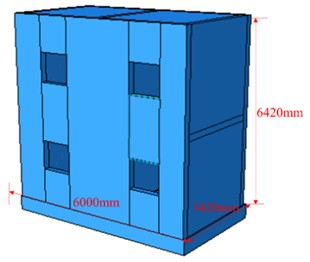
Fig. 2Reinforcing bar layout
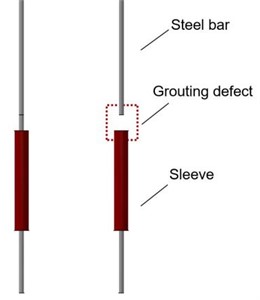
Considering that the grouting defect is a cylindrical cavity with a length of 64 mm, which is located at the upper end of the sleeve, where the concrete has no bonding effect with the prestressed reinforcement, as shown in Fig. 3.
The concrete utilized in the structure is C40 grade concrete, while the stirrups and tie bars are made of HRB300 reinforcement. The longitudinal reinforcements are made of HRB400 reinforcement. The fundamental properties of these materials are outlined in Table 1 for reference. A reinforced concrete ground beam resides at its base. The concrete shear wall exhibits a thickness of 210 mm, fortified by a protective layer measuring 25 mm in thickness. Longitudinal reinforcement components, fashioned with a 12 mm diameter, are spaced at 400 mm intervals. Complementary to this, stirrups, characterized by an 8 mm diameter, are situated at 150 mm intervals. Intertwining the longitudinal reinforcements are tie bars, elegantly portrayed in Fig. 2, bearing a diameter of 6 mm. Concurrently, the prestressed reinforcement element displays a diameter of 20 mm, while the grouting sleeve measures 400 mm in length and 60 mm in diameter.
Considering that the grouting defect manifests as a cylindrical cavity with a length of 64 mm, positioned at the upper extremity of the grouting sleeve. In this specific locale, the concrete's bond with the prestressed reinforcement is compromised, as depicted in Fig. 3.
Fig. 3Visualization of grouting defects within the structure
The structural components are assembled using C40 grade concrete, HRB300 reinforcement for stirrups and tie bars, and HRB400 reinforcement for longitudinal components. Pertinent material properties are concisely outlined in Table 1 for quick reference.
Table 1Essential material properties
Material | Modulus of elasticity (MPa) | Poisson's ratio | Yield stress (MPa) |
C40 concrete | 26589 | 0.2 | 40 |
HRB400 steel | 206000 | 0.3 | 400 |
HRB300 steel | 206000 | 0.3 | 300 |
2.3. Establishment of finite element model
The construction of the finite element model was executed in accordance with the dimensional specifications outlined above. The Concrete Plastic Damage Model (CDP Model) was employed to replicate the behavior of concrete materials. Notably, the CDP model adeptly captures the evolution of concrete damage across cyclic loading conditions. The simulation of steel components was realized through a double line model. The discretization of the model was achieved using distinct element types: the C3D8R solid element was chosen for both concrete and prestressed reinforcement, the S4R shell element for sleeves, and the T3D2 truss element for reinforcement cages. For shear walls afflicted with grouting defects, meticulous attention was given to the precise definition of void regions within the mesh.
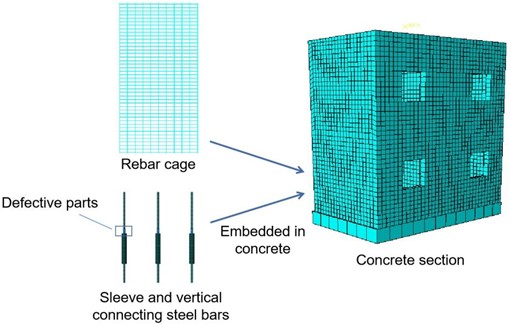
The assembly of the finite element model ingeniously incorporates the steel cage framework, sleeves, and interconnecting steel bars within the concrete wall matrix. In instances where sleeve grouting defects were simulated, material properties remained unspecified within the defective segment, deliberately disassociating it from the concrete matrix. In effect, this region assumed the role of a distinct defect. It is worth noting that the prestressed reinforcement within the flawed segment lacks any interaction with the adjacent concrete substrate. The schematic representation of this modeling process is visually expounded in Fig. 4.
Fig. 4Finite element model and modeling process
The overall structural configuration integrates the superstructure into a unified entity, anchored by the substructure's ground beam. The reinforcement elements and sleeves are integrated into the concrete. The model is categorized into two principal variants: those featuring comprehensive defects and those with partial defects. Specifically, the former exhibits seven defects on each side of the shear wall, while the latter displays three defects per side. These configurations are elucidated in Fig. 5.
Fig. 5Comparison of models with and without grouting defects
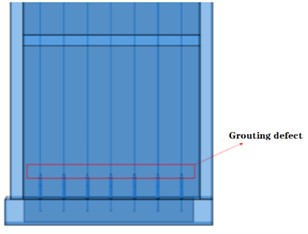
a) Model with comprehensive grouting defects
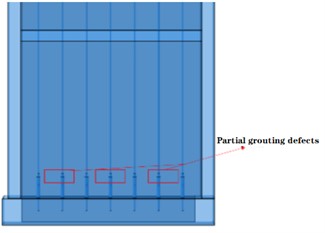
b) Model with partial grouting defects
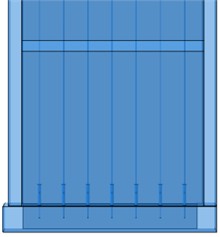
c) Model without grouting defects
3. Structural pseudo-static test simulation
3.1. Mode of structural loading
To investigate the impact of grouting defects on the overall structural stiffness and capacity for energy dissipation, analysis takes into account the angular displacement between elastic layers within distinct structures, as stipulated by the seismic design codes for buildings. The allowable displacement angle limit for concrete shear wall structures, as shown in Table 2, is set at 1/800. With the calculated model height of 6420 mm, this translates to a displacement limit of 8.025 mm for the uppermost section of the structure.
In the study, a displacement-controlled loading approach is employed. This allows for an exploration of the structure’s behavior beyond its elastic range. To enable this study, the peak loading amplitude is calibrated to 20 mm. Fixed constraints are imposed at the lowermost part of the structure. Furthermore, a coupling point is established at the model’s zenith to connect with the upper segment of the structure. At this coupling juncture, a reciprocating horizontal displacement (U1) is applied. The graphical representation of the loading protocol and the amplitude curve of displacement are elucidated in Fig. 6.
Table 2Limit of elastic interlayer displacement angle
Structure type | [] |
Reinforced concrete frame | 1/550 |
Reinforced concrete frame seismic wall, slab column seismic wall, frame core tube | 1/800 |
Reinforced concrete seismic wall, tube in tube | 1/1000 |
Reinforced concrete frame supporting layer | 1/1000 |
Multi storey and high-rise steel structure | 1/250 |
Fig. 6Schematic loading diagram and loading amplitude curve
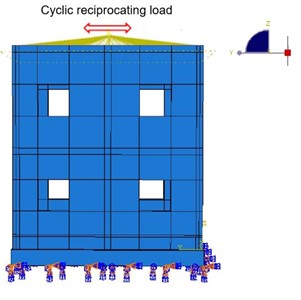
a) Loading diagram
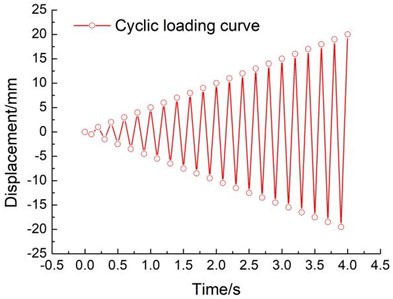
b) Loading amplitude curve
3.2. Analysis of concrete damage and reinforcement stress
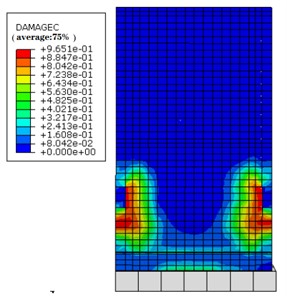
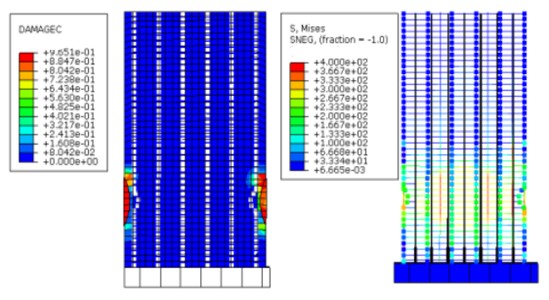
Fig. 7 and Fig. 8 illustrate the nephogram s depicting the extent of concrete compression damage within the overall structure, both with and without grouting defects, respectively. In the plastic damage model employed for concrete, the damage factor signifies the extent of material damage in a particular region. Examination of these figures underscores a substantial elevation in concrete compression damage within structures afflicted by grouting defects, when compared to their defect-free counterparts.
Significantly, alongside the pronounced compression damage observed around the window area, there is also a noticeable increase in concrete compression damage adjacent to the defective section. From a frontal perspective, it is evident that the left and right segments of the window experience relatively diminished stress, resulting in the most profound concrete compression failure. Notably, in the structure with grouting defects, the shear wall opposite the window has progressed to a state of complete failure, whereas the concrete aligned with the window in the defect-free structure remains partially unaffected. Overall, concrete damage primarily manifests in the bottom structure, as observed in the nephograms.
Fig. 7Nephogram of concrete compressive damage nephogram (front view)
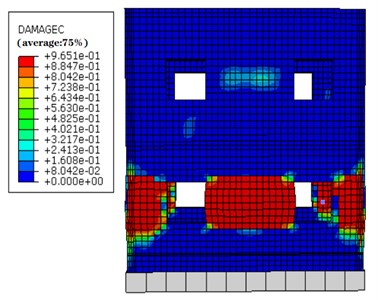
a) Defective structure
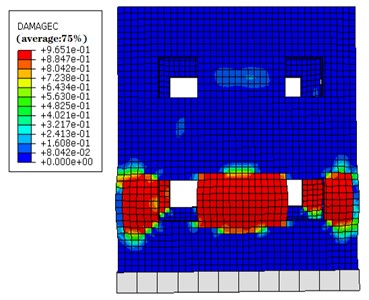
b) Defect-free structure
Fig. 8Nephogram of concrete compressive damage (side view)
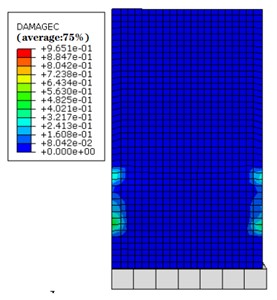
a) Defective structure
b) Defect-free structure
Upon applying cyclic loading for 10 cycles, the structure surpasses the maximum elastic displacement limit by 8 mm, transitioning from an elastic to an elastic-plastic state. Fig. 9(a) reveals that when the top displacement of the shear wall structure afflicted by grouting defects attains 10 mm, the concrete on both flanks incurs damage, exceeding its capacity, thus transferring the load incrementally to the reinforcement elements. The reinforcement stress nephogram in Fig. 9(a) indicates that as the concrete reaches its capacity, the longitudinal reinforcement concurrently attains a yield stress of 400 MPa. At this stage, the structural stress landscape is predominantly governed by the reinforcement stress. Conversely, the nephogram portraying concrete compression damage and reinforcement stress for the defect-free structure in Fig. 9(b) demonstrates that when the top displacement reaches 10 mm, the shear wall’s concrete sustains compression damage without outright failure, while the reinforcement stress below the yield threshold. Consequently, stress distribution within the structure is largely elastic, with only a marginal portion transitioning into the plastic domain.
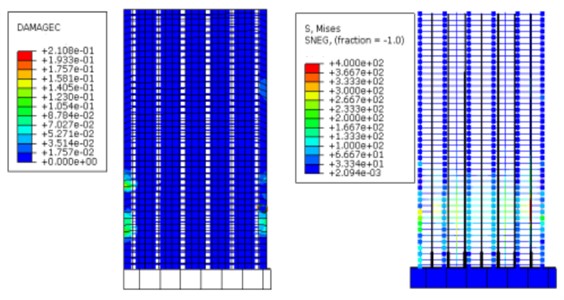
Subjected to 20 cyclic loads, the maximum displacement of the structure reaches 20 mm, surpassing the elastic displacement threshold significantly and pushing the structure into a plastic state. As shown in Fig. 10, the concrete damage of the structure with grouting defects surpasses that of the defect-free counterpart. The stress in the longitudinal reinforcement of the first layer of the structure attains 400 MPa, with an extensive plastic zone. In contrast, concrete damage in the defect-free structure is relatively minor, with the reinforcement reaching yield but a confined plastic zone, predominantly concentrated around the height of the front wall window. Due to the uniform defect distribution, specific damage tendencies emerge within certain defect models when defects are present or absent.
Fig. 9The nephogram of the shear wall under 10 times of cyclic loading
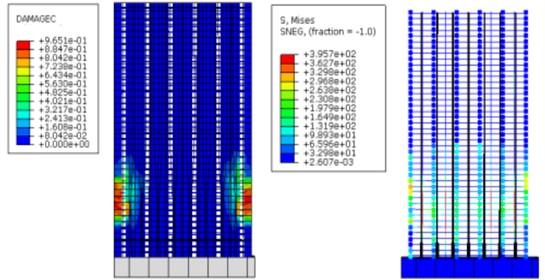
a) Nephogram of concrete compression damage and reinforcement stress of the structure with comprehensive defects
b) Nephogram of concrete compression damage and reinforcement stress of defect-free structure
By scrutinizing concrete damage and steel stress, a comparative evaluation emerges between the progression of damage and steel stress within shear wall structures, both with and without sleeve grouting defects, subjected to cyclic loading. It is evident that the presence of sleeve grouting defects induces slippage between steel bars and concrete within the defective sections, thereby amplifying damage across both compression and tension areas of the concrete. Premature detachment of concrete's load-bearing capacity imparts early stress onto steel bars, profoundly influencing the shear wall structure's macroscopic load-deformation capabilities.
3.3. Analysis of structural response-displacement relationship
This section delves into the assessment of shear bearing capacity performance in fabricated shear wall structures, focusing on changes in structural damage. The hysteresis curve represents the load-deformation relationship within structural components under cyclic loads. For a comparative evaluation of structures with and without defects, the load-displacement curves resulting from 10 and 20 times of cyclic loading are extracted, as depicted in Fig. 11. A meticulous examination of the load-displacement hysteresis curve of 10 times of cyclic loading, as depicted in Fig. 11(a), reveals a notably heightened “pinching phenomenon” in defective structures as opposed to their defect-free counterparts. This is attributed to the absence of adequate bonding between concrete and reinforcement due to grouting defects, triggering the slippage of prestressed reinforcement. Consequently, energy dissipation capacity diminishes, manifesting as the “pinching” behavior in the hysteresis curve. Moreover, when the structure reaches its yield point, the decaying reaction force in defective structures lags behind their defect-free counterparts. This divergence stems from early concrete damage in defect-affected zones, causing a loss of load-bearing capacity. The ensuing load is shouldered by prestressed reinforcement, reinforcement cage, and sleeve. The robust elastic modulus and yield stress of steel contribute to a relatively prolonged retention of reaction force, yielding a slightly slower decay in comparison to defect-free structures.
Fig. 10The nephogram of the shear wall under 20 times of cyclic loading
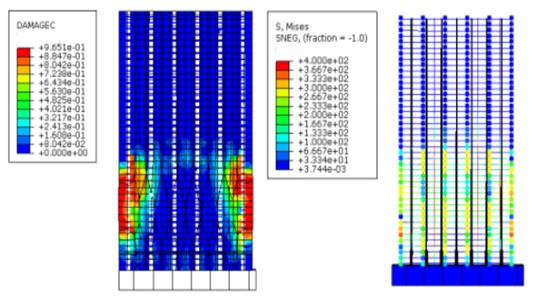
a) Nephogram of concrete compression damage and reinforcement stress of structure with comprehensive defects
b) Nephogram of concrete compression damage and reinforcement stress of defect-free structure
The hysteresis curves converge for both defective and defect-free structures as cyclic loading reaches 20 cycles, as indicated in Fig. 11. The prominence of the “pinching phenomenon” subsides in certain defect cases, with the presence of defect-free sleeves playing a pivotal role in this attenuation.
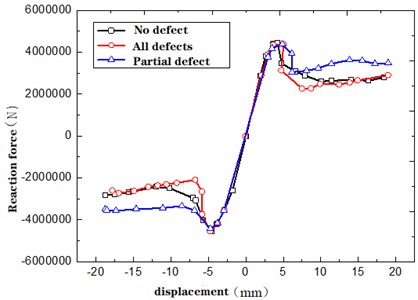
By connecting maximum reaction points across hysteresis curve stages, the load-displacement skeleton curve is delineated, as shown in Fig. 12. Evidently, the skeleton curves of structures, both with and without grouting defects, align extensively prior to reaching peak reaction force. However, the decay in reaction force is hastened in defective structures preceding the defect-free structures. Between displacements of 5-10 mm, defective structures exhibit a significantly accelerated decline in reaction force vis-à-vis the defect-free structure. Harmonization in skeleton curves occurs once structural displacement reaches 10 mm.
Fig. 11Hysteresis curves of structural reaction force-displacement
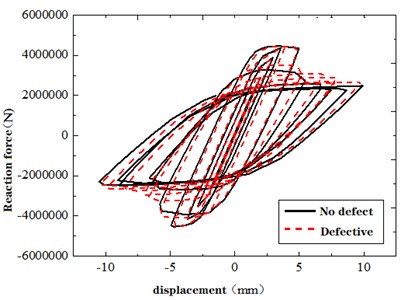
a) Ten-cycle loading of flawless and defective models
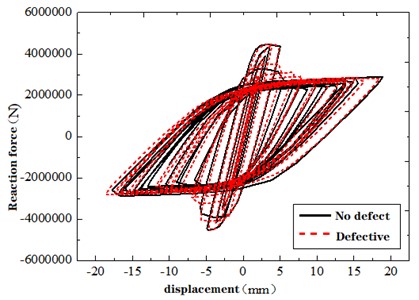
b) Twenty-cycle loading of flawless and defective models
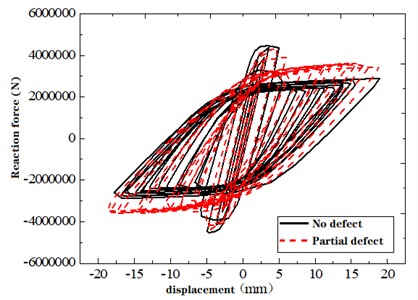
c) Twenty-cycle loading of models with no defects and partial defects
The seismic testing code of buildings specifies the use of the secant stiffness to represent the stiffness of the test specimen. Secant stiffness is calculated according to Eq. (1):
where, + and – denote loads pushed to and pulled to the peak point during the -th cycle respectively; +, – signify displacements pushed to and pulled to the peak point during the -th cycle. Degradation is quantified by the ratio of secant stiffness to initial elastic stiffness.
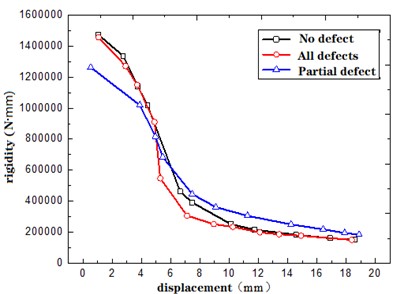
Stiffness degradation curves for defective structures and defect-free structures are illustrated in Fig. 13. It can be observed that in the elastic stage, the stiffness degradation rate of defective structure is basically same to defect-free structure. When the displacement reaches 5 mm, the structure starts transitioning from the elastic stage to the plastic stage. During the stage, the stiffness degradation rate of defect-free structure becomes faster than that of defective structures. This phenomenon can be attributed to the concrete in the defective areas of defective structures exits its load-bearing capacity earlier, and during the elastic-plastic transition stage, the load is primarily borne by the reinforcement. In contrast, the defect-free structure experiences stress redistribution between the reinforcement and the concrete during this stage, leading to accelerated degradation of structural stiffness.
Fig. 12Structural reaction force-displacement skeleton curve
Some defective structures manifest gradual stiffness degradation pre- and post- yielding. However, at displacements of 4-6 mm, stiffness degradation accelerates due to pre-yield interaction between reinforcement and concrete. As the yield displacement approaches, localized stress in defective zones prompts accelerated damage and structural stiffness degradation. Post-yielding, with concrete ceasing load-bearing, which are primarily borne by the reinforcement, the gradual shift in stiffness ensues.
Fig. 13Degradation curve of structural stiffness
By synthesizing microscopic plastic damage analysis with macroscopic mechanical performance analysis, insights into the altered seismic performance of shear wall structures with grouting defects can be explained.
Under cyclic loading, the concrete in the compression or tension areas of the structure with grouting defects will withdraw from the work in advance. This leads to an increase in the degree of fracture of the concrete around the defective area. Once the concrete is damaged, the reinforcement and sleeve take over the load-bearing role, resulting in premature yielding of the reinforcement. From a microscopic plastic damage perspective, the elastic section of the structure with grouting defects is shortened, while the plastic section is increased, expanding the range of the structural plastic deformation zone. The existence of defective areas causes slippage between the reinforcement and concrete, resulting in a more pronounced “pinching” behavior in the reaction displacement hysteretic curve.
Since defective structural reinforcement carries the external load prematurely, the skeleton curve pre- and post-yielding slightly surpasses that of defect-free structures. Upon full yield, however, both defective and defect-free structures align in hysteretic and skeleton curves. The swifter stiffness degradation in structures with grouting defects is attributed to premature concrete withdrawal and early transfer of load-bearing duty to reinforcements upon reaching yield.
4. Conclusions
This study focuses on investigating the seismic performance of prefabricated shear wall structures with sleeve grouting defects. The investigation centers around a two-story prefabricated shear wall structure, considering three distinct conditions: absence of defects, localized defects, and comprehensive defects. Through numerical simulations conducted under cyclic loading, the following conclusions are drawn:
1) Based on the concrete plastic damage model in ABQUAS software, a local material default method is adopted, and the defect area is not connected to the whole. This can effectively simulate shear wall structures with grouting defects, and compare and observe the changes in structural damage and overall mechanical properties.
2) Comparative scrutiny of concrete damage and the stress situation of steel bars in shear wall structures with and without defects under cyclic loading, it can be concluded that in the case of sleeve grouting defects, the defective parts of the shear wall will produce slip between steel bars and concrete, expand the damage range of concrete in the compression and tension areas, and the concrete will withdraw from work earlier. The steel bars will be stressed in advance, and the length of the plastic section of the steel bars will increase. The collaborative deformation ability of defective concrete and steel bars is weakened.
3) Examination of -deformation performance of shear wall structures with or without defects, it can be concluded that the “pinch phenomenon” of comprehensively defective structures is more pronounced in the early loading stage, and the hysteresis curves of the two tend to be consistent in the later loading stage. Before reaching the maximum reaction force, the skeleton curves of the two structures are basically the same, but the reaction force of the defective structure decreases earlier than that of the defect free structure. The stiffness of the defective structure also decreases faster than that of the defect free structure, mainly due to the influence of steel bar slip and early yield. Consequently, the ductility of shear wall structures with grouting defects wanes, inadvertently jeopardizing the efficacy of structural deformation safeguards.
References
-
M. Wu, X. Liu, H. Liu, and X. Du, “Seismic performance of precast short-leg shear wall using a grouting sleeve connection,” Engineering Structures, Vol. 208, p. 110338, Apr. 2020, https://doi.org/10.1016/j.engstruct.2020.110338
-
L. Jia, Q. Li, Y. Zhang, W. Zhao, and M. Du, “Experimental study of the hysteretic behavior of prefabricated frame-shear wall structures with grouting sleeve connections,” Journal of Building Engineering, Vol. 57, p. 104704, Oct. 2022, https://doi.org/10.1016/j.jobe.2022.104704
-
S.-F. Jiang, H.-L. Song, Z.-H. Bian, J. Zhao, and S.-H. Lian, “Experimental and numerical study on the shear strength of new bolted connection assembled shear wall,” Journal of Building Engineering, Vol. 69, p. 106139, Jun. 2023, https://doi.org/10.1016/j.jobe.2023.106139
-
I. Kazaz, A. Yakut, and P. Gülkan, “Numerical simulation of dynamic shear wall tests: A benchmark study,” Computers and Structures, Vol. 84, No. 8-9, pp. 549–562, Mar. 2006, https://doi.org/10.1016/j.compstruc.2005.11.002
-
H. A. D. S. Buddika and A. C. Wijeyewickrema, “Seismic performance evaluation of posttensioned hybrid precast wall-frame buildings and comparison with shear wall-frame buildings,” Journal of Structural Engineering, Vol. 142, No. 6, pp. 1–14, Jun. 2016, https://doi.org/10.1061/(asce)st.1943-541x.0001466
-
M. Ding, W. Xu, J. Wang, Y. Chen, X. Du, and R. Fang, “Seismic performance of prefabricated concrete columns with grouted sleeve connections, and a deformation-capacity estimation method,” Journal of Building Engineering, Vol. 55, p. 104722, Sep. 2022, https://doi.org/10.1016/j.jobe.2022.104722
-
Z. Lu, Z. Wang, J. Li, and B. Huang, “Studies on seismic performance of precast concrete columns with grouted splice sleeve,” Applied Sciences, Vol. 7, No. 6, p. 571, Jun. 2017, https://doi.org/10.3390/app7060571
-
L. Qingfu, G. Wei, and K. Yihang, “Parameter calculation and verification of concrete plastic damage model of ABAQUS,” in IOP Conference Series: Materials Science and Engineering, Vol. 794, No. 1, p. 012036, Mar. 2020, https://doi.org/10.1088/1757-899x/794/1/012036
-
B. Song, C. Lu, M. Wang, and H. Zhou, “Aseismic effect of old single-layer masonry agricultural house structure strengthened with embedded steel frame and steel strip,” Canadian Journal of Civil Engineering, Vol. 50, No. 9, pp. 804–813, Sep. 2023, https://doi.org/10.1139/cjce-2022-0253
-
S. P. Parida and P. C. Jena, “Static analysis of GFRP composite plates with filler using higher order shear deformation theory,” Materials Today: Proceedings, Vol. 44, No. 1, pp. 667–673, 2021, https://doi.org/10.1016/j.matpr.2020.10.608
-
S. P. Parida, P. C. Jena, and R. R. Dash, “Dynamics of rectangular laminated composite plates with selective layer-wise fillering rested on elastic foundation using higher-order layer-wise theory,” Journal of Vibration and Control, p. 107754632211383, Nov. 2022, https://doi.org/10.1177/10775463221138353
-
S. P. Parida, P. C. Jena, S. R. Das, D. Dhupal, and R. R. Dash, “Comparative stress analysis of different suitable biomaterials for artificial hip joint and femur bone using finite element simulation,” Advances in Materials and Processing Technologies, Vol. 8, No. sup3, pp. 1741–1756, Oct. 2022, https://doi.org/10.1080/2374068x.2021.1949541
-
S. Sahoo and P. C. Jena, “Effect of lamina orientation, crack severity, and fillers on dynamic parameters of hybrid composite cantilever beam with double transverse cracks,” Materialwissenschaft und Werkstofftechnik, Vol. 54, No. 6, pp. 737–750, Jun. 2023, https://doi.org/10.1002/mawe.202200205
-
S. P. Parida and P. C. Jena, “Selective layer-by-layer fillering and its effect on the dynamic response of laminated composite plates using higher-order theory,” Journal of Vibration and Control, Vol. 29, pp. 2473–2488, 2022.
-
P. C. Jena, D. R. Parhi, and G. Pohit, “Dynamic investigation of FRP cracked beam using neural network technique,” Journal of Vibration Engineering and Technologies, Vol. 7, No. 6, pp. 647–661, Dec. 2019, https://doi.org/10.1007/s42417-019-00158-5
-
P. C. Jena, D. R. Parhi, and G. Pohit, “Fault measurement in composite structure by fuzzy-neuro hybrid technique from the natural frequency and fibre orientation,” Journal of Vibration Engineering and Technologies, Vol. 5, No. 2, pp. 124–36, 2017.
-
X. H. Zhang and Y. S. Yu, “Finite element study on the influence of local failure of reinforced grouting sleeve connection on the bearing capacity of assembled shear wall,” (in Chinese), Journal of Qingdao University of Technology, Vol. 43, No. 5, pp. 35–41, 2022, https://doi.org/10.3969/j.issn.1673-4602.2022.05.005
-
S. Xiao, Z. Wang, X. Li, K. A. Harries, Q. Xu, and R. Gao, “Study of effects of sleeve grouting defects on the seismic performance of precast concrete shear walls,” Engineering Structures, Vol. 236, p. 111833, Jun. 2021, https://doi.org/10.1016/j.engstruct.2020.111833
About this article

The authors are grateful for the financial support received from National foreign expert project of the Ministry of science and technology (No. G2021105009L); Natural Science Foundation of Hebei Province of China (No. A2021408004).
The datasets generated during and/or analyzed during the current study are available from the corresponding author on reasonable request.
Hua Yan: formal analysis, methodology, resources and writing – review and editing; Bo Song: conceptualization, funding acquisition, investigation and project administration; Huanhuan Yin: software, validation, visualization and writing - original draft preparation.
The authors declare that they have no conflict of interest.
