Abstract
In a liquefied nature gas (LNG) plant, a large concrete framed structure supporting multi-units of heavy compressors was designed in accordance with ACI 318-08 code requirements and ASCE 7-05seismic loads. When applied to new structures, provisions of ACI 318 are intended to provide Life Safety (LS) performance for the Design Basis Earthquake (DBE). Due to the important function of the compressors, this study will perform a seismic assessment of the Table Top Pedestal to assure adequate capacity of preventing collapse from Maximum Considered Earthquake (MCE) and only having limited structural damage under a moderate (MOD) 20%@50 years earthquake event. In this study, the Linear Dynamic Procedure (LDP) of ASCE 41-13 is used for the seismic performance evaluation of the table top structure. The structural modeling parameters and acceptance criteria of structural performances are based on Chapter 10 of ASCE 41-13. Soil-structural interaction and P-Delta effects are considered in the analysis process. The response spectra of the three levels of seismic hazards of DBE, MCE and MOD earthquake were developed for response spectra analysis. The procedures presented in this study can be used as a general guideline for Performance-Based Design of most reinforced concrete structures located in industrial plants.
1. Introduction
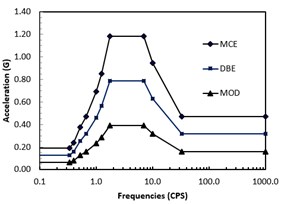
In a liquefied nature gas (LNG) plant, it requires multiple compressor units of methane, ethylene and propane compressors in order to convert natural gas to LNG by cooling the liquid temperature to –270 °F. A typical concrete framed structure (also referred to as Table Top |Pedestal) supporting two trains of methane compressors as shown in Fig. 1 has been designed by Jan [1] in accordance with ACI 318-08[2] and ASCE 7-05 [3] code requirements. The maximum considered earthquake (MCE) in the plant site has a 2 % probability of exceedance in 50 years (a return period of 2475 years). The design base earthquake (DBE) is two-thirds of the of MCE. It is equivalent to an earthquake having a 10 % probability in 50 years (a return period of 475 years). For ordinary structures, life safety under a DBE hazard event are ensured by designing the structure for the effects of code-prescribed earthquake forces and by conforming to material design and detailing requirement set forth in the code. Due to the important function of the compressors, this study will perform a seismic assessment of the Table Top Pedestal to assure adequate capacity of preventing collapse from MCE and only having limited structural damage under a moderate (MOD) earthquake event of 20%@50 years (a return period of 225 years). The ground response spectra of the three levels of earthquake MCE, DBE and MOD are shown in Fig. 2.
Structural analysis of the Table Top Pedestal may be performed by using either linear dynamic procedure (LDP) or nonlinear dynamic analysis procedure (NDP) as provided in ASCE 41-13 [4] for performance-based seismic evaluations of structures. NDP is normally required for a tall building whose height exceeding the limit of building code (ASCE 7). Extensive international research and developments have been carried out on the tall building design in USA [5], Canada [6], Japan [7], China [8], Turkey [9] and Greece [10]. The structural response obtained from the nonlinear dynamic analysis results represent true structural performances under the earthquake event. However, NDP requires considerable efforts in mathematic modelling and tedious analysis process and interpretation of analysis results. An industrial structure such as the table top pedestal has little irregularity in the structure layout in general, thus the linear dynamic procedure is appropriate to be used for seismic performance evaluation of the structure. In general, LDP yields a more conservative design result than NDP design result as presented in Reference [11]. Mathematical modelling and analysis process for the linear dynamic procedure can be accomplished efficiently by using commercial available general finite element programs. Therefore, the linear dynamic procedure is adopted in this paper for carrying out the seismic performance assessment of the pedestal. The LDP is a practical and efficient approach for seismic performance based retrofitting of existing structures and is recommended to be used for analysis of new structures in the industrial plants.
Fig. 1Finite element model – table top pedestal
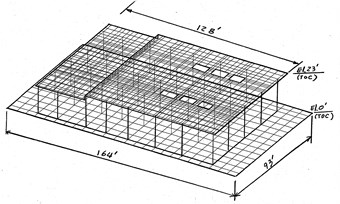
Fig. 2Earthquake ground response spectra
2. The existing compressor table top structure
The three-dimensional finite element model of the concrete table top pedestal is shown in Fig. 1. The mathematic model consists of 1230 plate elements for deck slab, 2400 plate elements for mat and 80 line elements for 40 columns. The soil stiffness is represented by Winkler spring elements. In order to consider the effects of concrete cracking, shrinkage, and reinforcement slip, the effective component stiffness is reduced per Table 10-5 of ASCE 41. In this study, the modulus of elasticity of concrete for all columns and deck slab are reduced to 0.3. The structural design parameters in the original structural design [1] are summarized as follows:
Concrete structure:
– Mat: 93 ft×164 ft×4 ft, with #9 @ 12” top/bottom, total weight = 9200 kips,
– Deck size: 87 ft×128 ft×3.3 ft with #9 @8” top/bottom, total weight = 5500 kips,
– Columns: 40-3.3 ft squares, total weight = 1200 kips,
– Concrete maximum compressive strength 4ksi,
– Yield strength of reinforcing steel = 60 ksi,
– Critical damping ratio of concrete structure 4 %.
Equipment:
– The table top supports two trains of methane compressors. Each train has one compressor and one gas turbine.
– Compressor: weight = 522 kips/unit, operating speed =104.5 cps,
– Gas turbine: weight = 370 kip/unit, operating speed = 64.7 cps.
Soil properties:
– Allowable soil bearing pressure = 2.5 ksf,
– Ultimate soil bearing pressure = 5 ksf,
– Critical damping ratio of soil 10 %.
Seismic design parameters used in the original structural design:
– Soil site class “D”,
– Occupancy category III,
– Seismic design category “D”,
– Occupancy important factor of structure 1.25,
– Response modification factor 8 for special reinforced concrete moment frame per ASCE 7.
– Mapped Acceleration parameters:
• At short period (0.2 s) 1.12,
• At one second period 0.48.
– Design spectral acceleration parameters:
• At short period (0.2 s) 0.79,
• At 1-second period 0.49.
3. Linear dynamic analysis procedure (LDP)
In this study, the modal response spectrum method was used to evaluate structural responses. The linearly elastic response spectra shown in Fig. 2 are not modified to account for anticipated nonlinear response. It is expected that the LDP will produce displacements that approximate maximum displacements expected during the selected Seismic Hazard Level but will produce internal forces that exceed those that would be obtained in a yielding building. Calculated internal forces typically exceed those that the building can sustain because of anticipated inelastic response of components. These forces are evaluated through the acceptance criteria of ASCE 41-13 Section 7.5.2, which include modification factors to account for anticipated inelastic response demands and capacities. In the criteria, a component is classified as either deformation controlled (ductile) or force controlled (non-ductile) elements. Moreover, structural elements are categorized as primary or secondary components. A primary component resists earthquake forces while a structural component not designed to resist earthquake forces is categorized as secondary component. In LDP, deformation and force controlled actions are evaluated using following criteria:
Deformation-controlled actions: ,
Force-controlled actions: ,
where: is the component demand modification factor to account for the expected ductility related to this action at the selected structural performance level, is the knowledge factor to account for the uncertainty of collection of as-built data per 6.2.4 of ASCE 41-13, is the expected strength of a component at the deformation level under consideration for deformation-controlled actions, is the deformation-controlled design action due to gravity loads () and earthquake loads (), is the lower-bound strength of a component at the deformation level under consideration for force-controlled actions, is force controlled design action determined by:
where: is the modification factor that relates the expected maximum inelastic displacements to displacements calculated using linear elastic response, is a modification factor that considers the effect of pinched hysteresis shapes, cyclic stiffness degradation, and strength deterioration on maximum displacement response, is the force delivery reduction factor, calculated as the smallest demand capacity ratio (DCR = /) of all components in the load path delivering forces to the component being examined.
4. Seismic performance objectives
As previous discussed, there are three seismic hazard levels considered in this paper. The corresponding structural performance levels per ASCE 43-13 guidelines are as followings:
Severe overall structural damage occurs under 2%@50 years (MCE) seismic hazard event. It is corresponding to the Collapse Prevention (CP) Structural Performance Level.
Moderate overall structural damage occurs under 10%@50 years (DBE) seismic hazard event. It is corresponding to the Life Safety (LS) Structural Performance Level.
Light overall structural damage occurs under 20%@50 years (MOD) seismic hazard event. It is corresponding to the Immediate Occupancy (IO) Structural Performance Level.
The 5 % damped acceleration spectra for the three seismic hazards are shown in Fig. 2. The component demand modification factors corresponding to the three structural performance levels are evaluated per ASCE 41-13.
5. Dynamic analysis and analysis results
The linear dynamic analysis procedure described in Section 3 is used in this study. The elastic response spectrum analyses for horizontal excitations in the orthogonal and axes are performed for the three levels of earthquake events MCE, DBE and MOD. The seismic responses in the and direction, and , are then combined with gravity load as:
Deformation-controlled actions:
Force-controlled actions:
where: 1.1 from Table 7-3 of ASCE 41 for period T between 0.3 and 1.0 seconds, 2.0 for MCE, 1.5 for DBE and 1.0 for MOD earthquake event based on section 7.5.2.1.2 of ASCE 41-13.
The following two gravity load conditions are considered in all above load combinations:
– 1.1() (Notes: Dead loads, Live loads),
– 0.9.
Based on the analysis results, the capacity demands of columns and deck slab under gravity loads are less than 80 % of nominal capacity of the components. Therefore, the vertical seismic effects are not considered in this study.
The fundamental natural frequencies of the soil supported table top structure are 2.57 cps and 2.80 cps in the two horizontal directions and 4.43 cps in the vertical direction. From the response spectra analysis, the maximum accelerations at the top deck slab are shown in Table 1. All acceleration responses are within 150 % of peak spectra accelerations. They appear to be within the acceptable floor acceleration limits for non-structural components.
Table 1Acceleration responses at top deck slab
Peak Spectra Accel. (g) | Earthquake -Excitation | Earthquake -Excitation | |||||
-Horiz. Accel. (g) | -Horiz. Accel. (g) | -Vertical Accel. (g) | -Horiz. Accel. (g) | -Horiz. Accel. (g) | -Vertical Accel. (g) | ||
DBE | 0.79 | 0.94 | 0.41 | 0.38 | 0.38 | 1.16 | 0.50 |
MCE | 1.18 | 1.41 | 0.61 | 0.54 | 0.69 | 1.75 | 0.73 |
MOD | 0.39 | 0.47 | 0.20 | 0.19 | 0.23 | 0.58 | 0.28 |
The maximum displacement at the top deck slab are shown in Table 2. The story height between the top of deck slab to the top of mat is 23 ft. The allowable drifts are set to be 3 %, 2 % and 1 % of story height for MCE, DBE and MOD earthquake levels, respectively. All displacements shown in Table 2 are within the allowable limits.
The dynamic analysis results of internal forces of columns and deck slab are summarized in Tables 3 and 4.
Table 2Displacement responses at top deck slab
Allowable drift (in) | Earthquake -excitation | Earthquake -excitation | |||||
-horiz. disp (in) | -horiz. disp (in) | -vertical disp (in) | -horiz. disp (in) | -horiz. disp (in) | -vertical disp (in) | ||
DBE | 5.52 | 1.15 | 0.46 | 0.34 | 0.61 | 1.68 | 0.38 |
MCE | 8.28 | 1.75 | 0.68 | 0.51 | 0.92 | 2.52 | 0.58 |
MOD | 2.76 | 0.58 | 0.23 | 0.17 | 0.31 | 0.84 | 0.19 |
Table 3Column internal forces
Loads | (kips) | (kips-ft) | (kips-ft) | (kips) | (kips) | Remarks | |
DBE | 1.1 | 401 | 13 | 5 | 9 | 18 | |
1.1 | 260 | 3275 | 1776 | 140 | 262 | Flexural | |
682 | 2181 | 1966 | 161 | 171 | |||
0.9 | 18 | 2801 | 1863 | 144 | 214 | Flexural | |
/ | 461 | 921 | 2201 | 203 | 86 | Flexural | |
571 | 1407 | 1144 | 94 | 110 | |||
0.9 / | 94 | 1412 | 1331 | 108 | 110 | Flexural | |
MCE | 1.1 | 291 | 4963 | 2441 | 192 | 398 | Flexural |
822 | 3164 | 3011 | 245 | 247 | |||
0.9 | –69 | 4266 | 2618 | 202 | 327 | Flexural | |
/ | 478 | 1009 | 2456 | 227 | 98 | Flexural | |
592 | 1557 | 1303 | 107 | 122 | |||
0.9 / | 71 | 1612 | 1475 | 120 | 126 | Flexural | |
MOD | 1.1 | 231 | 1584 | 1109 | 88 | 127 | Flexural |
541 | 1198 | 923 | 76 | 94 | |||
0.9 | 104 | 1334 | 1106 | 87 | 102 | Flexural | |
/ | 401 | 832 | 1072 | 86 | 65 | Flexural | |
540 | 1407 | 1198 | 76 | 94 | |||
0.9 / | 126 | 1134 | 1131 | 92 | 88 | Flexural |
Table 4Top deck slab element stress resultants
Loads | (kips-ft/ft) | (kips-ft/ft) | (kips-ft/ft) | (kips/ft) | (kips/ft) | Remarks | |
DBE | 1.1 | 100 | 140 | 60 | 90 | 90 | Flexural |
0.9 | 90 | 90 | 50 | 75 | 120 | Flexural | |
/ | 60 | 90 | 30 | 50 | 50 | Flexural | |
0.9 / | 60 | 60 | 25 | 40 | 40 | Flexural | |
MCE | 1.1 | 120 | 180 | 70 | 100 | 100 | Flexural |
0.9 | 100 | 150 | 60 | 120 | 120 | Flexural | |
/ | 80 | 100 | 40 | 60 | 60 | Flexural | |
0.9 / | 70 | 80 | 30 | 45 | 45 | Flexural | |
MOD | 1.1 | 75 | 70 | 25 | 55 | 50 | Flexural |
0.9 | 60 | 60 | 20 | 50 | 45 | Flexural | |
/ | 50 | 60 | 24 | 35 | 35 | Flexural | |
0.9 / | 40 | 50 | 20 | 30 | 30 | Flexural |
6. Seismic performance assessments
The steps for seismic performance evaluation of the concrete structural components in the linear dynamic analysis procedure are as following:
Step 1: Classify components as a Primary or Secondary components.
All columns and the deck slab of the table top structure are considered as primary components. They are required to resist seismic forces and accommodate deformations for the structure to achieve the selected Performed Level.
Step 2: Classify components as deformation-controlled or force-controlled actions.
Different actions for a same element can be classified in different category. For instance, shears in beams and columns are considered as force-controlled actions. However, bending moments in columns and beams can be considered as force or deformation-controlled actions depending on the amplitude of the axial force.
Step 3: Determine component properties.
The Lower-Bound material properties of the table top structure are concrete compressive strength 4 ksi and reinforcing steel yield strength 60 ksi. The expected strength properties are 1.5·4 = 6 ksi and 1.25·60 = 75 ksi per Table 10-1 of ASCE 41-13. Where evaluating the behavior of deformation-controlled actions, the expected material strengths are used. Where evaluating the force-controlled actions, the lower-bound material strengths are used. Calculations of component design strength are in accordance with ACI 318-08 with an exception that the strength reduction factor is taken as unity.
All column cross-sections are 40 in squares with 28-#9 longitudinal reinforcement and 6-#4 shear tie legs with 135° seismic hooks. The spacing of transvers reinforcement is 5 in. The effective depth of column 36 in. The following are calculated column properties and strength:
– Gross area 1600 in2, Total longitudinal reinforcing area = 28 in2,
– Nominal axial load strength at zero eccentricity 1600·4 = 6400 kips,
– Flexural reinforcement ratio 0.0175,
– Arear of shear reinforcement 6·0.2 = 1.2 in2,
– Shear reinforcement ratio 1.2/(40·5) = 0.006.
– Shear strength of column: 1.2·60·36/5 = 605 kips, 2··40·36 = 182 kips,
– Total shear strength 787 kips,
The deck slab has a uniforms thickness 40 in. It was provided with #9 @ 8 in longitudinal reinforcements at top and bottom faces. The following are calculated slab properties and strength:
– Longitudinal reinforcing area = 1.33 in2/ft top and bottom,
– Flexural reinforcement ratio 0.0031.
Step 4: Determine component demand modification factor for deformation-controlled actions.
Determination of -factors for columns are based on the criteria provided in Tables 10-9 of ASCE 41-13. The failure mode of columns is considered as condition (flexure failure) since the column transvers reinforcement ratio 0.0065 > 0.002 and the ratio of shear ties spacing to column depth / 5/37 = 0.135 < 0.5. The evaluated -factors are shown in Table 5. In the table, is the axial force action.
Table 5Column m-modification factors
(kips) | -factors | |||
DBE | 682 | 0.107 | 0.006 | 2.49 |
MCE | 822 | 0.128 | 0.006 | 2.94 |
MOD | 540 | 0.084 | 0.006 | 2.02 |
Determination of -factors for deck slab are based on the criteria provided in Table 10-16 of ASCE 41. The evaluated -factors are shown in Table 6. In the table, is the gravity shear acting on the critical shear sections and is the direct punching shear strength defined by ACI 318.
Step 5: Check component capacities for deformation-controlled actions.
The acceptance criteria for deformation-controlled actions is:
For the table top structure, the knowledge factor is 1.0 since the structural design meets the benchmark requirement of Tables 4 and 5 ASCE 41-13. Calculations of component strength are based on the expected strength material properties. The allowable -modification factors for columns and slab are calculated in Tables 5 and 6. The deformation-controlled actions caused by the combination of gravity load and earthquake forces are presented in Tables 3 and 4. The expected strength of component deformation-controlled action of an element are determined considering all coexisting actions on the component from load combinations as discussed in Section 3. The component capacity checks are summarized in the Tables 7 and 8. In Table 7, is column axial force and is algebra sum of the biaxial bending moments for the square columns. In Table 8, is bending moments with consideration of twisting moment in the slab. All components demand capacity ratios (DCR) are less than the allowable -modification factors and therefore, achieve the seismic performance objectives.
Table 6Top deck slab m-modification factors
Column locations | Seismic levels | (kips) | (kips) | DCR / | Continuity reinforcement | -factors |
Corner | DBE | 312 | 906 | 0.34 | yes | 2.15 |
MCE | 312 | 906 | 0.34 | yes | 2.48 | |
MOD | 312 | 906 | 0.34 | yes | 1.15 | |
Side | DBE | 380 | 1750 | 0.22 | yes | 2.45 |
MCE | 380 | 1750 | 0.22 | yes | 2.93 | |
MOD | 380 | 1750 | 0.22 | yes | 1.45 | |
Interior | DBE | 401 | 2331 | 0.17 | yes | 2.54 |
MCE | 401 | 2331 | 0.17 | yes | 3.08 | |
LOW | 401 | 2331 | 0.17 | yes | 1.58 |
Table 7Summary of column capacity check for deformation-controlled actions
° | Load combinations | (kips) | () (kips-ft) | (kips-ft) | DCR (/) | Allowable -factor | Remarks |
DBE (LS) | 1.1 | 260 | 5051 | 3300 | 1.53 | 2.49 | Acceptable |
0.9 | 18 | 4767 | 2900 | 1.64 | 2.49 | Acceptable | |
MCE (CP) | 1.1 | 294 | 7404 | 3500 | 2.12 | 2.94 | Acceptable |
0.9 | –194 | 6884 | 2800 | 2.46 | 2.94 | Acceptable | |
MOD (IO) | 1.1 | 303 | 2693 | 3500 | 0.77 | 2.02 | Acceptable |
0.9 | 187 | 2440 | 3100 | 0.79 | 2.02 | Acceptable |
Table 8Summary of top deck slab capacity check for deformation-controlled actions units
Load combinations | () (kips-ft/ft) | (kips-ft/ft) | DCR / | -factor | Remarks | |
DBE (LS) | 1.1 | 200 | 432 | 0.46 | 2.15 | Acceptable |
0.9 | 140 | 432 | 0.32 | 2.15 | Acceptable | |
MCE (CP) | 1.1 | 250 | 432 | 0.58 | 2.48 | Acceptable |
0.9 | 210 | 432 | 0.49 | 2.48 | Acceptable | |
MOD (IO) | 1.1 | 95 | 432 | 0.22 | 1.15 | Acceptable |
0.9 | 80 | 432 | 0.19 | 1.15 | Acceptable |
Step 6: Check component capacities for force-controlled actions.
The acceptance criteria for force-controlled actions is:
Axial forces and shears in columns and slabs are force-controlled actions. Calculations of component strength are based on the lower bound material properties. Tables 9 and 10 present summaries of capacity checks for columns and top deck slab, respectively. The demand capacity ratios (DCR) are less than 1.0. Therefore, the capacity of the table top pedestal meets the seismic performance objectives.
Table 9Summary of column capacity check for force-controlled actions
Loads | (kips) | (kips) | (kips) | (kips) | |||
DBE | 571 | 6000 | 0.095 | 145 | 189 | 0.77 | |
MCE | 564 | 6000 | 0.094 | 162 | 189 | 0.86 | |
MOD | 540 | 6000 | 0.090 | 121 | 189 | 0.64 |
Table 10Summary of top deck slab capacity check for force-controlled actions
Loads | Beam shear (kips/ft) | Punching shear (kips) | |||||
(kips) | (kips) | ||||||
D+E/C1C2J | DBE | 71 | 162 | 0.44 | 571 | 906 | 0.63 |
MCE | 141 | 162 | 0.87 | 592 | 906 | 0.65 | |
MOD | 64 | 162 | 0.39 | 540 | 906 | 0.60 | |
Per ASCE 41-13, the capacity of soil bearing pressure shall be evaluated as force-controlled actions. The calculated soil bearing pressure are in allowable limits as shown in Table 11.
Table 11Foundation bearing capacity
Loads | Soil bearing pressure (ksf) | Allowable bearing pressure (ksf) | |
Gravity | Gravity | 1.75 | 2.5 |
D+E/C1C2J | DBE | 2.75 | 5.0 |
MCE | 2.90 | 5.0 | |
MOD | 2.56 | 5.0 |
7. Conclusions
Based on the assessment of seismic performance presented in this study, it is concluded that the concrete compressor table top structure can provide life safety structure performances under a design basis earthquake event, has adequate capacity of preventing collapse from a maximum considered earthquake event, and has only limited structural damage under a moderate earthquake event.
The Linear Dynamic Procedure provided in ASCE 41-13 is a practical procedure for seismic performance assessment of industrial plant structures. This procedure can achieve performance-based seismic design without requiring highly sophisticated non-linear dynamic analysis program which is still under research and development. The analysis steps presented in this study for using linear dynamic analysis procedure can be applied for seismic performance-based retrofitting of reinforced concrete structures.
References
-
Jan S., Wu S. Dynamic analysis and design of large compressor foundations in high seismic zone. Structures Congress, Orlando, Florida, USA, 2010.
-
Building Code Requirements for Structural Concrete and Commentary. ACI 318-08, American Concrete Institute, Farmington Hills, Michigan, USA, 2008.
-
Minimum Design Loads for Buildings and Other Structures. ASCE/SEI 7-5, American Society of Civil Engineers, Reston, VA, 2005.
-
Seismic Evaluation and Rehabilitation of Existing Buildings. ASCE/SEI 41-13, American Society of Civil Engineers, Reston, VA, 2014.
-
Moehle J. Performance-based seismic design of tall building in the U.S. 14th World Conference on Earthquake Engineering, Beijing, China, 2008.
-
Chen Z., Chui Y., Popovski M. Seismic design and analysis of a 20-story demonstration wood building. Structures Congress, Portland, Oregon, USA, 2015.
-
Ramirez C., Myers A. Detailed seismic loss estimation for a tall building in Japan. 15th World Conference on Earthquake Engineering, Lisbon, Portugal, 2012.
-
Jiang H., Lu X., Zhu J. Performance-based seismic analysis and design of code-exceeding tall buildings in Mainland China. Structural Engineering and Mechanics, Vol. 43, Issue 4, 2012, p. 545-560.
-
Binzet S., Tuzun C., Erdik M. Performance-based design of a high-rise building based on Istanbul tall building seismic code. 2nd European Conference on Earthquake Engineering and Seismology, Istanbul, Turkey, 2014.
-
Kappos A., Panagopoulos G. Performance-based seismic design of 3D R/C buildings using inelastic and dynamic analysis procedures. ISET Journal of Earthquake Technology, Vol. 41, 2004, p. 141-158.
-
Balazadeh-Minouei Y., Koboevic S.,Tremblay R. Seismic assessment and rehabilitation of existing steel braced frame designed in accordance with the 1980 Canadian code provisions. Tenth U.S., National Conference on Earthquake Engineering/Frontiers of Earthquake Engineering, Anchorage, Alaska, 2014.
About this article

