Abstract
Considering the shortcomings of the modal assurance criterion in the observation station selection and optimization algorithm for the structural modal testing experiment, this paper proposed a new criterion on the basis of the rule that the vibration mode is weighted-orthogonal to the mass. Since the vibration distributions of modes for large-scale structures vary from one another, the contribution of the high-order modes to the modal strain energy cannot be neglected. Therefore, a weight coefficient representing the contribution ratio of the high-order modal was introduced to modify the modal matrix. In addition to that, a hybrid optimization algorithm based on effective independence method and the weighted average modal strain energy coefficient method based on the effective independence method were proposed. Calculations guided by two-degree freedom system equal mass and non-equal-mass theories were initiated and comparisons and contrasts were made for the above-mentioned two methods, the average mode strain energy coefficient method based on the effective independence method and the weighted average modal strain energy coefficient method based on effective independence method through Garteur simulation tests to examine the differences in their resultant observation station arrangements. Results have shown that the traditional mode assurance criterion could not be used to judge whether the modes are weighted orthogonally or not when various nodes differ in their masses, but the new criterion involved in this paper could. The introduction of the weight coefficient effectively averted the aggregation of observation stations, best ensured the contributions of all the modal strain energy and fulfilled what’s required by a preferred observation station arrangement. Model tests were also conducted by employing the Garteur plane to test the weighted average mode energy coefficient method based on the effective independence method with the new modal assurance criterion proposed. It was found that the new modal mode assurance criterion guaranteed the completeness and linear independence of the monitoring mode, and that the weight coefficient introduced effectively magnified the contributions of the high-order modes to the modal strain energy, improved the accuracy of the test results. In the final analysis, the new assurance criterion is of great practical value to the observation station optimization and large-scale structure distribution. The method proposed in this paper has been applied to the modal test of a large carrier rocket and an observation station layout optimization software of large structural modes has been developed based on MATLAB language. It has been validated that this algorithm has faithfully guaranteed the integrity and linear independence of the modes monitored and that it can ensure the optimization and arrangement of observation stations in the modal test of large and complex structures.
1. Introduction
Due to the limited number of sensors used in the structural modal testing experiment, to properly locate and arrange may facilitate the process of collecting the dynamic structure response information. In the modal testing experiment, the first problem that needs to be tackled is the configuration of the sensors. The optimized distribution of observation stations in the structural modal testing experiment may directly influence the finite element model updating, experimental modal parameter identification and analysis of experimental modes and calculated modes. To improve the accuracy and precision of testing results, one has first to identify and optimize the degree of freedom through effective criteria and methods and then to work out the optimum number of observation stations and their positions before putting in place the sensors accordingly. Normally speaking, as the structures themselves are not perfect and the experimental environment is far from being favorable in the real practice, the number of sensors that can be used may be greatly hindered. Coupled with the fact that the information collecting and processing facilities applied in company with sensors may exceedingly be expensive, it is impossible and unrealistic to equip all degrees of freedom of a structure with sensors [1]. Besides, too many sensors loaded on one structure may result in the collection of useless and hamper the extraction and analysis of critical information and data. That being said, it is quite necessary to opt out and optimize the observation stations so as to identify the most suitable quantity of the stations and the best positions to locate the sensors before the testing experiment. In doing so, accurate and complete tested structural incentives and responsive time-domain signals will be obtained and the dynamic characteristics of structures will be brought out [2]. Therefore, studies on the observation stations’ optimization and arrangements in structural modal testing experiment matter a lot both theoretically and practically.
For the Aviation Maintenance System, the maintenance of some certain fighter structures in particular, the number and positions of sensors in the simulation and experimental analysis of fatigue cracks on some beams, walls and hydraulic oil pipes bears great significance. In the requirement of airplane structures, let us say, the identification and analysis of structural modal parameters, the identification of damage of structures or the diagnosis and monitoring of structural failure, to select and then optimize the observation stations plays a pivotal role in acquiring accurate and complete modal parameters. To sum up, the selection and arrangement optimization of observation stations for structural modal testing experiments do have momentous bearing on the Aviation Maintenance System both theoretically and practically.
At present, optimizing the layout of observation stations involves roughly two methods, namely, conventional and non-conventional optimization algorithms. Non-conventional optimization algorithms include mainly the wavelet method, the particle swarm optimization, the artificial neural network method and the genetic algorithm [1]. Conventional optimization algorithms consist mainly of minimum MAC method [3], the effective independence method [4, 5], the Guyan reduction method[6, 7] and the energy method [8, 9]. Each and every optimization algorithm has its advantages, limitations and application scopes [9]. Each individual algorithm in the vibration test will lead to an individual program of optimizing the layout of observation stations. To decide whether a observation-station-layout optimization program is desirable or not, one needs only to evaluate its modal information capturing of the tested structures. Then, it is necessary to introduce a set of evaluation criteria to ensure the integrity and accuracy of the data monitored.
There are now three criteria that are most-frequently used to evaluate a observation-station-layout optimization program, namely, the modal assurance criterion, the minimum mean square error criterion and the maximum singular value ratio. If the criterion is inappropriately selected, observation stations may be misplaced and the subsequent optimization will be compromised. Yet, defects and shortcomings of the criteria themselves will directly maim the test results. This paper wisely removed these deficiencies and proposed a new modal assurance criterion based on theory that the vibration mode is weighted-orthogonal to the mass. The new criterion initiated in this paper effectively wipes out observation-station aggregation and best ensures the contributions of all modal strain energy and the great energy required by the optimized observation-station layout. More importantly, it can be borrowed to examine the orthogonality of modes of vibration even when masses of node differ. Garteur simulation and modal experiment confirmed that this new criterion did ensure the integrity and linear independence of the modes monitored and make the test results more validly accurate.
Conventional methods believe that the modal strain energy concentrate mainly on the low-order mode of the structure and that the high-order modes make fewer contributions in this regard. As to complex and large structures, however, contributions of high-order modes to the modal strain energy cannot be neglected. That being said, this paper proposed a weight coefficient that could reflect the very contributions of high-order modes, taking into consideration both the great energy required by observation stations and contributions of all modes to the modal strain energy.
For large-scale structures, due to highly distinct vibration distribution of modes, the contribution of high-order modes to the modal strain energy cannot be ignored. In order to cover the contribution to the strain energy of all modes and improve the accuracy of the result, we came up with a weight coefficient reflecting the contribution of high-order modes to amend the matrix of modal vibration modes. Model tests were also made by employing the real GARTEUR plane, which showed that the weight coefficient introduced effectively increased the contribution of the high-order mode to the modal strain energy and improved the accuracy of the test results. Thus, the coefficient is of great practical value to the observation station optimization and large-scale structure distribution.
2. Optimized layout theory
2.1. Effective independence method
The most widely-used algorithm currently falls on the effective independence method proposed by Kammer [10, 11], from which many other algorithms are derived. In doing the structural modal test, the mode of vibration of the structure must be identified. Suppose that the mode can fully be activated, then the generalized coordinate, , of the mode of vibration represents the parameters to be identified and the output of the sensor is expressed as:
The least-squares solution of Eq. (1) is:
where, represents the reduced matrix of mode of vibration and the output information of the sensor. If we take the noise into account, Eq. (1) can be rewritten as:
where represents the static Gaussian white noise with variance . If there are only () sensors are available and candidate observation stations, this method constitutes the optimal estimation to obtain the true generalized coordinate , also the optimal estimation to obtain the mode of vibration, which can best maintain the linearly-independent information. The covariance matrix of deviation estimation can be expressed as:
where represents the Fisher information matrix [12]. If the noise sustains the Gaussian white noise, then:
The maximum of the Fisher information matrix is equivalent to the minimum of the covariance that can be used to estimate the deviation. The trace or the maximum determinant value of belongs to unbiased estimation.
Matrix is written as:
With regard to Eq. (6), denotes the contribution of the th degree of freedom to matrix . Those degrees of freedom are superfluous and can be removed. denotes those traces or determinant values that exert little or limited effects to matrix . represents the reduced modal matrix of the target modal shape on the basis of the candidate measuring points, mirroring the th degree of freedom or the th row of the observation station.
The characteristic equation of matrix can be expressed as:
Assume that the th column corresponding to the modal matrix is linearly independent of the collection of initial candidate observation stations, that is the positive definite symmetric matrix, that the eigenvector Ψ of is normalized and the eigenvalues are real and positive, then:
obviously:
or:
Apparently, in , is an idempotent matrix whose trace is equivalent to the rank and whose eigenvalues stand at 0 or 1. Each element here on its diagonal represents the contribution of the corresponding observation station or degree of freedom to the rank of matrix , namely, the contribution to matrix . If , the corresponding observation station represents a critical station that cannot be deleted; if , it means that the target mode cannot be recognized on the corresponding th observation station and therefore the station can be deleted. EI method has been the most mature optimization algorithm of observation stations to date in the vibration test of structural modal test. It adopts the iterative loop to eliminate the smallest observation station of the corresponding t diagonal element step by step and the iteration loop stops when the number of measured points is made equal to the target number. In this way, the linear independence of the mode vector will best be retained and the most mode information will be obtained in the vibration test of structural modal test.
2.2. Modal strain energy method
How the sensors are arranged involved in modal strain energy method [13, 14] is similar to what happens in the effective independent method. Major differences between the two lie in that the former selected the observation station by locating them where the structural modal strain energy maximize rather than by referring to the maximum determinant of matrix Fisher. In a nutshell, the principle of the modal strain energy method in selecting the optimal observation station is that the strain energy of the structure must culminate there. The modal strain energy is expressed as:
where represents the modal matrix and the number of target modes. The greatest advantage of this method is that it proves effective even in a harshly noisy environment.
3. Evaluation criteria
3.1. Conventional modal assurance criteria modal assurance criterion and improved modal assurance criterion
Values of the inherent mode shapes at nodes form a set of orthogonal vectors but the number of observation stations won’t be the same as that of nodes, especially for the large and complex structures where nodes far outnumber the observation stations. The mass of nodes, coupled by the relative inaccuracy of the test and the noise make the orthogonality of the target vibration mode hard to reach. Therefore, in selecting the observation stations, dynamic characteristics of structural modes should be best preserved while ensuring an adequate spatial angle of intersections between mode shapes. In this regard, the matrix MAC (modal assurance criterion matrix) [15] represents a favorable evaluation criterion for the orthogonality of modal vectors. Matrix MAC is calculated via:
3.2. The newly-proposed modal assurance criterion
Based on the vibration theory, it is inferred that the vibration modes are orthogonal to the mass, but only when the masses of each nodes equate one another can the formula reflect the weighted orthogonality of the modes. In other words, when masses of nodes differ, the formula in discussion cannot be borrowed to examine the weighted orthogonality of the mode of vibration. The following formula represents the MAC whose mode of vibration is weighted- orthogonal to its mass:
where is the th-order mode vector, and the th-order modal vector. The orthogonality of two modal shapes is checked by examining the non-diagonal element of matrix MAC of each mode shape at each order formed on the measuring degree of freedom: the value of the non-diagonal element of matrix MAC is negatively correlated to the orthogonality of for each mode. It is generally believed that two orthogonal vectors are roughly weighted orthogonal when MAC is less than 0.25 and that two vectors are related when MAC is greater than 0.9. To ensure the weighted orthogonality of the target models, the non-diagonal element of matrix MAC should be made as small as possible.
4. Weighting coefficient
Conventional methods believe that the modal strain energy concentrate mainly on the low-order mode of the structure and that the high-order modes make fewer contributions in this regard. As to complex and large structures, however, contributions of high-order modes to the modal strain energy cannot be neglected. That being said, this paper proposed a weight coefficient that could reflect the very contributions of high-order modes, taking into consideration both the great energy required by observation stations and contributions of all modes to the modal strain energy.
For large-scale structures, due to highly distinct vibration distribution of modes, the contribution of high-order modes to the modal strain energy cannot be ignored. In order, not to overlook the contributions to the strain energy of all modes and improve the accuracy of the result, we come up with a weight coefficient reflecting the contributions of high-order modes to amend the matrix of modal vibration modes. The weigh coefficient is calculated through:
where represents the frequency of -order and weight coefficient of -order.
5. Verification of theoretical calculations
Fig. 1 shows the undamped 2-DOF free-vibration system.
Fig. 12-DOF free-vibration system
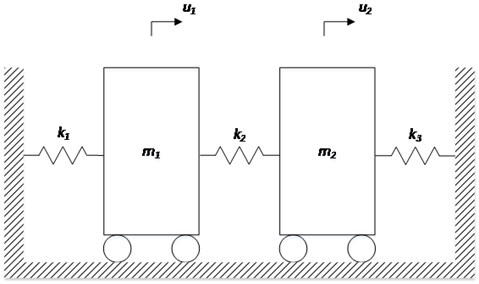
The figure shows the undamped 2-DOF free-vibration system, and the differential equation of free-vibration motion is written as:
where:
Assume that there is a natural vibration and integrate it into Eq. (17):
where , we get:
After obtaining the two inherent frequencies of the system and through , integrate them into Eq. (18) and we then get the corresponding natural modes of vibration and .
As the mass presents to be uniform, namely, , we have:
two natural modes of vibration are:
Based on the conventional modal assurance criterion Eq. (14), we have:
Based on the improved modal assurance criterion Eq. (15), we have:
It can be inferred hereby that both the conventional and improved modal assurance criteria could ensure the vector orthogonality of two modes.
As the mass presents to be non-uniform, namely, , , we have:
two natural modes of vibration are:
Based on the conventional modal assurance criterion Eq. (14), we have:
Based on the improved modal assurance criterion Eq. (15), we have:
As the mass presents to be non-uniform, the conventional modal assurance criterion could not ensure that vectors of two modes of vibration are weighted-orthogonal to the mass but the new one proposed in this paper can. According to the vibration theory, the vectors of two modes of vibration should be weighted-orthogonal in a two-degree-of-freedom vibration system regardless of the masses. In this way, shortcomings of the conventional model assurance criterion cannot be more prominent. Only when the masses of each nodes equate one another can the MAC calculation formula of the conventional modal assurance criterion reflect the weighted orthogonality of the modes of vibration. When the masses of each node differ, the formula cannot be taken to examine the weighted orthogonality. The new modal assurance criterion, hopefully, can be used to check the weighted orthogonality of two modes of vibration.
6. Verification of Garteur aircraft simulation tests
6.1. Hybrid optimization algorithm
The selection of an observation station when applying mode strain energy is decided by the total energy of all target modes at the station, which will lead to information loss of some target modes due to uneven energy distribution of orders in large and complex structures. To tackle this dilemma, guided by the method mentioned here, we select observation station according to the average modal strain energy coefficients of each station.
From the Eq. (13), we may infer the modal kinetic energy coefficient of the th freedom degree at th order, namely:
Then, we may get the average modal strain energy coefficient of the th freedom degree:
By combining Eq. (11) with Eq. (31), we may arrive at the average kinetic energy coefficient method based on the effective independence method:
After the iterative calculation of , we may choose the observation station that corresponds to the maximum element of until the maximum values of non-diagonal elements of MAC matrix that corresponds to all selected stations are qualified. In order to avoid concentrated stations, we need first to see whether the distances between the newly added station and any of the other selected ones are longer than , which are already smallest. Herein:
There-into, is a constant, representing the smallest distance determined. That the areas with greater structural vibration are equipped with more sensors and vice versa will not only ensure the completeness and independence of the target modes but also avoid concentrated stations.
6.2. Optimized arrangements of observation and comparisons
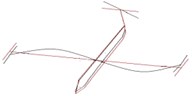
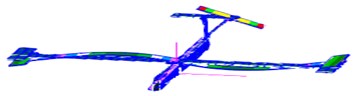
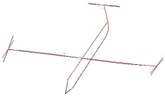
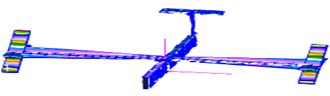
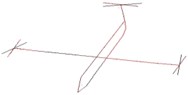
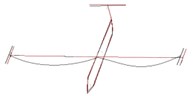
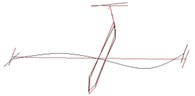
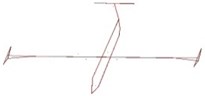
Conduct the simulation respectively through the average mode strain energy coefficient method based on the effective independence method, the weighted average mode energy coefficient method based on the effective independence method and the weighted average mode energy coefficient method based on the effective independence method with the new assurance criterion proposed in this paper and compare and contrast the outcomes of the hybrid optimization algorithm under the two modal assurance criteria. Comparisons and contrasts are shown in Fig. 3.
Fig. 3Two optimized arrangements of observation stations in in comparisons
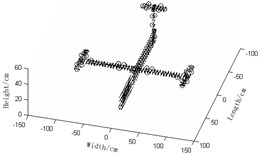
a) Average mode strain energy coefficient method based on the effective independence method
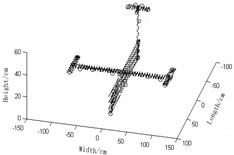
b) Weighted average mode energy coefficient method based on the effective independence method
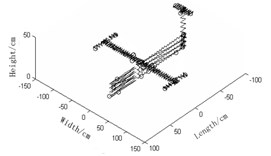
c) Weighted average mode energy coefficient method based on the effective independence method with new assurance criterion proposed in this paper
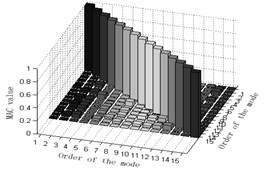
d) MAC-value orthogonal graph of a)
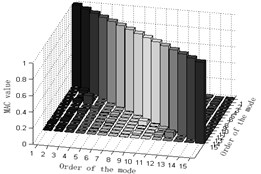
e) MAC-value orthogonal graph of b)
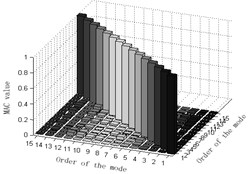
f) MAC-value orthogonal graph of c)
Judging from Fig. 3, we can see:
1) Observation station arrangement Fig. 3(a) the average mode strain energy coefficient method based on the effective independence method and Fig. 3(b) the weighted average mode energy coefficient method based on the effective independence method, the number of sensors required in Fig. 3(a) is densely 42, far fewer than that in Fig. 3(b) whose distribution of observation stations is relatively scattered and even, making the modal data-acquisition test much easier and cheaper. It can be concluded hereby that the introduction of the weight coefficient could magnify the contributions of the high-order modes and improve the effectiveness of tests. Observation station arrangement graphs of Fig. 3(b) the weighted average mode energy coefficient method based on the effective independence method and Fig. 3(c) the weighted average mode energy coefficient method based on the effective independence method with the new modal assurance criterion proposed in this paper indicate that the number of observation stations in the latter is 6 fewer than that in the former and that the layout of stations in Fig. 3(c) is relatively scattered and even. At this rate, the modal data-acquisition test is much easier and cheaper, implying that the betterment of modal assurance criterion will, to some extent, improve the accuracy of tests. By looking at observation station arrangement Fig. 3(a) average mode strain energy coefficient method based on the effective independence method and Fig. 3(c) the weighted average mode energy coefficient method based on the effective independence method with the new modal assurance criterion proposed in this paper , we may see that the number of observation stations in the latter is 15 fewer than that in the former and that stations in Fig. 3(c) is much more scattered and evenly distributed. To sum up, the weighted average mode energy coefficient method based on the effective independence method with the new modal assurance criterion proposed in this paper turn out to be the optimal regime in that its disperse and even distribution of sensors best retain the genuine and complete dynamic characteristics of the measured structures;
2) MAC matrix non-diagonal element values of Fig. 3(d) the average mode strain energy coefficient method based on the effective independence method are partially larger, suggesting that the orthogonality between target modes of vibration is not so good and that two optimization programs of Fig. 3(d) are undesirable. MAC matrix non-diagonal element values of Fig. 3(e) weighted average mode energy coefficient method based on the effective independence method are rather small, suggesting that the orthogonality between target modes of vibration is pretty good and that optimization programs of Fig. 3(e) are feasible. Presumably, the weight coefficient will work in favor of the observation station optimization of structures. MAC matrix non-diagonal element values of Fig. 3(f) weighted average mode energy coefficient method based on the effective independence method with the new modal assurance criterion proposed in this paper are close to zero, suggesting that the orthogonality between target modes of vibration in this case is very good and that Fig. 3(f) could best ensure the orthogonality. In conclusion, the new modal assurance criterion could facilitate observation station optimization. Briefly speaking, optimization programs of Fig. 3(c) in this paper is the best one.
7. Simulation experiment
The GARTEUR airplane model is a typical standard aircraft developed by the European Aviation Technology Research Organization Structures and Materials Working Group that has 12 members and it features density, high flexibility and low modal frequency of a real aircraft. Having modeled it using Patran and simulated it through the weighted average mode energy coefficient method based on the effective independence method with the new modal assurance criterion proposed in this paper we got an optimization scheme, conducted a modal experiment and finally compare the resultant parameters with the ones obtained from modeling practices. Devices and analysis software applied in the modal test:
(1) Suspension: Use elastic ropes and detailed suspension points are shown in Fig. 4. Hereby, the suspension frequency measured 1.5 Hz and the inherent frequency of the first-order mode of the observed structure measured 6.162 Hz. As the suspension frequency was smaller than 1/3 of the inherent frequency in this case, the suspension requirements of a modal test were fulfilled and the effects that suspension may have on the first-order mode could be neglected.
(2) One hammer and one PCB acceleration sensor, sensor fixation: the super glue 502, the arrangement of observation stations are seen in Fig. 4, run-station test mode was applied.
(3) Data-collecting platform and software: the platform is the USB-4431 data collected of NI; signal collecting and analyzing software is NJSamp.
(4) Software for modal analysis: NJModal.
The observation station arrangement of the sensors and the establishment of the experimental platform are shown in Fig. 4.
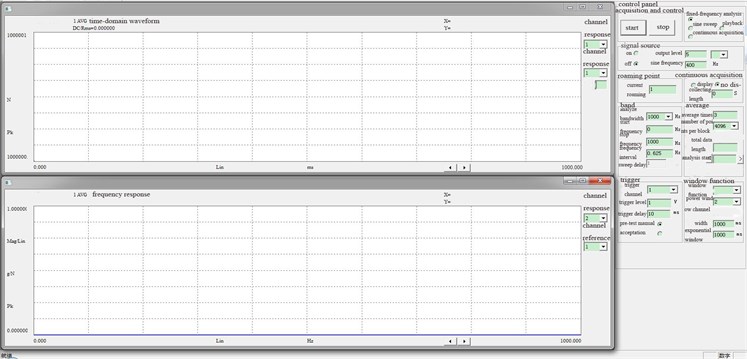
The interface of the Software NJSamp collecting and analyzing signals is shown in Fig. 5.
Fig. 4The observation station arrangement of the sensors and the establishment of the experimental platform
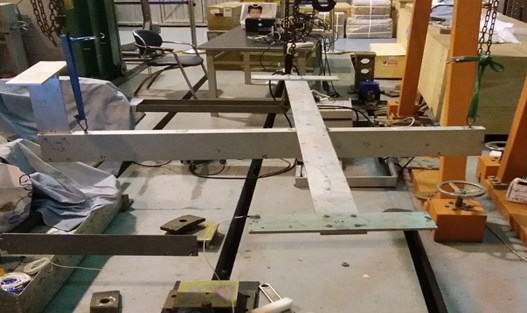
Fig. 5The interface of the Software NJSamp collecting and analyzing signals
7.1. Simulation experiment of the weighted average mode energy coefficient method based on the effective independence method with the new modal assurance criterion proposed
The simulation was designed to test the program derived from the weighted average mode energy coefficient method based on the effective independence method with the new modal assurance criterion proposed in this paper. The optimized layout of observation stations involved in this program is shown in Fig. 3(c).
a) Observation station coordinates of the weighted average mode energy coefficient method based on the effective independence method with the new modal assurance criterion proposed.
b) Frequency response function curve of the weighted average mode energy coefficient method based on the effective independence method with the new modal assurance criterion proposed.
c) Frequency of the experiment with the method proposed in this paper vs. that of modeling simulation.
d) The comparison and contrast of MAC matrix orthogonal graphs is shown in Fig. 7.
e) Vibration mode of the test with the method proposed in this paper vs. that of Patran simulation.
Table 1Coordinate – based locations of sensor placement
Number of observation stations | Coordinate | Coordinate | |||||
Number of observation stations | |||||||
1 | –85 | –20 | 45 | 15 | –5 | –25.4 | 17.6 |
2 | –85 | 20 | 45 | 16 | –5 | 25.4 | 17.6 |
3 | –20 | 95.2 | 17.6 | 17 | 55 | 2.1 | 10 |
4 | –20 | –95.2 | 17.6 | 18 | –85 | –0.5 | 0 |
5 | 20 | –95.2 | 17.6 | 19 | 60 | –2.1 | 0 |
6 | 20 | 95.2 | 17.6 | 20 | 45 | –2.1 | 15 |
7 | 0 | 40.4 | 16.6 | 21 | 45 | 2.1 | 0 |
8 | 0 | –40.4 | 16.6 | 22 | 5 | 15.5 | 16.6 |
9 | 0 | 70.3 | 16.6 | 23 | 5 | –15.5 | 16.6 |
10 | 0 | –70.3 | 16.6 | 24 | –15 | 2.1 | 0 |
11 | 0 | 95.2 | 17.6 | 25 | –30 | –2.1 | 0 |
12 | 0 | –95.2 | 17.6 | 26 | 0 | 2.1 | 0 |
13 | –80 | –0.5 | 43 | 27 | –70 | 2.1 | 0 |
14 | –85 | 0.5 | 15 | ||||
Fig. 6Frequency response function logarithmic curve
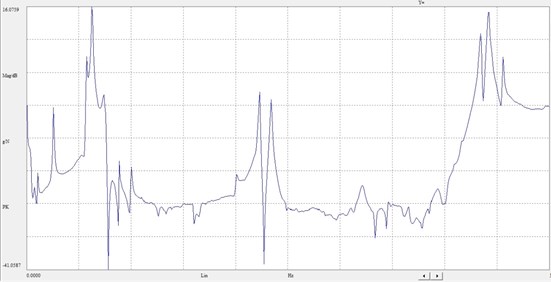
Table 2Experiment frequency and simulation frequency
Order | Experiment frequency / Hz | Simulation frequency / Hz | Error % |
1 | 6.091 | 6.162 | 1.166 |
2 | 16.601 | 16.109 | 2.964 |
3 | 36.973 | 35.826 | 3.102 |
4 | 37.577 | 37.519 | 0.154 |
5 | 37.670 | 39.199 | 4.058 |
6 | 48.757 | 46.934 | 3.739 |
7 | 49.183 | 47.202 | 4.028 |
8 | 56.919 | 55.451 | 2.579 |
9 | 65.363 | 63.212 | 3.291 |
10 | 73.818 | 73.108 | 0.962 |
11 | 97.034 | 98.111 | 1.110 |
12 | 137.410 | 138.794 | 1.007 |
13 | 143.650 | 145.280 | 1.135 |
14 | 159.050 | 160.102 | 0.661 |
15 | 229.030 | 229.479 | 0.196 |
Fig. 7Comparison and contrast of MAC matrix orthogonal graphs
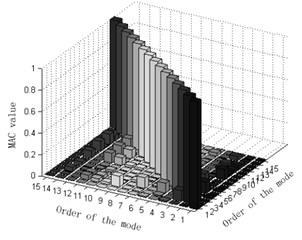
a) Experimented MAC matrix orthogonal graph

b) Simulated MAC matrix orthogonal graph
After studying the experiment and simulation, we may find that the error of the frequency obtained from the weighted average mode energy coefficient method based on the effective independence method with the new modal assurance criterion proposed and the simulated frequency is less than 5 % and that the MAC matrix orthogonal graphs of the two are quite similar. Furthermore, vibration modes obtained from the experiment are mass-weight orthogonal; modal shape graphs of the experiment test and the simulation are almost the same. Therefore, it’s fair to say that the weighted average mode energy coefficient method based on the effective independence method with the new modal assurance criterion proposed well ensured the integrity and linear independence of the monitoring mode sand linear independence of the monitoring mode. Better still, the introduction of the weight coefficient effectively magnified the contribution of high-order modes to the modal strain energy and made the results of experiments more validly accurate. In the final analysis, these are all of great application-oriented in arranging and optimizing observation stations of large structures.
Fig. 8Modes of vibration obtained respectively from two algorithms and modeling
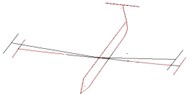
a) Experimented vibration mode of the 1st order

b) Simulated vibration mode of the 1st order
c) Experimented vibration mode of the 2nd order
d) Simulated vibration mode of the 2nd order
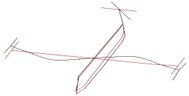
e) Experimented vibration mode of the 3rd order
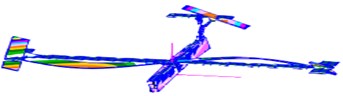
f) Simulated vibration mode of the 3rd order
g) Experimented vibration mode of the 4th order
h) Simulated vibration mode of the 4th order
i) Experimented vibration mode of the 5th order

j) Simulated vibration mode of the 5th order
k) Experimented vibration mode of the 6th order

l) Simulated vibration mode of the 6th order
m) Experimented vibration mode of the 7th order

n) Simulated vibration mode of the 7th order
o) Experimented vibration mode of the 8th order
p) Simulated vibration mode of the 8th order
8. Applications in engineering
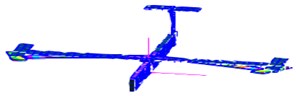
With the method proposed in this paper, we have developed an observation station layout optimization software of large structural modes based on MATLAB language and applied it to the observation station optimization of the modal test of a carrier rocket. The finite-element model of the rocket is shown in Fig. 9.
Fig. 9The finite-element model of the rocket
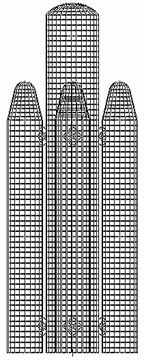
Fig. 10Layout of observation stations
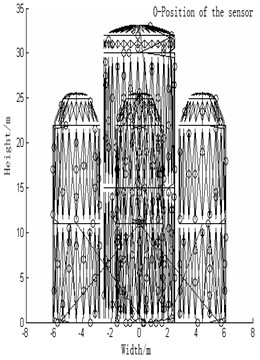
Start the software, input the PCH file of the finite-element model of the rocket, identify the parameters (the row vector of freedom, the minimum node number, the maximum order of modes, the distance between observation stations, the order of the target mode, the expectant number of sensors, the expectant MAC value), and then the calculation will begin. The resultant observation station layout is shown in the Table 3.
The layout scheme is shown in Fig. 10. Numbers in the Fig. 10 mean: the height of the rocket measures 33.1 meters; the width measures12 meters; the number of sensors after optimization is 208. o denotes the location of sensors.
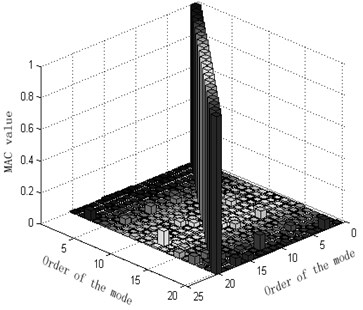
The column of MAC matrix is shown in Fig. 11.
The modal test of a large carrier rocket that was conducted on the basis of the method proposed in this paper demonstrates that this algorithm has guaranteed the integrity and linear independence of the modes monitored and that it can ensure the optimization and arrangement of observation stations in the modal test of large and complex structures. It has also been proved that the algorithm in discussion has successfully averted the ineffective observation station layout and optimization confronted by conventional algorithms and provided the optimal number of the observation stations and their coordinate locations.
Table 3Layout of observation stations
Number of observation stations | Coordinate | Number of observation stations | Coordinate | ||||
1 | –1.57 | 4.96 | 5.00 | 15 | –3.12 | –0.97 | 5.00 |
2 | –3.94 | 1.57 | 17.5 | 16 | 1.33 | –5.42 | 20.5 |
3 | 4.96 | 1.57 | 1.00 | 17 | –1.57 | –3.94 | 12.50 |
4 | –4.96 | –1.57 | 9.00 | 18 | –1.57 | 3.94 | 9.00 |
5 | –2.80 | 0.00 | 13.00 | 19 | 4.96 | –1.57 | 3.00 |
6 | 1.57 | 3.94 | 21.50 | 20 | 3.94 | 1.57 | 8.00 |
7 | 1.33 | 3.48 | 14.00 | 21 | 1.57 | 4.96 | 7.00 |
8 | 0.25 | 1.65 | 0.00 | 22 | –0.51 | 6.02 | 1.00 |
9 | 3.48 | –1.33 | 16.50 | 23 | –1.57 | 4.96 | 17.00 |
10 | –0.97 | –3.12 | 16.50 | 24 | 1.72 | –1.81 | 30.50 |
11 | –3.12 | 9.70 | 21.50 | 25 | –5.42 | 1.33 | 0.50 |
12 | –1.33 | –5.42 | 3.50 | 26 | 0.97 | –3.12 | 9.00 |
13 | 3.48 | –1.33 | 21.00 | … | … | … | … |
14 | 3.94 | –1.57 | 11.50 | 208 | –3.12 | 0.97 | 15.00 |
Fig. 11The column of MAC matrix
9. Conclusions
Calculations guided by two-degree freedom system equal mass and non-equal-mass theories were initiated and comparisons and contrasts were made for the above-mentioned two methods, the average mode strain energy coefficient method based on the effective independence method and the weighted average modal strain energy coefficient method based on effective independence method through Garteur simulation tests to examine the differences in their resultant observation station arrangements. Results have shown that the traditional mode assurance criterion could not be used to judge whether the modes are weighted orthogonally or not when various nodes differ in their masses, but the new criterion involved in this paper could. The introduction of the weight coefficient effectively averted the aggregation of observation stations, best ensured the contributions of all the modal strain energy and fulfilled what’s required by a preferred observation station arrangement. Model tests were also conducted by employing Garteur planes to test the weighted average mode energy coefficient method based on the effective independence method with the new modal assurance criterion proposed. It was found that the new modal mode assurance criterion guaranteed the completeness and linear independence of the monitoring mode, and that the weight coefficient introduced effectively magnified the contributions of the high-order modes to the modal strain energy, improved the accuracy of the test results. In the final analysis, the new assurance criterion is of great practical value to the observation station optimization and large-scale structure distribution. The method proposed in this paper has been applied to the modal test of a large carrier rocket and an observation station layout optimization software of large structural modes has been developed based on Matlab language. It has been validated that this algorithm has faithfully guaranteed the integrity and linear independence of the modes monitored and that it can ensure the optimization and arrangement of observation stations in the modal test of large and complex structures.
References
-
Tian Ye, Ling Ling, Hu Yujin On optimized distribution of large sensors in dynamic tests. Mechanics and Electronics, Vol. 6, 2013, p. 16-20.
-
Wu Ziyan, Jian Xiaohong, Zhang Bin On distribution optimization of multi-target sensors in vibration tests. Mechanical Strength, Vol. 30, Issue 6, 2008, p. 888-892.
-
Dai Hang, Yuan Aimin Structural Mode Amendment Based on Sensitivity Analysis. First Edition, Science Press, Beijing, 2001.
-
Dai Hang, Yuan Aimin, Sun Dasong Optimized layout of cable – stayed bridge sensors based on EI and MAC hybrid algorithm. Vibration, Testing and Diagnostics, Vol. 29, Issue 1, 2009, p. 55-59.
-
Kammer D. C. Sensor placement for on-orbit modal identification and correlation of large space structures. Journal of Guidance, Control, and Dynamic, Vol. 14, Issue 2, 1991, p. 251-259.
-
Kammer D. C., Yao L. Enhancement of on-orbitmoda identification of large space structures through sensor placement. Journal of Sound and Vibration, Vol. 171, Issue 1, 1994, p. 119-140.
-
Liao Boyu, Zhou Xinmin, Yin Zhihong Modern Mechanical Dynamics and Its Engineering Application. Mechanical Industry Press, Beijing, 2003.
-
Guyan R. J. Reduction of stiffness and mass matrices. AIAA Journal, Vol. 3, 1965, p. 2-380.
-
Meo Zumpano G. On the optimal sensor placement techniques for a bridge structure. Engineering Structures, Vol. 27, 2005, p. 1488-1497.
-
Cynthia Swann, Aditi Chattopadhyay Optimization of piezoelectric sensor location for delamination detection in composite laminates. Engineering Optimization, Vol. 38, Issue 5, 2006, p. 511-528.
-
Kammer D. C., Brillhart R. D. Optimal sensor placement for modal identification using system-realization methods. Journal of Guidance, Control, and Dynamic, Vol. 19, 1996, p. 729-731.
-
Worden K., Burrows A. P. Optimal sensor placement for fault detection. Engineering Structures, Vol. 23, 2001, p. 885-901.
-
Lein K. A., Elard M. G., Spreij P. On the resultant property of the Fisher information matrix of a vector ARMA process. Linear Algebra and Its Applications, Vol. 403, Issues 1-3, 2005, p. 291-313.
-
Liu Wei, Gao Weicheng, Li Hui, Sun Yi On methods of optimizing sensor distribution based on effective independence algorithm. Vibration and Shock, Vol. 32, Issue 6, 2013, p. 54-62.
-
Qin Xianrong, Zhang Lingmi An step-by-step accumulative sensor arrangement based on QR decomposition. Vibration, Testing and Diagnostics, Vol. 21, Issue 3, 2001, p. 168-173.
-
Dai Jiangbo, Ji Guoyi Parameter recognition of Garteur airplane models. Noise and Vibration Control, Vol. 33, Issue 3, 2013, p. 73-78.
-
Yang Yaxun, Hao Hongwu, Sun Lei Optimized sensor distribution of bridge structures based on energy coefficient-effective independence method. Vibration and Shock, Vol. 29, Issues 11-119, 2010, p. 123-134.
Cited by
About this article

