Abstract
The dynamics of light cantilever structure are complex under high-frequency reciprocating motion, and they cannot be obtained through simulation analysis. Therefore, it is necessary to use experimental analysis methods to study. At present, the main experimental method is to collect the vibration response of the sensors on the structure and then to analyze the dynamics. However, for light cantilever structure, the additional mass of the sensors changes the dynamics of the structure significantly, resulting in large errors in the results. The paper takes the sorting arm of LED chip sorting machine as the research object. An on-line identification of vibration experiment is carried out to obtain the dynamics of sorting arm with using of strain gauges, which avoided the error of the attached mass of the sensors. In addition, the result of experimental comparison verifies that using the strain gages can measure each mode of the arm structure more accurately. The method provides the guiding principle and basis for the dynamic optimization of the sorting arm mechanism.
Highlights
- The purpose of this paper is to analyze the modal parameters of the LED chip sorting arm by optimizing the arrangement of strain sensors.
- The method provides the guiding principle and basis for the dynamic optimization of the sorting arm mechanism.
1. Introduction
The structure of the mechanism is composed of many elastic parts. The stiffness of the entire system is related to the terminal position and operating parameters [1]. It is difficult to establish a mechanism model [2] accurately due to the changes in stiffness and damping under the operating state. At present, the theoretical modelling methods of mechanism, such as the Multibody Theory and finite element method, cannot reach the actual requirements, which must be established on the basis of experiments and measurements [3].
The optimal placement of sensors is first encountered in the field of aerospace systems identification and dynamic control. How to choose the sensor and their placement are the most critical issues of best control and recognition effects. In recent years, more and more researches have been conducted on the sensor placement, such as the application of sensor placement to bridge health monitoring [4]. Carne and Dohmann emphasized that the sensor deployment should be based on good modal experimental results with good visibility and robustness [5]. The deformation of the structure provides the basis for monitoring the operation status, which can be regarded as the basis of the modal parameter identification [6, 7]. Sun Jin applied the effective independent method to the sensor arrangement on the modular fixture [8]. The idea of strain energy method proposed by Hemez is that the position where the larger modal strain energy is the position where the response is larger. It is effective to arrange the sensors at these points to identify the parameters [9]. The non-optimal origin method (NODP) is an energy-based approach whose idea is that the vibration energy is related to the relative position between the sensors and nodal Line of modal shapes [10]. By removing the small position of the modal displacement, the remaining positions are the optimal point of sensor arrangement. Salama arranges the vibration sensors by using of the simulated annealing algorithm to analyze the correlation of mode [11].
At present, there are many rules for optimal placement, such as MAC method [12], effective independence method [13], random class algorithm, inference algorithm [14], genetic algorithm [15], guyan reduction method [16]. However, these algorithms all have the problem of local optimal solution. The method of sensors placement basically takes the displacement as the target to optimize the displacement of the sensor, such as the effective independent method (EFI) proposed by Kammer [17], the non-optimal origin (NODP) method proposed by Imamovic N. [10], the optimization methods based on kinetic energy proposed by Heo [18]. These methods have a common feature which is using displacement sensors. However, due to the shortcomings of the displacement sensors, the study of damage detection with strain gauges has attracted more and more attention in recent years [19, 20]. Because there is no consistent correspondence between strain and displacement in spatial coordinates, the above-mentioned methods are not applicable to the location optimization of strain sensors, and there is little research about it.
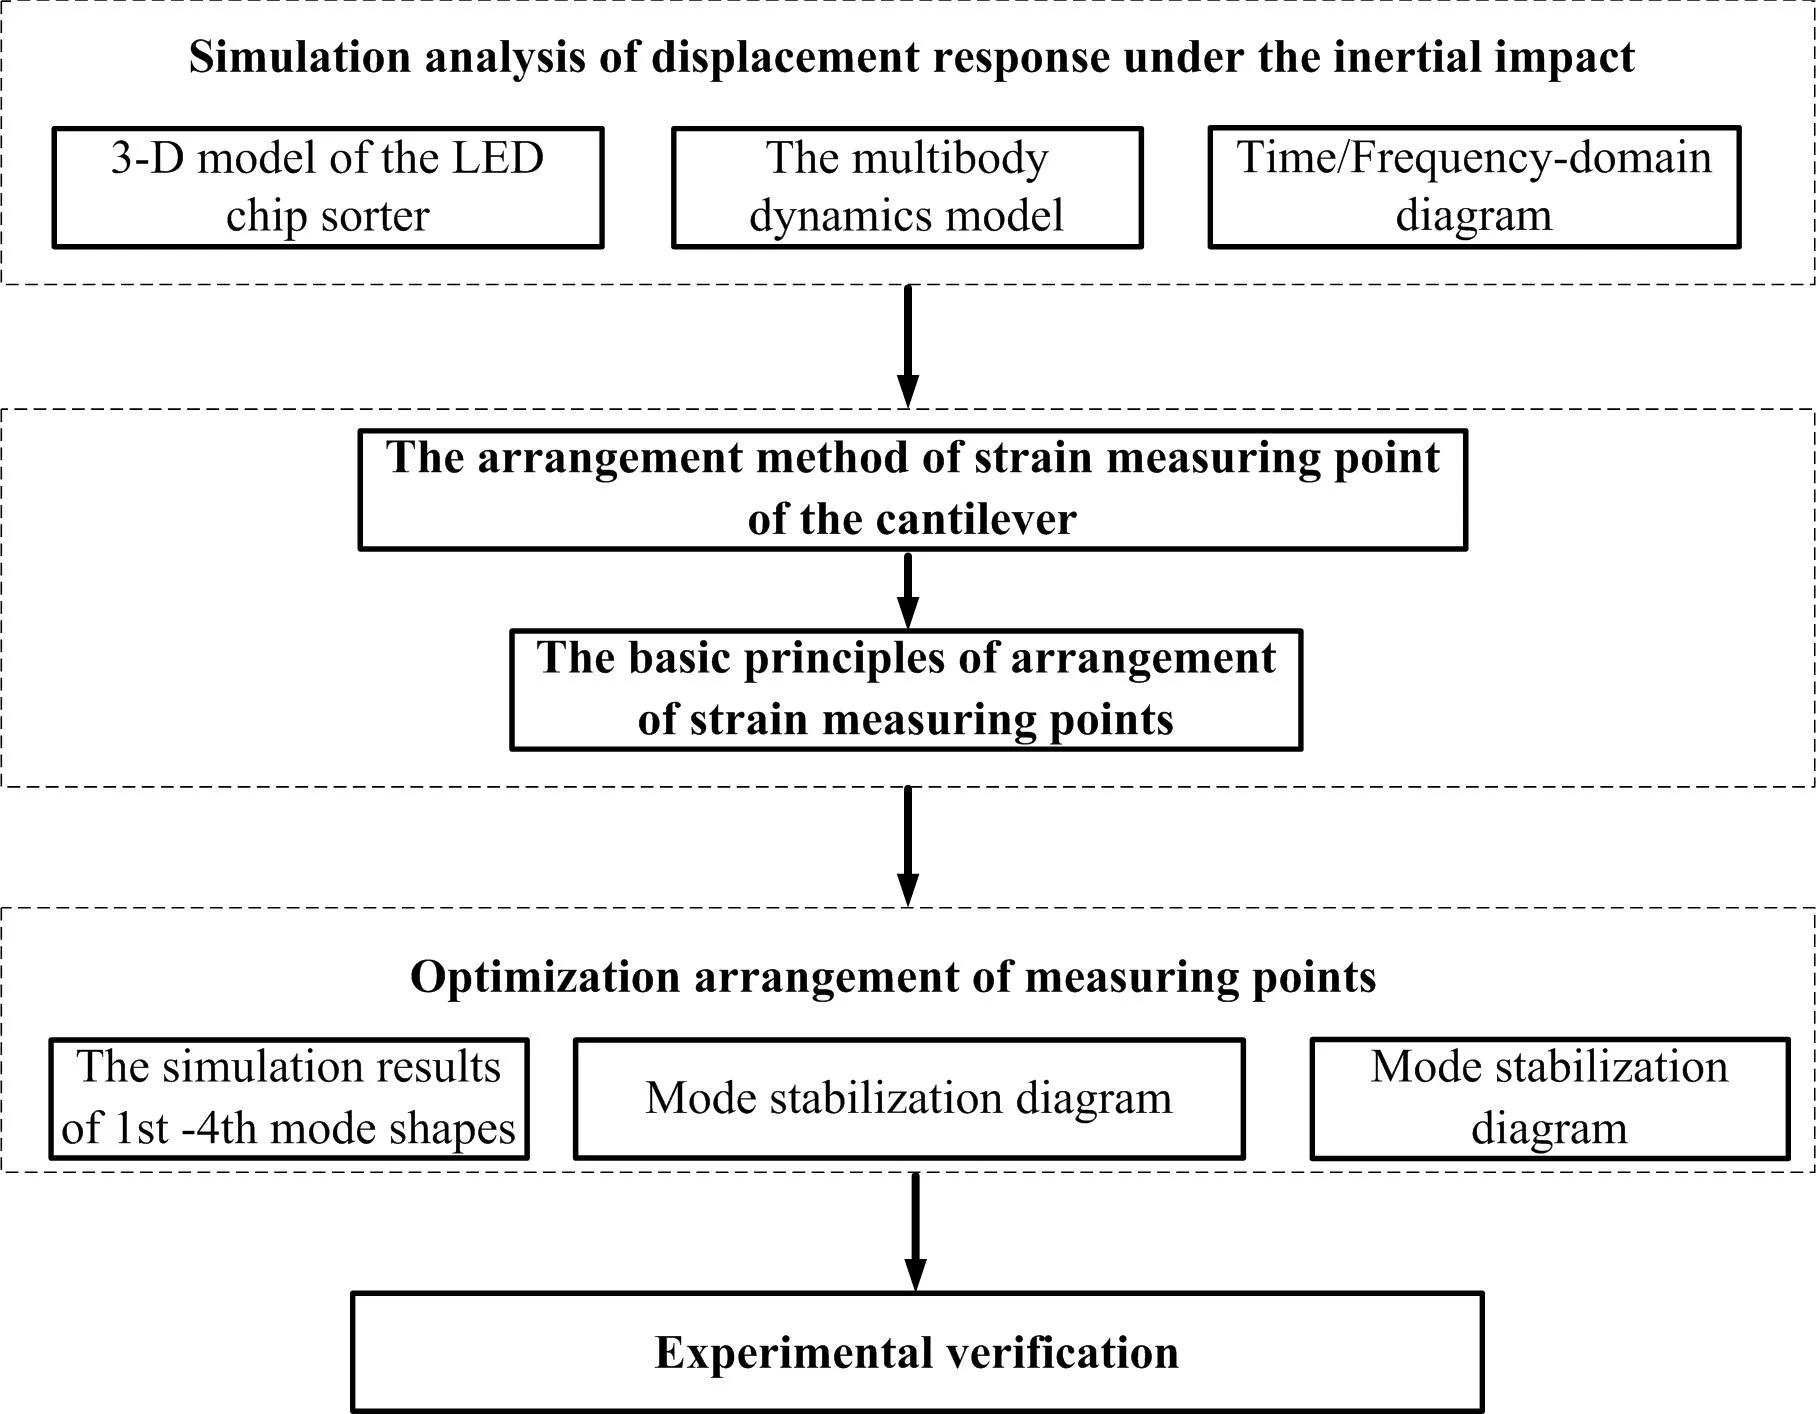
Considering the shortcomings of the above-mentioned methods, an experiment for identifying modal parameters under high frequency reciprocating motion is carried out, which is based on strain mode and EMA (Experimental Modal Analysis) method [21]. This experiment expands the application scope of the classic EMA and reduces the error because of the additional mass of the actual sensors. The main purposes of the study are (i) to qualitatively analyze the dynamics of the sorting arm through simulation and (ii) to explore the optimization method of strain measurement points and (iii) to analyze the dynamics of the sorting arm through EMA.
2. Simulation analysis of displacement response of the sorting arm under the inertial impact
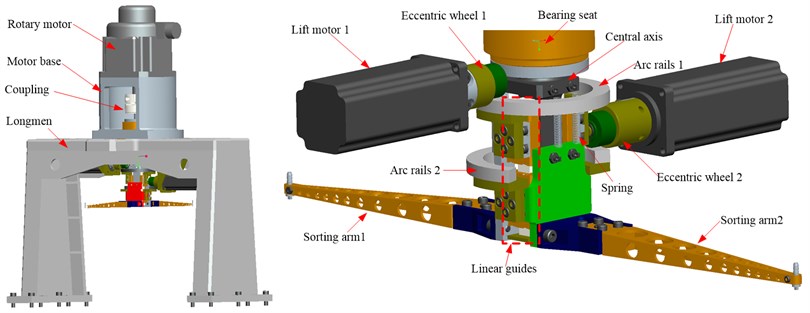
Fig. 1 presents the sorting arm, the main movement is a 180° reciprocating rotation that is driven by the control motor. The up and down movement is driven by two lifting motors through an eccentric wheel, the arc guide, the spring and the linear guide. The arrangement of two chips can be completed within one revolution. The precision requirements of LED chip sorting equipment are shown in Table 1. During operation, the acceleration and deceleration of each component bring an inertial impact, which causes the vibration of the sorting arm and then affects the positioning accuracy. Therefore, the dynamics of the sorting arm have an impact on the movement speed and positioning accuracy of the LED chip sorter.
Fig. 1The 3-D model of the LED chip sorter
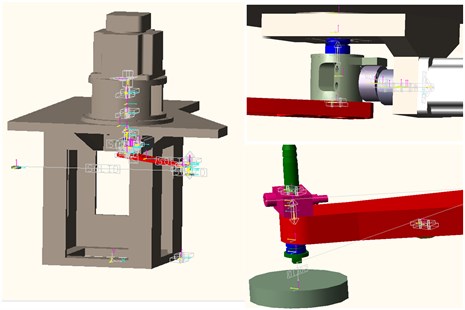
To study the dynamics of a sorting arm under high-frequency reciprocating operation, the multi-body dynamics model is established by the multi-body analysis software RecurDyn [22]. The settings of the kinematics, constraints, and driver in the model are the same as the rigid body dynamics settings. In this model, a gantry rack is considered a rigid body for calculations, and the simulation results include the relationship between the cam, the coupling, the spring and the guide rail.
This model is set by the laws of acceleration and deceleration, which is different from the static modal analysis. The characteristics of the actual operation of the sorting arm mechanism are simulated. The vibration analysis is carried out under the reciprocating operation. Fig. 2 presents the multi-body dynamic model of an LED chip sorter, as established by the RecurDyn software.
Table 1Accuracy requirements
Accuracy | Error rate | |
direction | ±25.4 μm | 0.3 % |
direction | ±25.4 μm | 0.3 % |
direction | ±3° | 0.3 % |
Loss rate | 0.3 % | |
Rotation direction position | ±5 μm | |
Lifting direction position | ±5 μm | |
Angle direction position | ±5 ″ | |
Fig. 2The multibody dynamics model
A model excitation simulation is used with the law of evenly accelerating motion to control the motor. According to the time displacement curve of the roller coupling, the influence of the operating parameters on the displacement of the end of the sorting arm is analysed.
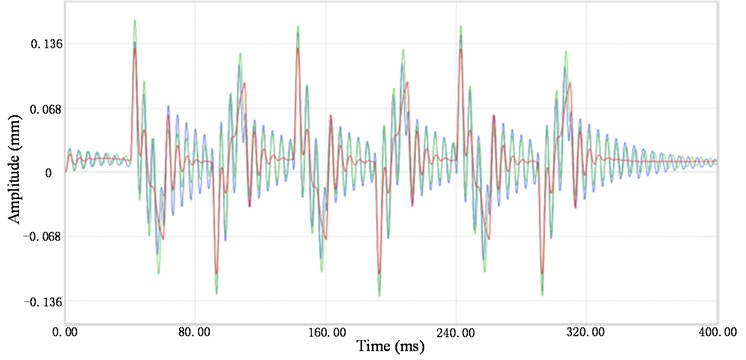
The setting of the arm working status refers to the working design frequency. The simulation model uses three operating frequencies; 3 Hz, 6 Hz and 10 Hz. Since the arm’s vibration directly affects the chip placement and pickup accuracy in the rotation direction, the arm’s time-displacement curve in the rotation direction is analysed. Fig. 3(a) presents the time-domain diagram of the displacement vibration. The excitation caused by the operation has a significant effect on the displacement of the sorting arm, which also shows that the flexible characteristics of the arm can be reflected by the calculation model. The maximum vibration displacement of the end of the sorting arm is above 15 microns at three different frequencies. Therefore, it can be seen that the vibration of the sorting arm directly determines both the accuracy of the chip catching and the working efficiency under operation.
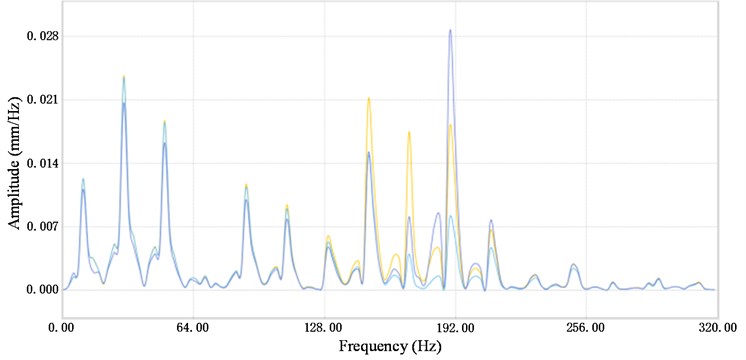
Fig. 3(b) presents a frequency-domain diagram of the three different operation frequencies. The displacement curve includes the rigid body displacement of the sorting arm itself, which should be removed. The arm’s end displacement vibration is basically unaffected by the operation frequency lower than 80 Hz, but there are some differences dynamics above 80 Hz. On the other hand, the frequency spectrum corresponding to the 3 Hz operation has no obvious peak in the low-frequency range, but there are multiple peaks in the low-frequency range for the 6 Hz and 10 Hz operations, and the peak change is not directly proportional to the operation frequency. The simulation considered the role of the cam, ball coupling, spring and rail as well as the other components. The displacement response of the arm’s end is affected by their interaction. The vibration spectrum does not increase as the operating frequency increases.
However, it is difficult to establish an accurate mathematical model because of the complicated features of the joints between the various components of the sorting arm mechanism. The boundary conditions between the components in the model make it difficult to accurately incorporate the actual operating conditions. Therefore, only qualitative analysis conclusions can be obtained by a theoretical calculation model that cannot incorporate the dynamics of the actual working state. The dynamics of the arm’s end must be obtained through experimental modal analysis.
Fig. 3a) Time-domain diagram, b) frequency-domain diagram
a)
b)
3. The arrangement method of strain measuring point
Debao Li established a correspondence between the modal expression based on the displacement response and the modal expression based on the strain response [23]. He noted that the natural frequencies of the strain vibration and the displacement vibration are the same and that their modal damping ratios are consistent. In this section, through the simulation analysis of the structural dynamics, the corresponding relationship between the mode shapes of the strain modal analysis and the displacement modal analysis is obtained, which provides a theoretical basis for the arrangement of the measuring points of the strain.
In order to make a comparative analysis of the mode shapes, this section first analyzes the simple cantilever beam structure. Fig. 4(a) presents a cantilever beam simulation diagram and Fig. 4(b) presents a finite element model. The length of the cantilever beam is 200 mm, the width is 15 mm, the thickness is 8 mm, the material is aluminum, the elastic modulus is 17 GPa, the Poisson’s ratio is 0.42, and the density is 2700 kg/m3. The displacement mode shapes (DMSs) and strain mode shapes (SMSs) of the cantilever beam are obtained through the simulation analysis. The relationship between the DMSs and the SMSs is studied which are the basic principles of arrangement of strain measuring points.
Fig. 4a) Simulation diagram of the cantilever, b) finite element model of the cantilever
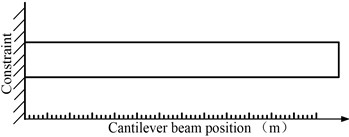
a)

b)
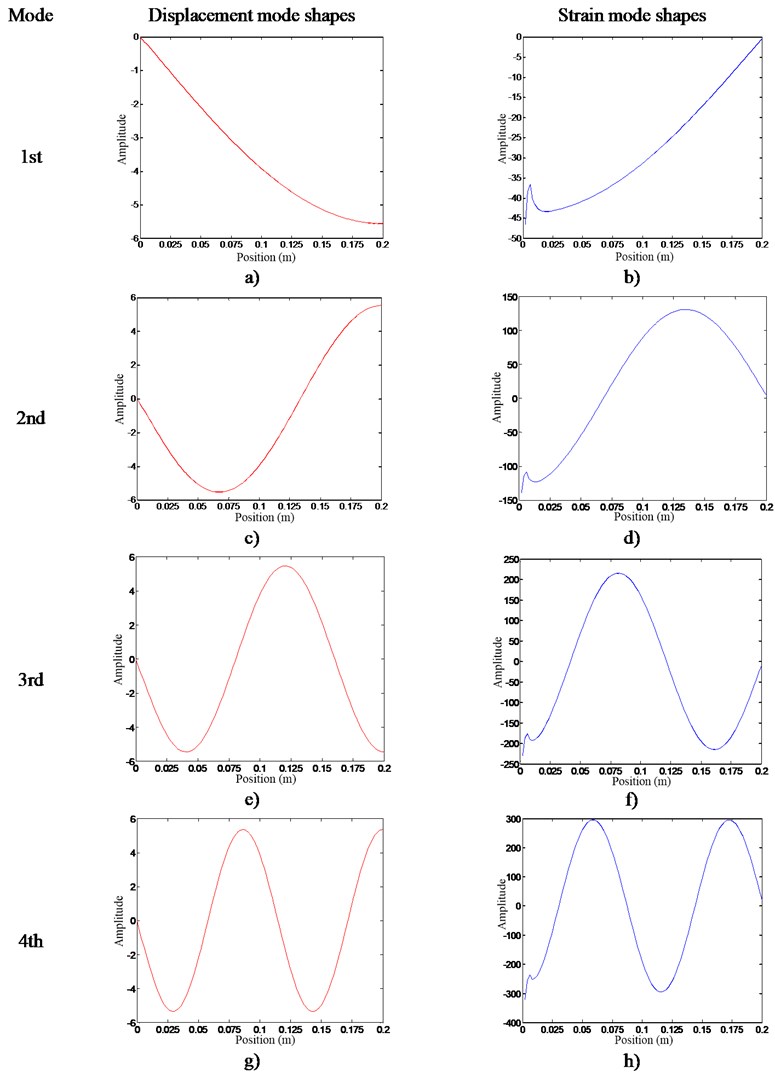
Fig. 5 shows the 1st-4th mode shapes vector obtained from the simulation. Fig. 5(a) presents DMSs which is the corresponding to displacement vibration. Fig. 5(b) presents SMSs which is the corresponding to strain vibration. The abscissa shows the different positions on the cantilever beam, and the ordinate shows the mode shape values. From the Fig. 5(a), it can be found that as the distance increases, the slope of the curve decreases gradually which indicates that the change rate of DMSs becomes smaller. In the same way, from Fig. 5(b), as the distance increases, the absolute value of the SMSs is getting smaller, and the strain caused by the vibration is getting smaller. Fig. 5(c-h) can be analyzed in the same way.
From the above analysis and comparison shows that the magnitude of the strain response is independent of the magnitude of the displacement response, and is related to the change rate of the displacement vibration response. The basic principles of arrangement of strain measuring points is as follows:
(i) The greater the change rate of displacement vibration, the greater the strain response. Therefore, the strain gauges should be placed at a position where the rate of change of DMSs is high, and the signal-to-noise ratio of strain measurement signal is better.
(ii) The location of the strain gages should be avoided from the nodes of DMSs where the change rate of strain at this location is 0, where the vibration response cannot be measured through the strain gauge.
(iii) The orientation of the strain gauges should be consistent with the direction of tension and compression.
4. Optimization arrangement of measuring points
According to the method of vibration analysis of the strain response, it is necessary to arrange the strain gauges in the structure reasonably and then carry out the vibration analysis through the strain response signals. According to the analysis results in Section 3, it can be seen that the strain gauges should be arranged at the positions where the change rates of DMSs are the highest. At this point, the greater the strain is, the greater the current signal is, and the higher the signal-to-noise ratio is.
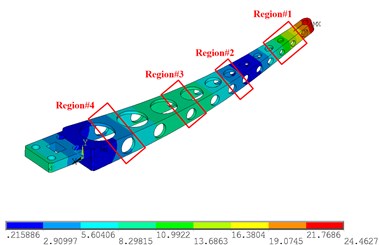
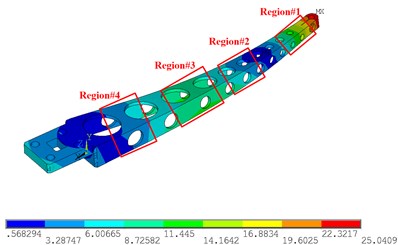
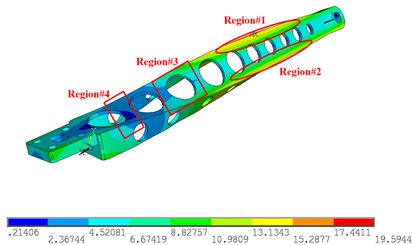
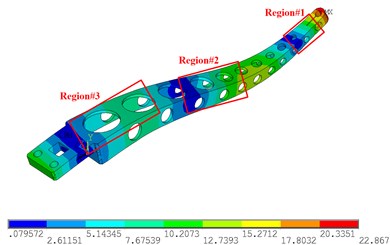
Fig. 6 shows the simulation results of the 1st-4th modes of the sorting arm. Fig. 6(a) shows the 1st mode shape, Fig. 6(b) shows the 2nd mode shape, Fig. 6(c) shows the 3rd mode shape, and Fig. 6(d) shows the 4th mode shape. For the 1st and 2nd modes, the mode shapes are in the form of a bending vibration, and the strain is along the long axis of the sorting arm. Therefore, the strain gauges should be arranged along the long axis of the sorting arm. However, since the change rates of the amplitudes of regions #1 and #2 are relatively large, the strain gauges should be attached to region #1 and region #2 to obtain the 1st mode and the 2nd mode. For the 3rd torsional mode, both sides of the sorting arm are stretched along the long axis, and the sorting arm is compressed in the transverse direction at this time.
Fig. 5The 1st -4th mode shapes of DMSs and SMSs: a) 1st DMSs, b) 1st SMSs, c) 2nd DMSs, d) 2nd SMSs, e) 3rd DMSs, f) 3rd SMSs, g) 4th DMSs, h) 4th SMSs
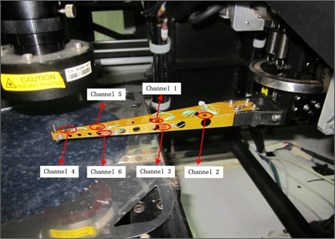
Therefore, the torsional mode shows the tensile stress not only along the long axis but also perpendicular to the long axis direction of the lateral compressive stress, as shown in Fig. 6(c). Therefore, the torsional mode shows not only the tensile stress in the direction of the long axis but also the horizontal compressive stress in the direction perpendicular to the long axis, and the strain gauges are arranged in the positions shown in Fig. 6(c). As a supplementary experiment, strain gauges were placed in the area shown in Fig. 6(d). The strain gauges are arranged in a direction perpendicular to the long axis for measuring the compressive stress of the torsional vibration. In the experiment, a DH5929 dynamic signal acquisition instrument was used to collect data, as shown in Fig. 7(b), with a sampling frequency of 20 KHz, and the measurement points of the strain gauges, as shown in Fig. 7(a).
Fig. 6The simulation results of 1st-4th mode shapes: a) 1st mode shapes, b) 2nd mode shapes, c) 3rd mode shapes, d) 4th mode shapes
a) 1st mode shapes
b) 2nd mode shapes
c) 3rd mode shapes
d) 4th mode shapes
Fig. 7a) Arrangement of strain gauges, b) DH5902 dynamic signal acquisition instrument
a)
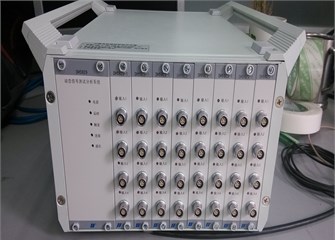
b)
5. Experimental verification
Due to the lightweight structure of the sorting arm, its dynamics can be changed significantly by the additional mass of the sensors, which can lead to large errors in the results. Therefore, the vibration response of the sorting arm is obtained by the strain gauges and a laser scanning vibrometer.
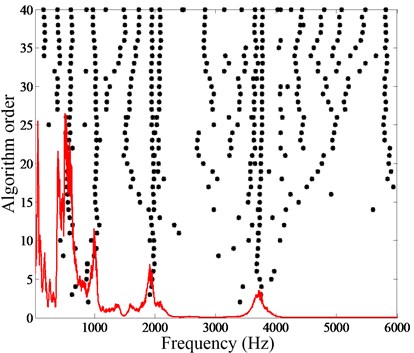
Fig. 8 presents the mode stabilization diagram which is obtained from the strain response signal. In the Fig. 8, “*” indicates the pole calculated by the mathematical model. According to the poles of the mode stabilization diagram, the natural frequency of the 1st-4th modes are 176 Hz, 426 Hz, 723 Hz, and 1019 Hz, respectively, when the sorting arm is stationary.
Fig. 8Mode stabilization diagram
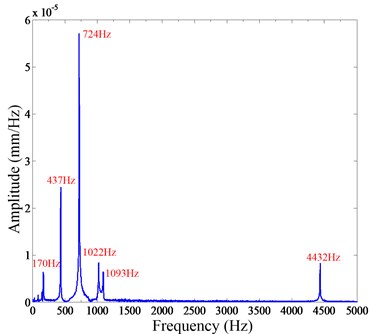
To verify the validity of the strain modal analysis method, a modal analysis was carried out using a laser scanning vibrometer. This method does not require additional sensors on the structure and does not produce additional mass, so it is the most accurate. Fig. 9 shows the vibration experimental setup that was conducted by a laser scanning vibrometer. The vibration response of the end of the sorting arm is measured by the laser scanning vibrometer. The sampling frequency is set to 7000 Hz. Fig. 10(a) shows the free response of the end of the sorting arm, and Fig. 10(b) is the FRF of the sorting arm. Over the range of 0-5000 Hz, the natural frequencies of the first four modes are 170 Hz, 437 Hz, 724 Hz and 1022 Hz, respectively.
Fig. 9Laser scanning vibrometer experimental system
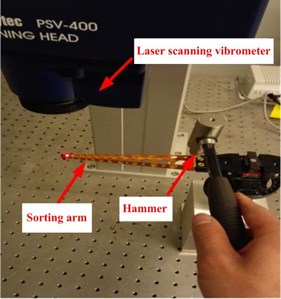
Table 2Comparison of analysis results
1st mode | 2nd mode | 3rd mode | 4th mode | |
Strain gauges | 169 Hz | 436 Hz | 723 Hz | 1019 Hz |
Laser scanner | 170 Hz | 437 Hz | 724 Hz | 1022 Hz |
Table 2 presents a comparison of the first four modal frequencies obtained by the two experimental methods. The results of the strain gauges are basically the same as those of the laser scanner, which shows that using the strain gauges can provide more accurate measurements of each mode of the sorting arm. Therefore, the dynamics of the sorting arm can be obtained through strain gauges. In addition, another advantage is that the additional mass of the strain gages is negligible.
Fig. 10a) Free vibration response, b) frequency response function
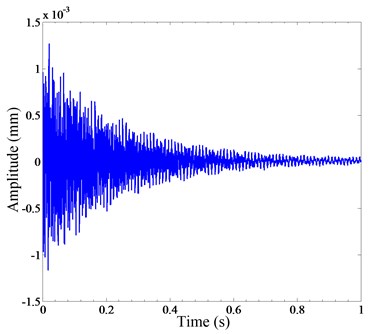
a)
b)
6. Conclusions
The paper takes the sorting arm of LED chip sorting machine as the studied object. The dynamics of sorting arm are complex under high-frequency reciprocating motion, and they cannot be obtained through simulation analysis. Therefore, it is necessary to use experimental analysis methods to study. At present, the main experimental method is to collect the vibration response of the sensors on the structure and then to analyze the dynamics. However, for lightweight sorting arm mechanisms, the additional mass of the sensors changes the dynamics of the structure significantly, resulting in large errors in the results. Therefore, this paper proposes an on-line measurement method of structure vibration using strain gauges. The method obtains the vibration response indirectly by the strain gauges, and then analyzes the dynamics of the sorting arm. Due to the lighter weight strain gauges, which solves the problem of the low precision of the experimental data because of the additional sensors’ weight. The main research work is summarized as follows.
1) It is difficult to establish the accurate mathematical model because of the complicated features of the joints between the various components of the sorting arm mechanism. Therefore, the qualitative analysis conclusions can only be obtained by the theoretical calculation model, which cannot reflect the dynamics of the actual working state. The dynamics of the arm’s end need to be obtained through experimental modal analysis.
2) The basic principles of arrangement of strain measuring points is as follows: (1) The strain gauges should be placed at a position where the rate of change of DMSs is high, and the signal-to-noise ratio of strain measurement signal is better. (2) The location of the strain gages should be avoided from the nodes of DMSs where the change rate of strain at this location is 0. (3) The orientation of the strain gauges should be consistent with the direction of tension and compression.
3) The results of experimental verification show that using the strain gages can measure each mode of the arm structure more accurately. The dynamics of the sorting arm can be obtained through the strain gauge.
References
-
Law M., Altintas Y., Phani A. S. Rapid evaluation and optimization of machine tools with position-dependent stability. International Journal of Machine Tools and Manufacture, Vol. 68, 2013, p. 81-90.
-
Tian H., Li B., Liu H., Mao K., Peng F., Huang X. A new method of virtual material hypothesis-based dynamic modeling on fixed joint interface in machine tools. International Journal of Machine Tools and Manufacture, Vol. 51, Issue 3, 2011, p. 239-249.
-
Quintana G., Ciurana J. Chatter in machining processes: A review. International Journal of Machine Tools and Manufacture, Vol. 51, Issue 5, 2011, p. 363-376.
-
Huidong Gao, Jose Rose L. Sensor placement optimization in structural health monitoring using genetic and evolutionary algorithms. Proceedings of the SPIE, Vol. 6174, 2006, p. 617410.
-
Nishio M., Mizutani T., Takeda Structural shape reconstruction with consideration of the reliability of distributed strain data from a Brillouin-scattering-based optical fiber sensor. Smart Material and Structures, Vol. 19, 2010, p. 035011
-
Thomas Carne G., Dohrmann Ft Clark A modal test design strategy for model correlation. 13th Modal Analysis Conference, 1995, p. 6-9.
-
Yayli M. Ö. Torsional vibration analysis of nanorods with elastic torsional restraints using non-local elasticity theory. Micro and Nano Letters, Vol. 13, Issue 5, 2018, p. 595-599.
-
Jin Sun, Yu Kuigang, Lai Xinmin, Liu Yinhua Sensor placement strategy for fixture variation diagnosis of compliant sheet metal assembly process. Assembly Automation, Vol. 29, Issue 4, 2009, p. 358-363.
-
Cobb Richard G., Liebst Brad S. Sensor placement and structural damage identification from minimal sensor information. AIAA Journal, Vol. 35, Issue 2, 1997, p. 3369-3741.
-
Imamovic N. Model Validation of Large Finite Element Model Using Test Data. London Imperial College, London, 1998, p. 73-80.
-
Salama M., Rose T., Garba J. Optimal Placement if exciters and sensors for verification of large dynamical systems. Proceedings of SDM conference, 1987, p. 1024-1031.
-
Mckee S., Tomé M. F., Ferreira V. G., et al. The MAC method. Computers and Fluids, Vol. 37, Issue 8, 2008, p. 907-930.
-
Li D. S., Li H. N., Fritzen C. P. The connection between effective independence and modal kinetic energy methods for sensor placement. Journal of Sound and Vibration, Vol. 305, Issues 4-5, 2007, p. 945-955.
-
Teh Y. W., Newman D., Welling M. A collapsed variational Bayesian inference algorithm for latent Dirichlet allocation. Advances in Neural Information Processing Systems, 2007, p. 1353-1360.
-
Dong Xiaoma Research on damage diagnosis and sensor optimization of intelligent structure. Ph.D. Thesis, Southeast University, Nanjing, 2006.
-
Bouhaddi N., Fillod R. A method for selecting master DOF in dynamic substructuring using the Guyan condensation method. Computers and Structures, Vol. 45, Issues 5-6, 1992, p. 941-946.
-
Kammer Daniel C. Sensor placement for on-orbit modal identification and correlation of large space structures. Journal of Guidance, Control and Dynamics, Vol. 14, Issue 9, 1991, p. 251-259.
-
Heo G., Wang M. L., Satpathi D. Optimal transducer placement for health monitoring of long span bridge. Sail Dynamics and Earthquake Engineering, Vol. 16, Issue 7, 1997, p. 495-502.
-
Shigenofi Kabashima, Tsuyoshi Ozaki, Nobuo Takeda Damage detection of satellite structures by optical fiber with small diameter. Proceedings of SPIE, Vol. 3985, 2000, p. 343-351.
-
Hideaki Lwaki, Hiros Yamakawa M., Akira Mita FBG-based displacement and strain sensors for health monitoring of smart structures. 5th International Conference on Motion and Vibration Control, Vol. 12, 2000, p. 4-8.
-
Avitabile P. Experimental modal analysis. Sound and Vibration, Vol. 35, Issue 1, 2001, p. 20-31.
-
Luo Q., Si D., Gong Z., et al. Dynamic simulation of a tracked vehicle based on RecurDyn. Vehicle and Power Technology, Vol. 4, 2011, p. 26-28.
-
Li Debao, Lu Qiuhai Experimental modal analysis and application. Science Press, 2001.
About this article

This work was supported by the National Natural Science Foundation of China under Grant No. 61773401. The authors are grateful to other participants of the project for their cooperation.
