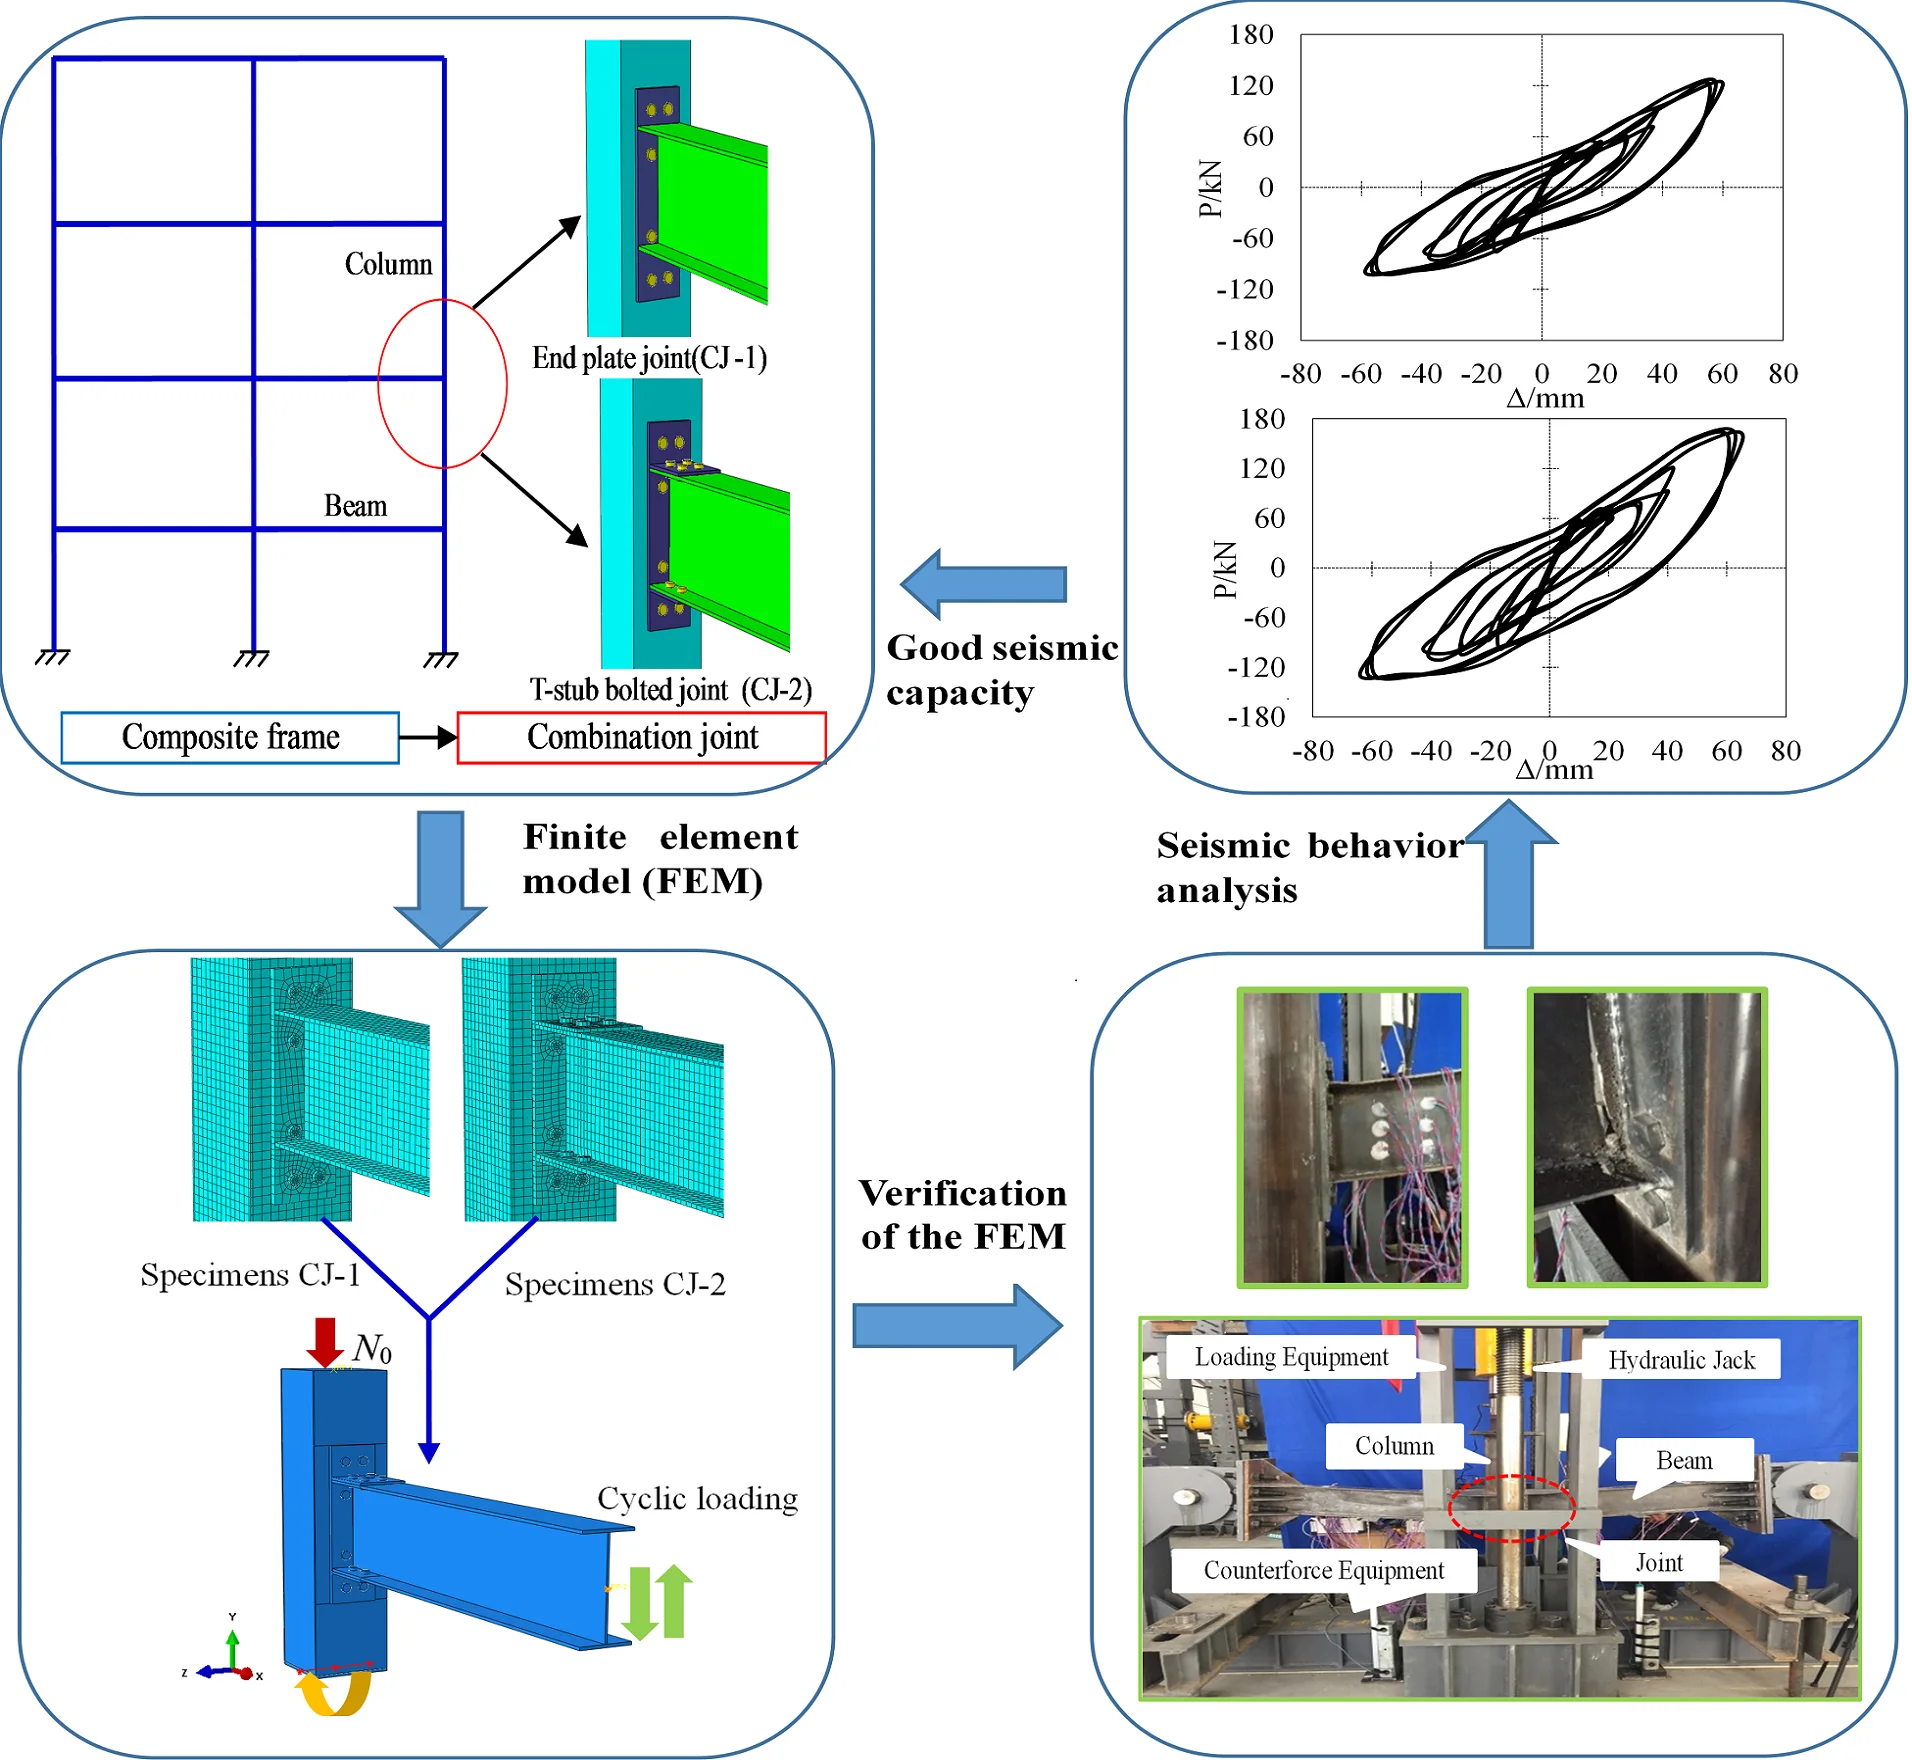
Abstract
Concrete-filled steel tubular (CFST) column to steel beam joint with the ductility and energy dissipation components is a type of connection which is used in prefabricated structures, to improve the capacity of connections and construction efficiency. In this paper, two different type of steel beam to CFST column connections with the penetrated high-strength bolts and end-plate are investigated, i.e., steel beam to CFST column connection with end plate (CJ-1), and T-stub bolted (CJ-2) connections. The finite element model (FEM) of steel beam to CFST column connection with the penetrated high-strength bolts under cyclic loading are conducted based on the whole process of the nonlinear explicit analysis method using ABAQUS. The feasibility of FEM is verified by a set of experimental results performed by our research group, as well as available test results from other researchers. The failure modes, bearing capacity, energy dissipation capacity and ductility and rigidity degeneration were studied. As a result, the load-displacement hysteretic loop curve of CJ-2 connection is plump. However, the hysteresis curve of CJ-1 shows pinching phenomenon. The value of buckling load and ultimate load of CJ-2 increased by 28 % and 30 % respectively, compared with CJ-1. With respect of stress analysis, the plastic strain accumulation position distribution is relatively uniform duo to the T-stub connection, avoiding the penetrated high-strength bolt early yield or fracture. The results show that the steel beam to CFST column connection with penetrated bolts and T-stub connection has good seismic capacity.
Highlights
- Two different types of steel beam to CFST column connections with the penetrated high-strength bolts and end-plate were investigated under cyclic loading.
- ABAQUS/Explicit display calculation method was employed to overcome the non-convergence problem in the FEM.
- The failure modes and hysteretic relations of CFST column to steel beam joints with the ductility and energy dissipation components were investigated.
- The seismic performance of this composite joint was compared with other conventional joint.
1. Introduction
Concrete-filled steel tube (CFST) has been widely used in civil engineering structures, because they have been proved to be inherently efficient in load carrying capacity, fire resistance, ductility and energy absorption capacity, and fast in construction according to the Ref. [1]. In general, steel beam to CFST column connection forms including the external diaphragms and the internal diaphragms. High strength bolts and end plates are the most common connection techniques in steel structures, such as the angle steel connections (e.g. Refs. [2, 3]), end-plate connections [4] and T-stub semi-rigid connections (e.g. Refs. [5, 6]). At present, the researches on the seismic behavior of joint connection are mainly focus on the steel structure, which involved experimental and simulation studies to assess the mechanical performance [7-11]. The different types of beam-to-column connections such as end plate and T-stub bolted connections were suggested to be used in steel frame structures, which could not only provide good seismic performance but could also be easily repaired after a heavy earthquake. However, there are a few reports on the seismic behavior of composite joint/frame with CFST column and steel beam. Han and Li. [12] investigated the seismic behaviour of the composite joint consisting of circular CFST column and steel beam with reinforced concrete (RC) slab, the joint connection form was external diaphragms. Hu et al. [8] established a nonlinear finite element model to investigate the moment-rotational behavior of steel beam-to-CFT column connections including the strength degradation. The steel beam-to-CFT column connection form was through diaphragm. Li et al. [13] studied the seismic performance of all-bolt connected and diaphragm-through joint between concrete-filled square steel tubular column and steel beam. Kim et al. [14] reported the experimental study on bending behavior and seismic performance of hybrid composite beam with new shape. Wang et al. [15-17] investigated the seismic behavior of the blind bolted end plate structures between steel beams and square or circular CFST columns subjected to lateral low-cycle loading.
From the above literature reviews, it can be concluded that, though there were some reports have been published about the different types of steel and CFST joint connection, such as external diaphragms connection, through diaphragm connection, all-bolt connected and the blind bolted end plate connection. Some issues of seismic performance of steel beam to CFST column joints need to be studied further.
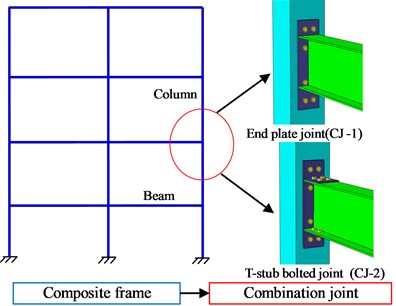
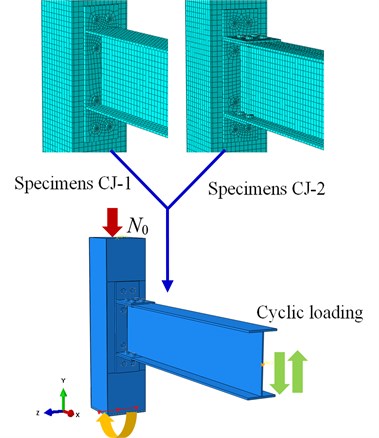
First, CFST column to steel beam joint with ductility and energy dissipation components is a type of connection which is used in prefabricated structures. There’s still limit information on the seismic performance analysis of the connection, especially with end plate and T-stub bolted connections. Thus, this paper will select two different types of connection of steel beam to CFST column connection with the penetrated high-strength bolts, including end plate (CJ-1) and T-stub bolted (CJ-2) connections, to investigate the seismic performance under cycle loading. The schematic diagram of the connections extracted from a composited frame are illustrated in Fig. 1.
Second, ABAQUS/Explicit display calculation method will be employed to overcome the non-convergence problem, such as excessive friction contact relationship and excessive material deformation. In addition, the efficiency of the operation is improved by setting the semi-automatic model quality scaling and controlling the total loading time. The analysis method can be applied to the calculation of large deformation and nonlinear structural problems.
Third, a further study on the seismic performance of difference connection joints are needed. The failure modes, bearing capacity, energy dissipation capacity and ductility and rigidity degeneration will be studied to show that the steel beam to CFST column connection with penetrated bolts and T-stub connection has good seismic capacity.
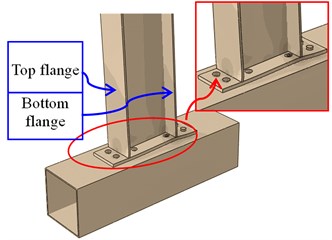
Fig. 1Composite assembly joints with CFST column and steel beam
2. FEM and material properties
2.1. Finite element model (FEM)
2.1.1. Numerical specimens
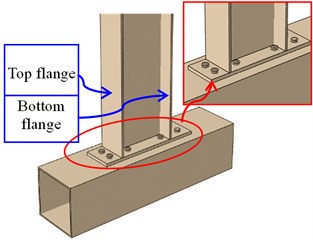
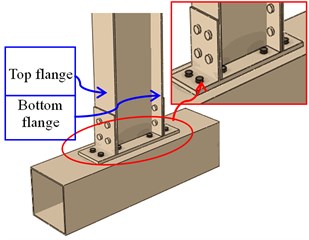
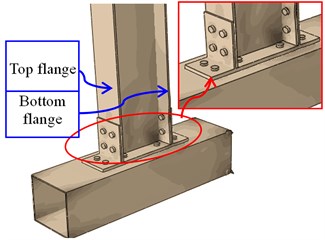
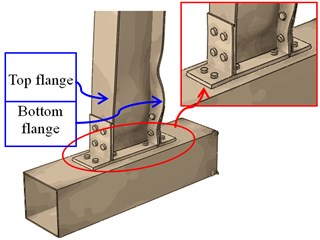
The steel beam to CFST column connection specimens with ductility and energy dissipation components are designed under the assumption that the side-span of beams and the mid-height of CFST column in a building are hinged. Detailed dimensions of square hollow section and H-shaped steel beam are listed in Table 1. The same geometric dimension of the square hollow steel tube with a cross-section of 250 mm×250 mm×6 mm and steel beam (×××= 300 mm×150 mm×6.5 mm×9 mm) are applied for all specimens in the FEM. The height of CFST column is 1000mm.and the length of steel beam is 1360 mm. the material for steel members (i.e., steel tube, steel beam and end plate) adopts all use structural steel Q345 (345 MPa). The core concrete compressive strength is 50 MPa. The high strength bolts of grade 10.9 M20 are used as connection bolts. In the connecting joint CJ-1, steel beam and end plate are welded. The end plate is connected to the steel tube through eight penetrated high-strength bolts. In the CJ-2, the connection between the steel beam flange and the T-stub end plate extension using high-strength bolts. The connection of steel tube and T-stub bolted connections using eight penetrated high-strength bolts. Fig. 2 shows the configurations of specimens.
Table 1Details of concrete filled steel tube joints
Specimens number | Square hollow section / ×× (mm) | H-shaped steel beam / ××× (mm) | Height of CFST column (mm) | Length of steel beam (mm) |
CJ-1 CJ-2 | □250×250×6 □250×250×6 | H300×150×6.5×9 H300×150×6.5×9 | 1000 1000 | 1360 1360 |
Fig. 2Dimensions of joints (unit: mm)
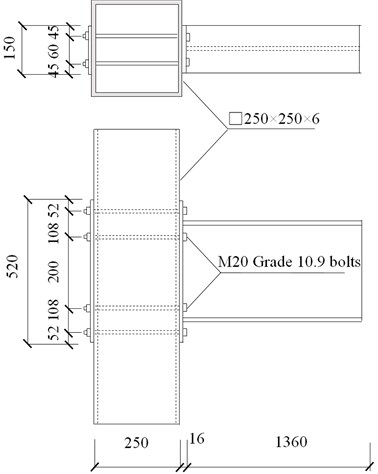
a) Specimens CJ-1
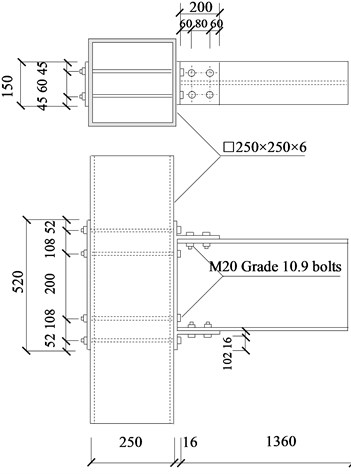
b) Specimens CJ-2
2.1.2. Element types and boundary conditions
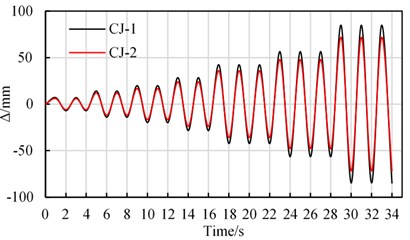
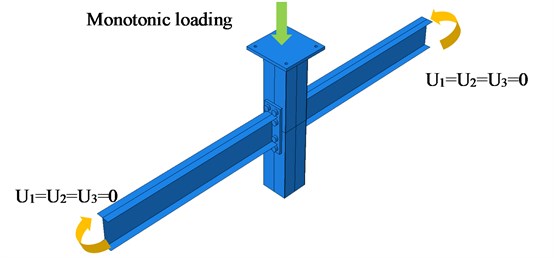
An eight-node 3-D solid element with reduced integration (C3D8R) is employed to modeling the concrete, steel tube, steel beam and high-strength bolts. The structured meshing technique is used to generate a proper element shape. There are 3,4101 elements in the FEM of specimen CJ-1, and 3,4385 elements in the CJ-2. The pre-tightening force 100 kN is applied in bolts according to the Chinese Standard for design of steel structures (GB50017-2017) [18]. The bottom of the CFST column is set on a hinged bases in the FEM. The displacements in the direction and rotations around the , axes on the middle line of the top base are all constrained. The initial constant axial load () is applied on the top of CFST column. The cyclic loads are then applied at the end of the steel beam using displacement control loading. The loading history of the vertical loads () at the end of the beam is determined based on ATC-24. [19] guidelines for cyclic loading. During the displacement control stage, the cycles loading is 0.25, 0.5, 0.7, 1.0, 1.5, 2.0, 3.0, 5.0, 7.0, 8.0…, respectively, where is the estimated yield displacement. The loads boundary and mesh of typical FEM are shown in Fig. 3(a). The displacement load history magnitude is shown in Fig. 3(b).
Fig. 3The boundary conditions and load magnitude of typical FEM
a) Boundary conditions
b) Schematic view of loading history
2.2. Material properties
2.2.1. Material model of concrete
The analysis is conducted by using ABAQUS/Explicit module (ABAQUS.2010) [20]. The concrete damaged plasticity model in ABAQUS is adopted for concrete material. The yield surface is based on the function proposed by Lubliner et al. [21]. And elaborated by Lee and Fenves [22] to account for different evolution of strength under tension and compression. This model assumes a non-associated potential flow rule and isotropic damage. The confined concrete stress-strain relationship for the core concrete of CFST in compression is used presented by Han et al. [23]. The failure criterion is the criterion of Drucker-Prager. The strain-stress relationship is given as follows:
where, , , , and are the compressive strain and stress, and are the peak compressive stress and strain, respectively.
The evolution of compressive damage variable () is adopted to represent the damage of concrete. The compressive damage variable is calculated according to the Chinese Standard for design of concrete structures (GB50010-2010) [24]:
where, , , is the uniaxial stress-strain relationship curve parameter value, respectively.
The tensile skeleton line adopts the double broken line model. The calculation formula of tensile crack stress is put forward by Han et al. [23]. The tensile crack stress is presented as follows:
where, is tensile crack stress, is the concrete compression strength.
2.2.2. Material model of steel
A nonlinear combined isotropic/kinematic model with a von Mises yield surface and an associated plastic flow rule is applied for steel members. This material model also accounts for the Bauschinger effect for steel under cyclic loading according to the Ref [25]. The stress-strain relationship curve is shown in Fig. 4.
Fig. 4The steel material constitutive model
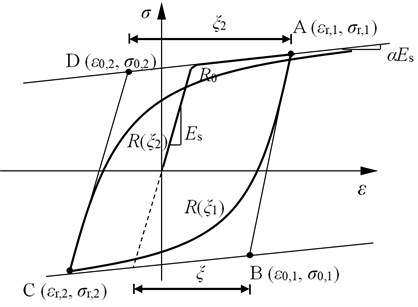
Eq. (4) expresses the formula of the steel model. The modulus of elasticity () and Poisson’s ratio () are 206,000 MPa and 0.3, respectively. The yield strength and ultimate strength of high-strength bolts are 900 MPa and 1000 MPa, respectively:
where, and are the stresses and strains at the intersection of two asymptotes (B or D), respectively; and are the stresses and strains at the strain reversal point (A or C), respectively; is a curve transition parameter; is an initial transition parameter between the elastic segment and the plastic segment; is the yield strain; is the largest or smallest unloading strain in history.
3. Verification of the FEM
3.1. Monotonic loading test
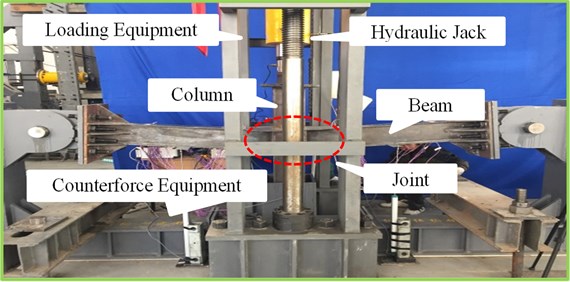
In order to study the connection reliability and failure mechanism of CFST column to steel beam joint specimen with the penetrated high-strength bolt under the large deformation, our research group conducted a monotonic loading test of CFST column to steel beam joint specimen with the penetrated high-strength bolts with square sections according to the Ref. [26]. Detailed dimensions of the H-shaped steel beam is ×××200 mm×100 mm×3.5 mm×6 mm. The section of square steel tube is 200 mm×4 mm, and the length of steel tube is 1000 mm. The span of steel beam is 3.0 m. The M10.9 high-strength friction type bolts with a diameter of 16 mm are employed to connect the steel beam and CFST column. The material level of steel material selection Q235B (194847 MPa, 324 MPa, 450 MPa), core concrete in the steel column take C50 (34557 MPa, 50.1 MPa). Displacement control loading is applied to the joint until is destroyed. The specimens of CFST column to steel beam joint specimen with the penetrated high-strength bolts are shown in Fig. 5.
Fig. 5Specimens of CFST column to steel beam joint specimens with the penetrated high-strength bolts
a) A general view of the test setup
b) The joint connection form
c) The boundary condition and load type
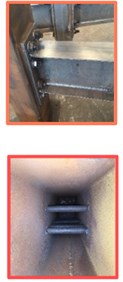
The failure modes are shown in Fig. 6. When the vertical displacement reaches about 70 mm, the steel beam presents a large deflection, and the bolts become less crowded. When the loading displacement is 110 mm, the upper flange of the left beam is subjected to compression buckling. When the vertical displacement develops to 310 mm, tiny cracks appear at the weld position between the right steel beam and bottom flange plate. When the vertical displacement increases to 320 mm, the crack spread quickly, in the right side of the beam and column completely disconnected.
Fig. 6Failure modes of specimens at monotonic loading of square section joint [26]
![Failure modes of specimens at monotonic loading of square section joint [26]](https://static-01.extrica.com/articles/20803/20803-img10.jpg)
a) The buckling of the beam flange
![Failure modes of specimens at monotonic loading of square section joint [26]](https://static-01.extrica.com/articles/20803/20803-img11.jpg)
b) The cracking of the beam web
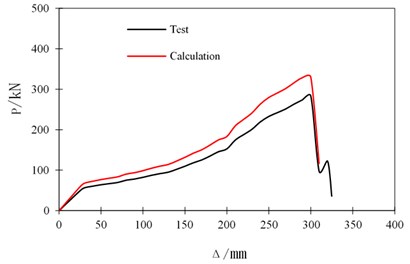
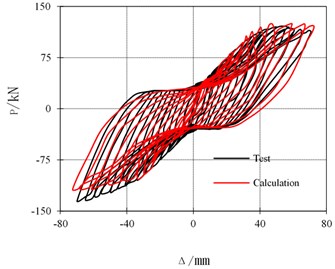
In order to verify the rationality of the modeling method of FEM in this paper, the calculated curve of the CFST joint is studied by using ABAQUS /Explicit display calculation method. The test and numerical results of load () versus displacement () curves are shown in Fig. 7. It can be seen that the vertical displacement value is less than 25 mm, test and calculated curves present a large slope and tend to a straight line. The test curve and calculated curve agree well at the beginning of loading. When the loading displacement value reaches about 300 mm, crack appears in the steel beam flange and break rapidly along the connection position between the end plate and the steel beam. The ultimate bearing capacity value of experiment is 330 kN and the calculated value is 284 kN. The relative error is 13.9 %. The calculated result is higher than the test value, especially when the vertical loading displacement value is between 200 mm-300 mm. The discrepancies between FEM and test results may be caused by deviations of initial imperfection and material properties in the test and FEM. And the influence of welding quality and high-strength bolts looseness are not taken into account in the FEM. Tie constraint condition is employed to simulate the welded connection between steel beam and end-plate in FEM. Surface to surface contact model is used in screw and screw hole surface. However, the ultimate displacement value when the joint damaged is in good agreement. When the vertical displacement value exceeds 300 mm, the test curve and the calculated curve are declining. The calculation model is terminated when the loading displacement value is 310 mm.
Fig. 7The comparison of test curve and calculated curve
3.2. Cyclic loading test
Li et al. [6] tested the seismic behavior of steel structural joints with T-stub connections. In this section, two sets of joints with specimen numbers BASE and T1 are selected to verify the feasibility of the numerical models. In the FEM, surface to surface contact model is employed in screw and screw hole surface. Tangential friction is set on the contact surface, and the friction coefficient is 0.4. The pre-tightening force 155 kN is applied in bolts. The specific dimensions are shown in Table 2.
Table 2Basic parameters of specimens
Specimens number | H-shaped steel beam / ××× (mm) | H-shaped steel column / ××× (mm) | T-shaped connections / ××× (mm) |
BASE T1 | H294×200×8×12 H294×200×8×12 | H300×300×10×15 H300×300×10×15 | T250×200×10×15 T250×200×12×19 |
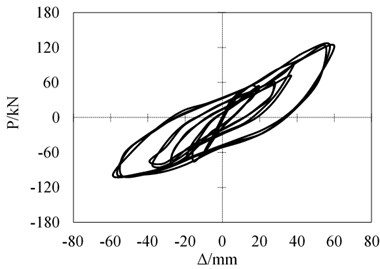
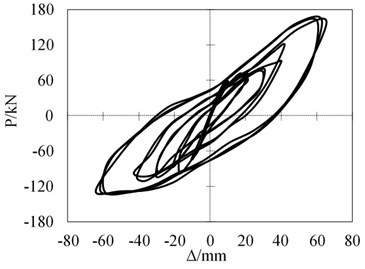
The calculation and the test results are shown in Fig. 8. The calculation result is slightly higher than the test result, because the bolts loss a certain of preload force in the tests, while preload force remains unchanged in the numerical simulation. Calculated results are basically consistent with the experimental curves, indicating that the numerical models can accurately simulate the behavior of the connections under the cyclic load.
Fig. 8Hysteretic curves comparison of test results and FEM results
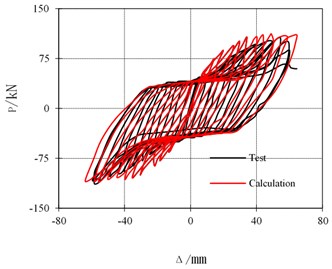
a) BASE
b) T1
4. Seismic behavior analysis
4.1. - hysteresis curves
4.1.1. Load capacity analysis
Excessive friction contact relationship and excessive material deformation are likely to cause the calculation non-convergence problems in implicit solver. In the paper, the ABAQUS/Explicit display calculation method is used to overcome the above non-convergence problem. In addition, the efficiency of the operation is improved by setting the semi-automatic model quality scaling and controlling the total loading time. The calculation results of the - hysteresis curves are shown Fig. 9, and their skeleton curves are shown in Fig. 10. The hysteresis curve of CJ-2 is plumper than that of CJ-1, indicating that the CJ-2 has better energy dissipation behavior. With the increase of loading displacement, the stiffness degradation of joint CJ-1 is more obvious than that of CJ-2. From the - skeleton curve, the peak load capacity of CJ-2 is higher than that of CJ-1.
To further clarify the bearing capacity of the two types of CFST joints under cyclic load, Table 3 presents a comparison results of yield load, ultimate load and failure load. The definition of yield load and yield displacement is determined by the tangent method proposed by Han and Li [12]. The maximum load is selected as the ultimate load , and the maximum displacement is defined as the displacement corresponding to the ultimate load . The failure load is determined as , and the failure displacement is defined as the displacement according to the . It can be seen that the yield load, ultimate load and failure load of CJ-2 are 28 %, 30 % and 30 % higher than those of CJ-1, respectively.
Fig. 9Hysteretic curves comparison of CJ-1 and CJ-2
a) CJ-1
b) CJ-2
Fig. 10Load-displacement skeleton curves
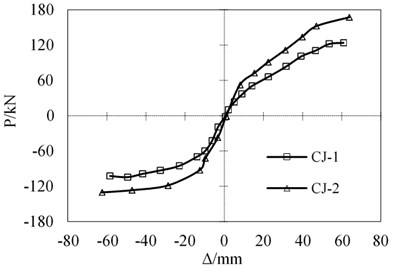
Table 3Comparison results of yield load, limit load and failure load
Specimens | The yield state | Ultimate state | Failure state | |||
(kN) | (mm) | (kN) | (mm) | (kN) | (mm) | |
CJ-1 | 75.4 | 28.3 | 123.8 | 60.8 | 105.2 | 46.4 |
CJ-2 | 97.1 | 24.0 | 161.5 | 62.8 | 137.2 | 54.8 |
4.1.2. Stiffness degradation analysis
The stiffness degradation of joints can be reflected by the loop stiffness under the same level of deformation. The annular stiffness formula is shown as follows:
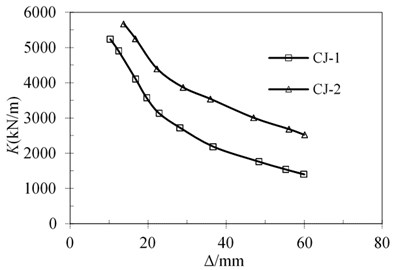
where, is the ring stiffness, is the displacement load level , the peak point load value of the -th loading cycle, is the displacement loading level , the is the peak point deformation value of the secondary loading cycle, is the number of cycles. It can be seen from Fig. 11 that the stiffness of CJ-1 is decreases by 73 % from 5230 kN/m to 1400 KN/m. While the stiffness of CJ-2 degrade from 5666 KN/m to 2522 KN/m, with a reduction of 55 %.
Fig. 11Stiffness degradation curves
4.1.3. Calculation of displacement ductility and energy dissipation coefficient
The deformation capability of joints can be expressed by the joint ductility coefficient . It is generally measured by the ratio of the structural damage ultimate displacement to the yield displacement , i.e. . It is found through calculation that the displacement ductility coefficient of CJ-1 is 1.6, while the displacement ductility coefficient of CJ-2 is 2.2. After the yield loads, the ability of CJ-2 is slightly better than that of CJ-1, and the yielding of the steel component prevents direct brittle fracture of the weld. The yield of the steel component prevents direct brittle fracture of the weld.
The equivalent viscosity coefficient and the energy dissipation coefficient are commonly used to measure the energy dissipation capacity of joints. According to JGJ101-96 [27], the energy dissipation coefficient of the component should be calculated according to Eq. (6). The greater the value, the stronger the energy dissipation capacity of the joints.
The expression for the equivalent viscosity coefficient is:
where, and denote the area of the upper half and the lower part of the hysteresis curve as shown in Fig. 12, respectively. and represent the triangle area respectively.
Fig. 12Hysteresis loop of load-displacement curve
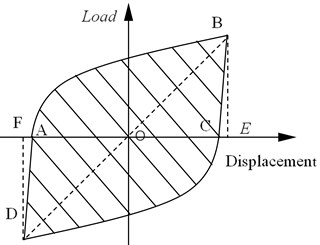
The energy dissipation coefficient refers to the ratio of the total energy of the component to elastic energy of a hysteresis loop, namely:
The energy dissipation coefficient curve of the two type joints is obtained by using Eq. (7) as shown in Fig. 13. The energy dissipation coefficient of CJ-2 is higher than that of CJ-1, with an increase of 20 % indicating that the energy dissipation capacity of CJ-2 is better. Table 4 shows the comparison of displacement ductility coefficient and energy dissipation coefficient between two types of joints.
Fig. 13Comparison of energy dissipation coefficient of connections
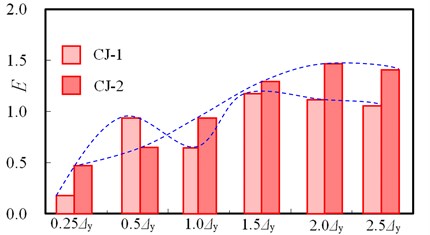
Table 4Energy dissipation index
Specimens number | Equivalent viscosity coefficient | Energy dissipation coefficient | Displacement ductility coefficient |
CJ-1 | 0.21 | 1.31 | 1.6 |
CJ-2 | 0.25 | 1.57 | 2.2 |
4.2. Mechanism and fracture analysis
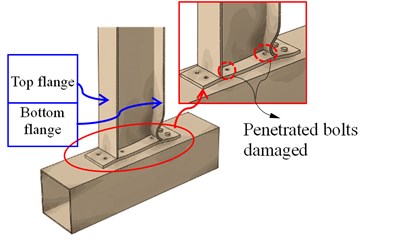
Fig. 14 shows the failure modes of the CJ-1 under the cyclic load. At the initial stage of loading, the steel beam and end-plate are well connected by eight penetrated bolts.
Fig. 14The failure modes of the joint CJ-1
a)0 mm
b)28 mm
c)60 mm
When the displacement reaches 28 mm, the stress at the bottom flange and the web plate is larger than other stress and the end plate is in tension, which leads to the deformation of the penetrated bolts. When the vertical displacement moves to 60 mm, the steel beam has a larger deformation, and the buckling failure of the bottom flange is obvious. Some of the penetrated bolts failed and cannot connect the beam and column together, which means that then joint is destroyed.
Fig. 15 shows the failure modes of CJ-2 under the cyclic load. At the initial stage of loading, the steel beam and the end-plate are well connected used eight penetrated bolts. When the loading displacement reaches 24 mm, the top and bottom flanges of the steel beam and the end-plate are yield, while the penetrated bolts are well connected. When the loading displacement reaches about 62 mm, the steel beam deforms greatly and the bottom flange obvious buckling. The high-strength bolts and the bottom flange of the steel beam cannot provide loading capacity.
It can be seen from the failure modes that CJ-1 is mainly due to failure of connected bolts, while the failure of CJ-2 is because of buckling of bottom flange of steel beam. Stress in the joint CJ-2 is more uniform than that of CJ-1. Due to the cooperative work of T-stub connection and eight penetrated bolts to make the connection of steel tube and steel beam more reliable and effective, which play a role of ductile and energy dissipation. Thus, the main structures such as steel beam and CFST column are protected from the larger local buckling deformation. Steel beam to CFST column connection with penetrated bolts and T-stub connection has good seismic capacity.
Fig. 15The failure modes of the joint CJ-2
a)10 mm
b)24 mm
c)62 mm
5. Conclusions
In this study, the seismic performance of steel beam to CFST column connection with ductility and energy dissipation components are numerically investigated and compared based on ABAQUS/Explicit display calculation method. The following conclusions can be drawn from the results of this investigation:
1) In the FEM, excessive friction contact relationship and excessive material deformation are likely to cause the calculation non-convergence problems in implicit solver. In the paper, the ABAQUS/Explicit display calculation method is used to overcome the above non-convergence problem. In addition, the efficiency of the operation is improved by setting the semi-automatic model quality scaling and controlling the total loading time. The analysis method can be applied to the calculation of large deformation and nonlinear structural problems.
2) Through the calculation of P-∆ hysteresis curves, the CJ-2 hysteresis curve is relatively full than that of CJ-1, and the CJ-1 has obvious pinch phenomenon. The yield load, the ultimate load and the damage load obtained by CJ-2 are 28 %, 30 % and 30 % higher than that of the CJ-1, respectively. T-stub connection CJ-2 has better energy dissipation capacity, which is about 20 % higher than the direct penetrated bolt connection CJ-1.
3) From the mechanism and fracture analysis, it can be seen that the failure of CJ-1 is mainly due to failure of penetrated bolts while the failure of CJ-2 is because of buckling of bottom flange of steel beam. Stress in the joint CJ-2 is more uniform than that of CJ-1. Due to the cooperative work of T-stub connection and eight penetrated bolts to make the connection of steel tube and steel beam more reliable and effective play a role of ductile and energy dissipation.
References
-
Han L. H., Wang W. D., Tao Z. Performance of circular CFST column to steel beam frames under lateral cyclic loading. Journal of Constructional Steel Research, Vol. 67, 2011, p. 876-890.
-
Yang C. M., Kim Y. M. Cyclic behavior of bolted and welded beam-to-column joints. International Journal of Mechanical Sciences, Vol. 49, Issue 5, 2011, p. 635-649.
-
Brunesi E., Nascimbene R., Rassati G. A. Response of partially-restrained bolted beam-to-column connections under cyclic loads. Journal of Constructional Steel Research, Vol. 97, 2014, p. 24-38.
-
Sofias C. E., Kalfas C. N., Pachoumis D. T. Experimental and FEM analysis of reduced beam section moment endplate connections under cyclic loading. Engineering Structures, Vol. 59, 2014, p. 320-329.
-
Iannone F., Latour M., Piluso V. Experimental analysis of bolted steel beam-to-column connections: component identification. Journal of Earthquake Engineering, Vol. 15, Issue 15, 2011, p. 214-244.
-
Li Z. L., Ding H. Y., Xue J. Experimental study on seismic performance of all-bolt connected and diaphragm-through joint between concrete-filled square steel tubular column and steel beam. China Civil Engineering Journal, Vol. 47, Issue 7, 2014, p. 63-69+78.
-
Dai X. M., Zong L., Ding Y., Li Z. X. Experimental study on seismic behavior of a novel plug-in self-lock joint for modular steel construction. Engineering Structures, Vol. 181, 2019, p. 143-164.
-
Hu J. W., Kang Y. S., Choi D. H. Seismic design, performance, and behavior of composite-moment frames with steel beam-to-concrete filled tube column connections. International Journal of Steel Structures, Vol. 10, Issue 2, 2010, p. 177-191.
-
Gerami M., Saberi H., Saberi V. Cyclic behavior of bolted connections with different arrangement of bolts. Journal of Constructional Steel Research, Vol. 67, Issue 4, 2011, p. 690-705.
-
Shokouhian M., Shi Y. Investigation of ductility in hybrid and high strength steel beams. International Journal of Steel Structures, Vol. 14, Issue 2, 2014, p. 265-280.
-
Yang S. S., Wang Y., Ma Q. Q. Experimental study on seismic behavior of prefabricated outer sleeve-overhang plate joint between column and beam. China Civil Engineering Journal, Vol. 50, Issue 11, 2017, p. 76-86.
-
Han L. H., Li W. Seismic performance of CFST column to steel beam joint with RC slab: Experiments. Journal of Constructional Steel Research, Vol. 66, 2010, p. 1374-1386.
-
Li Z. S., Li X. M., Zheng X. W. Experimental study and numerical investigation on hysteret behavior of T-stub semi-rigid beam-to-column connections. Journal of Building Structures, Vol. 35, Issue 7, 2014, p. 61-68.
-
Kim S. B., Lee E. T., Kim J. R. Experimental study on bending behavior and seismic performance of hybrid composite beam with new shape. International Journal of Steel Structures, Vol. 16, Issue 2, 2016, p. 477-488.
-
Wang J. F., Zhang N., Guo S. P. Experimental and numerical analysis of blind bolted moment joints to CFTST columns. Thin-Walled Structures, Vol. 109, 2016, p. 185-201.
-
Wang J. F., Zhang N. Performance of circular CFST column to steel beam joints with blind bolts. Journal of Constructional Steel Research, Vol. 130, 2017, p. 36-52.
-
Wang J. F., Wang H. T. Cyclic Experimental behavior of CFST column to steel beam frames with blind bolted connections. International Journal of Steel Structures, Vol. 18, Issue 3, 2018, p. 773-792.
-
GB50010-2017. Code for Design of Steel Structures. China Planning Press, Beijing.
-
ATC-24. Guidelines for Cyclic Seismic Testing of Components of Steel Structures. Redwood City (CA), Applied Technology Council.
-
Abaqus Scripting User’s Manual. Version 6.10. ABAQUS, Inc, Rhode Island, 2010.
-
Lubliner J., Oliver J., Oller S. A plastic-damage model for concrete. International Journal of Solids and Structures, Vol. 25, Issue 3, 1989, p. 299-326.
-
Lee J., Fenves G. L. Plastic-damage model for cyclic loading of concrete structures. Journal of Engineering Mechanics, Vol. 124, Issue 8, 1998, p. 892-900.
-
Han L. H., Yao G. H., Tao Z. Performance of concrete-filled thin-walled steel tubes under pure torsion. Thin-Walled Structure, Vol. 45, Issue 1, 2007, p. 24-36.
-
GB50010-2010. Code for Design of Concrete Structures. China Architecture and Building Press, Beijing, 2010.
-
Shi Y. L., Li H. W., Wang W. D. A fiber model based on secondary development of ABAQUS for elastic-plastic analysis. International Journal of Steel Structures, Vol. 18, Issue 5, 2018, p. 1560-1576.
-
Wang W. D., Zheng L., Li T. H. Experimental study and numerical simulation of thin-walled CFST column-steel beam joint with through bolts-extended endplate against progressive collapse. Journal of Building Structures, Vol. 40, Issue 11, 2019, p. 140-149.
-
JGJ101-96. Ministry of Housing and Urban-Rural Development of the People’s Republic of China. Specification of Testing Methods for Earthquake Resistant Building. China Architecture and Building Press, Beijing.
Cited by
About this article

The authors gratefully acknowledge the financial support provided by the National Natural Science Foundation of China (Grant No. 51708270 and No. 51268038), Hongliu outstanding young talents funding of Lanzhou University of Technology, and Open Foundation of International Research Base on Seismic Mitigation and Isolation of Gansu Province (Grant No. TM-QK-1801).
