Abstract
To explore the different influence of traveling wave effect on the isolated and non-isolated arch bridge, the isolated and non-isolated multi-span arch bridges models are established respectively, three measured seismic waves were selected, and under the eight kinds of apparent wave velocities and multi-point consistent excitations, the structural responses of the two models, including the internal force response, the arch rib velocity, the pier’s internal force response, the bridge deck acceleration, and the shear force and displacement of isolation support of different arch ribs position in two models, were compared and analyzed. The results show that the isolation effect of the isolation structure is obvious; the wave effect of the isolated structure is significant, the two structures show different internal force response curves in different positions of the arch ribs under the influence of different seismic waves; the influence of the apparent wave velocity on the force and shock reduction rate of the arch ribs is complex; the vertical acceleration of the arch ribs and bridge deck of the isolated structure is reduced significantly; and the shear force and displacement of the isolation bearing increase with the increase of the apparent wave velocity. The study shows the traveling wave effect of multi-span through a concrete-filled steel tubular arch bridge with and without isolation, and the results will be used for the seismic design and analysis of structural diseases caused by the wave effect.
Highlights
- Different influence of traveling wave effect on the isolated and non-isolated arch bridge was analyzed.
- Wave effect of the isolated structure is significant compared with the non-isolated.
- Influence of the apparent wave velocity on the force and shock reduction rate of the arch ribs is complex.
1. Introduction
Earthquakes occur frequently, and the seismic energy propagates from the source to the surface in the form of waves. Due to the different characteristics of topography and geological structure at different points on the ground, the time of receiving seismic waves at different points is different, that is, there is phase difference. If the geological conditions of the site where the structure is located are complex, the spatial influence of ground motion is great for long-span structures. Traveling wave effect is due to the fact that the seismic wave propagates at a certain speed, and there is time difference and phase difference when it reaches different points, which will produce traveling wave effect on long-span bridge structure. Concrete-filled steel tube (CFST) arch bridge is widely used in bridges, especially in long-span bridges, its seismic response is complex, and the impact of traveling wave effect cause the unsynchronized vibration to the structure elements which led to the lager responses, and cannot be ignored [1, 2]. Most of the previous studies devote to the static behaviors, thermal and creep effects of concrete and steel, forms of structural members, or the construction technology; few researches have been carried out on the analysis of seismic behaviors of the multi-span CFST arch bridge [3], especially on its seismic response considering traveling wave effect.
Some researchers focused on seismic response of some kinds of arch bridges, different bridge structure shows different influence degree. Xu Yan et al. [2] discussed a case study on the seismic response of a steel arch bridge under selected near fault ground motions by considering the traveling wave effect with variable apparent velocities. Liu Ai-Rong et al. [4] investigated the spatial variability effects of ground motion on the seismic response of long-span continuous rigid-frame arch bridge, in his study, the spatial variability of ground motions between pivots of the bridge was taken into account with multi-support excitation and traveling wave effect by exciting the bridge in both transverse and longitudinal directions of the bridge. Hu Zhiming et al. [5] took the traveling wave effect is into account to establish the model of the whole bridge of a concrete-filled steel tube through arch bridge with inclined arch ribs and inclined hangers, and analyzed the relevant natural vibration characteristics and seismic response. Song Bo et al. [6] researched the traveling wave effect on the seismic response of a 260 meters of half-through steel arch bridge, and advised the traveling wave effect should be considered in the aseismic design of long-span Bridges. Wang Hao et al. [7] thought due to the apparent wave velocities can be chosen in a wide range for long-span arch bridge, there had not yet been definite conclusions about the influence of traveling wave, and their research result show that the influences are closely correlated with the characteristics of the bridge structure and the seismic wave. In Ref. [8], Using the FE model of a one-span concrete-filled steel tubular arch bridge, stochastic seismic analysis of the CFST arch bridge is conducted, by considering the dimensionality, incoherence effect, wave-path effect of ground motions, and local site effects with different and irregular site conditions. Wang Ruolin et al. [9] adopted Taft and El-Centro earthquake waves to analyze the seismic response properties of a long-span steel truss-arch railway bridge in consideration of the travelling-wave effect of multiple earthquake inputs, and discussed the influence of wave velocity and earthquake property on the structural dynamic responses taking into account travelling-wave effect. In order to study, Zhang Yongliang et al. [10]took a deck-type railway steel truss arch bridge with the span of 490m as a research object, and established the dynamic calculation model of the whole bridge to analyze the law of seismic response of railway long-span steel truss arch bridges under traveling wave effect. The similar work was given by Wu Yuhua, et al. [11], Lou Menglin, et al. [12], Chen Yanjiang, et al. [13], Liu Zhen, et al. [14], Dai Gonglian, et al. [15], Tang Tang, et al. [16].
In this paper, the response difference of different apparent wave velocities between non-isolated arch bridges and isolated arch bridges under seismic action is explored, the influence of different wave velocities is compared, and the isolation effect of lead-core rubber isolation supports is discussed. It provides a reference for the seismic and isolation analysis of this kind of bridge and a theoretical reference for the extension and application of lead-core rubber isolation bearing in this kind of bridge. It provides some ideas and reference value for the construction and site selection of this kind of bridge.
2. Analysis method of traveling wave effect
Based on D’Alembert principle, the dynamic equilibrium equation of the whole system expressed by absolute displacement is established as:
where subscript is the base node; subscript is the structure node; subscript is the common node. is the displacement. The displacement of each node can be divided into relative dynamic term and quasi-static term:
Equation of motion of foundation free field:
In the simultaneous Eqs. (1) to (3), the contribution of massless spring damping force to the structure due to the rigid connection between the foundation and the structure is omitted, and Eq. (4) is not consistent in many points:
where is the foundation displacement caused by the structure movement; is the common node displacement caused by the structure movement; is the common node displacement caused by the free field movement; is the foundation displacement caused by the free field movement.
3. Bridge survey and finite element model
3.1. Overview of bridges
Taking an actual three span through arch bridge as the background, the seismic fortification intensity of the area where the bridge is located is 8 degrees (0.2 g), and the site category is class II. The main span of the bridge is 127 m, the two side spans are 87 m, the deck width is 31 m, the arch rib section is dumbbell shaped, the diameter of the middle arch rib is 1.2 m, the diameter of the side arch rib is 1.0 m, the steel pipe of the arch rib is filled with C50 concrete, and the pier is C40 reinforced concrete with a diameter of 3.5 m. The Elastic modulus of the arch rib steel tube is 2.06×10⁵ N/mm2, and the Poisson’s ratio is 0.3. The Elastic modulus of C50 concrete is 3.34×10⁴ N/mm2, and the Poisson’s ratio is 0.2. The Elastic modulus of C40 concrete is 3.25×10⁴ N/mm2, and the Poisson’s ratio is 0.2.
3.2. Finite element model
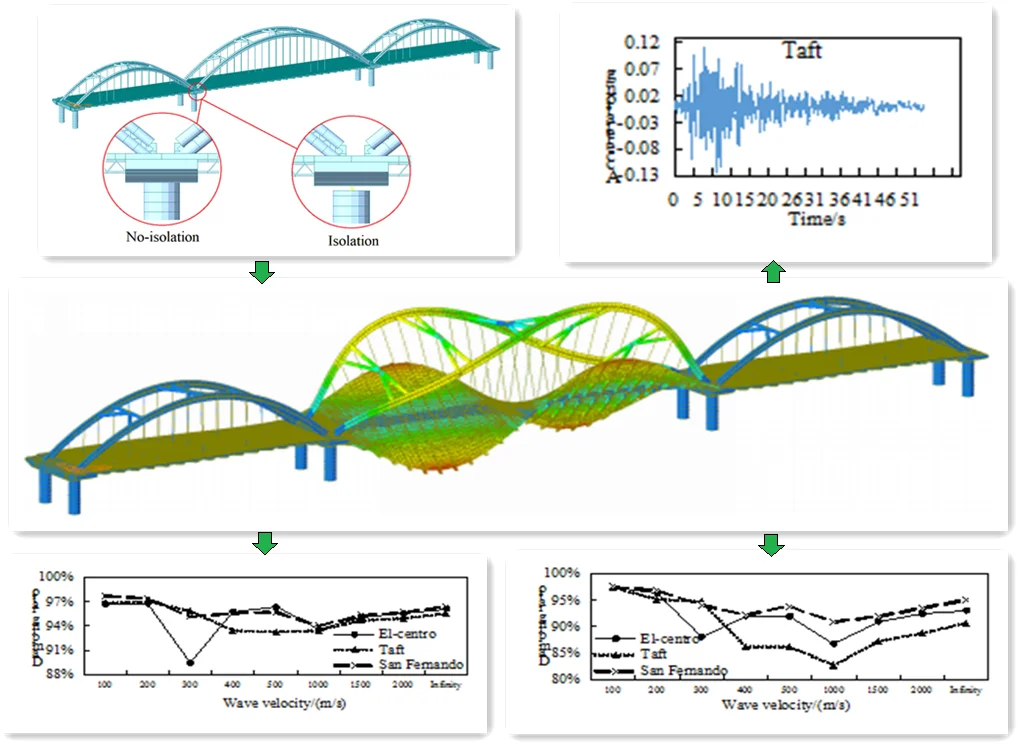
The finite element model was built based on a realistic three-span through the arch bridge, in which the arch rib, cross beam, longitudinal beam, cover beam, and bridge pier were simulated by beam element, the bridge deck was simulated by plate element, and the suspender and tie rod were simulated by tension-only link element. The bottom of the pier is set as consolidation. The bridge deck and beam are arranged as elastic connections. The piers and cover beams in the non-isolated model are connected, however, lead-core rubber isolation supports are arranged at the connection of each pier and cover beam in the isolated model, the bridge bearing parameters is shown in Table 1, and Fig. 1 shows the finite element model with a locally enlarged view of non-isolation and isolation.
Table 1Lead-core rubber support parameters
Support plane dimension (mm×mm) | Lead core yield force (kN) | Pre-yield stiffness (kN/mm) | Post-yield stiffness (kN/mm) | Horizontal equivalent stiffness (kN/mm) |
1320×1320 | 964 | 25.6 | 3.9 | 6.4 |
4. Dynamic characteristic analysis
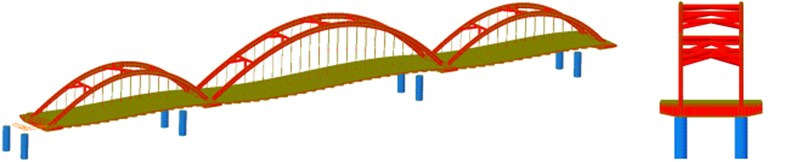
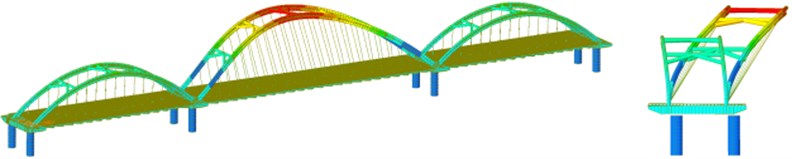
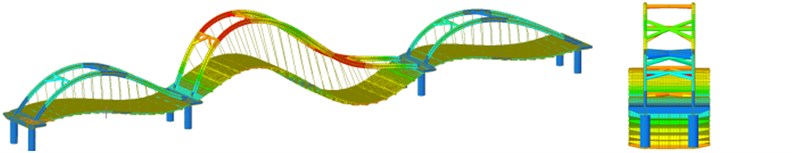
Using the function of characteristic value analysis in finite element method, the 105-order vibration type was analyzed by multiple Ritz vector method, and the results show that basic period of the non-isolated model is 3.72 s and the basic period of the isolated model is 4.55 s. The first ten order vibration type of the isolated model is shown in Fig. 2. The modeling assumes that the seismic wave propagates from left to right, and sets the time for the seismic wave to reach the left pier, the left middle pier, the right middle pier, and the right pier successively, so as to realize the traveling wave effect.
Fig. 1Finite element model with locally enlarged view of non-isolation and isolation
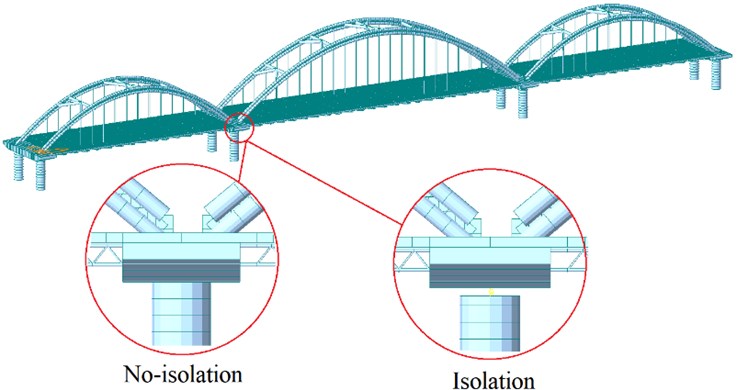
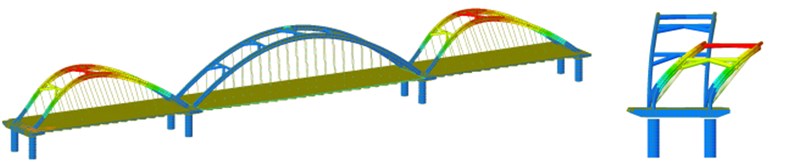
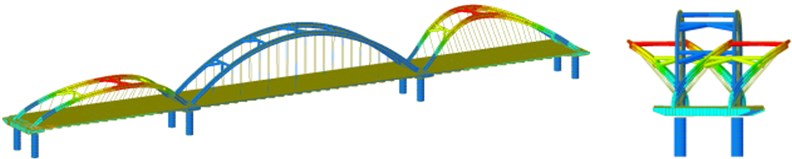
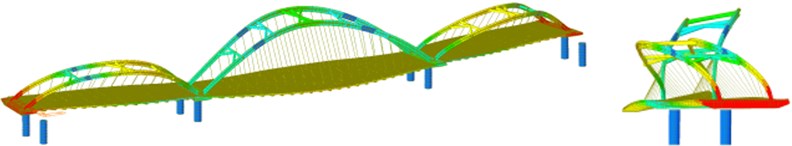
Fig. 2Mode of vibration
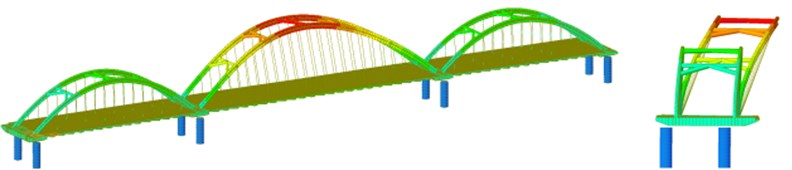
a) 1st order vibration type
b) 2nd order vibration type
c) 3rd order vibration type
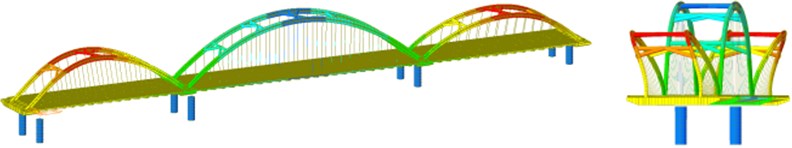
d) 4th order vibration type
e) 5th order vibration type
f) 6th order vibration type
g) 7th order vibration type
h) 8th order vibration type
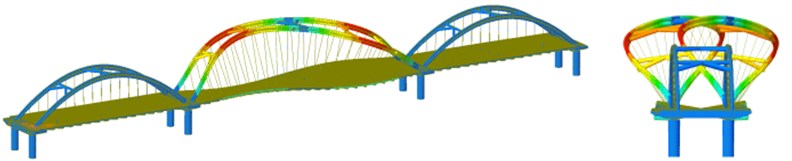
i) 9th order vibration type
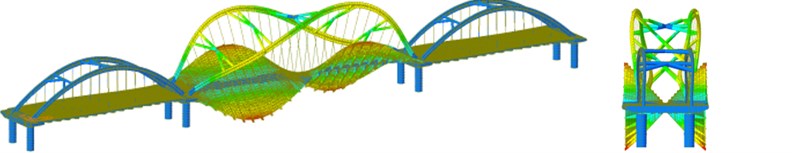
j) 10th order vibration type
5. Velocity selection of seismic and apparent wave
The seismic fortification intensity of the bridge area is 8 degrees (0.2 g), the site category is class II, Three seismic waves, El-Centro, Taft and San Fernando, were selected, in order to coordinate with the standard reaction spectrum curve and compare the traveling wave effect of three seismic waves, the seismic wave peak acceleration value was adjusted to the same value, the amplitude modulation coefficient is 0.339, 0.784 and 0.387, input three kinds of seismic waves (Fig. 3). The action time is taken as 20 s, and apparent wave velocity of ground motion is selected as 100 m/s, 200 m/s, 300 m/s, 400 m/s, 500 m/s, 1000 m/s, 1500 m/s, 2000 m/s and infinity respectively.
Fig. 3Seismic wave
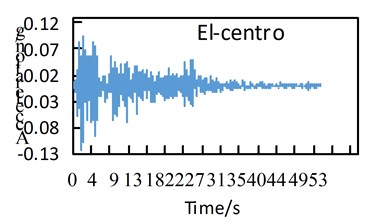
a) Adjusted El-Centro wave
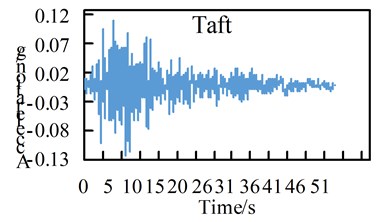
b) Adjusted Taft wave
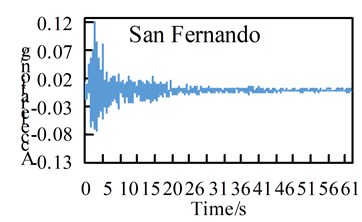
c) Adjusted San Fernando wave
6. Seismic response analysis
6.1. Internal force response of arch rib
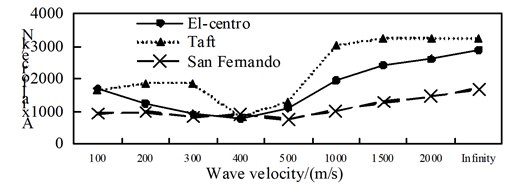
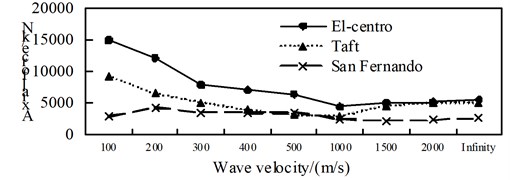
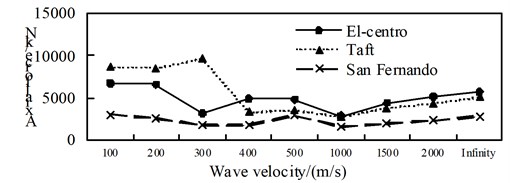
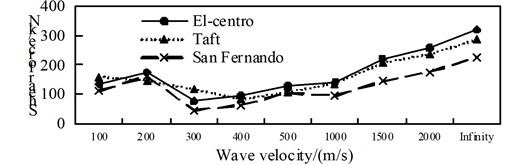
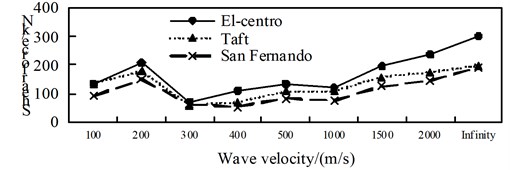
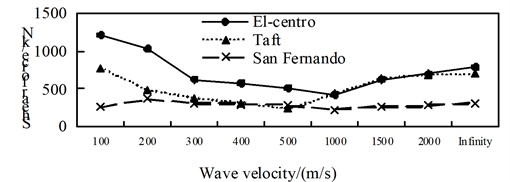
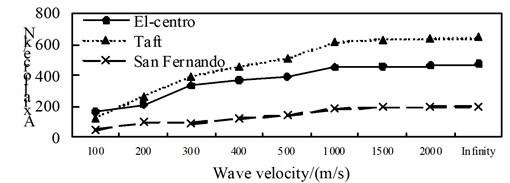
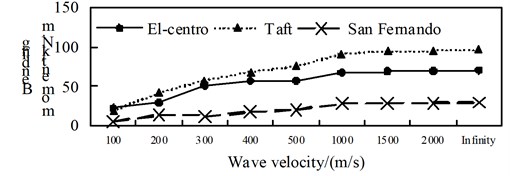
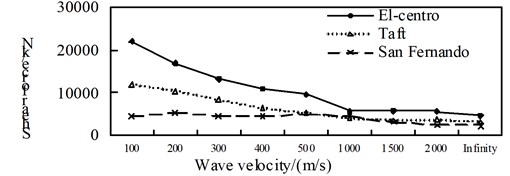
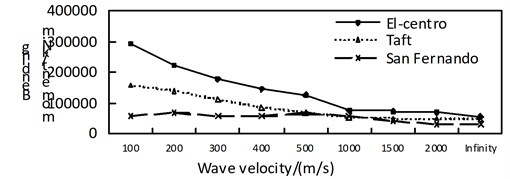
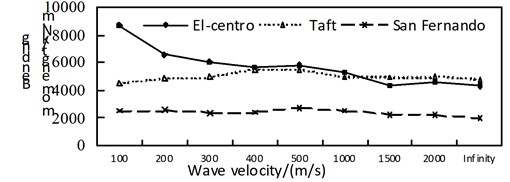
Compare the maximum internal force value of the four positions of the arch ribs and the corresponding shock absorption rate of the isolation structure, the corresponding position is shown in Table 2. The contrast of the internal forces of the non-isolated structure and the isolated structure, and the shock absorption rate of the isolation structure are shown in Fig. 4 to Fig. 12.
Table 2Analyze the arch rib corresponding to the position
Position 1 | Position 2 | Position 3 | Position 4 |
Mid-arch vault | Mid-arch 1/4 rib (Left) | Left arch foot of left arch | Left arch foot of right arch |
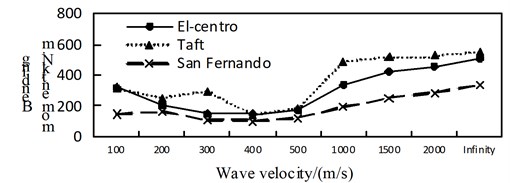
By comparing Fig. 4 to Fig. 6, it can be obtained: (1) The shaft force and bending moment of middle arch vault position in non-isolated structure decrease with the increase of the apparent wave velocity, and the shaft force increase of the medium arch vault is most obvious when the apparent wave velocity of the Taft wave is 200 m/s; (2) Shaft force and bending moment of left arch foot position of left arch of non-isolated structure, shows basically decreased trend with the increase of apparent wave velocity under the action of the Elcentro wave, the U-shaped under the action of the Taft wave, and basically consistent under the action of the San Fernando wave; (3) The influence of apparent wave velocity on the internal force of the arch ribs of non-isolated structure is complex, and different seismic waves and different internal forces show different change curves; (4) Under the effect of different apparent wave velocity of three seismic waves, the shaft force and bending moment of each arch rib position have a similar curve trend for the non-isolated structure; (5) For non-isolated structure in the arch rib position 1, position 3, position 4, when the apparent wave velocity is small, the shaft force and bending moment is much larger than the infinity excitation, even more than 10 times, if the traveling wave effect is not taken into account, the internal force response of non-isolated structures may be seriously underestimated.
Fig. 4Comparison of non-isolated axial force
a) Position 1
b) Position 2
c) Position 3
d) Position 4
Fig. 5Comparison of non-isolated shear force
a) Position 1
b) Position 2
c) Position 3
d) Position 4
Fig. 6Comparison of non-isolated bending moment
a) Position 1
b) Position 2
c) Position 3
d) Position 4
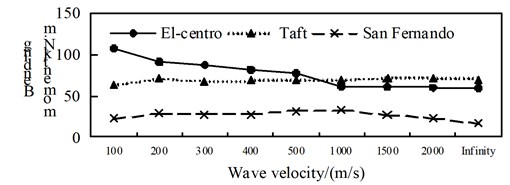
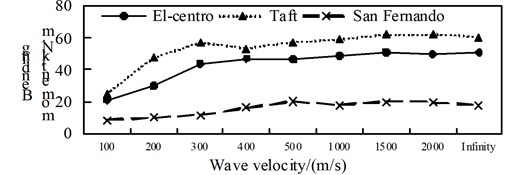
Fig. 7Comparison of isolation axial force
a) Position 1
b) Position 2
c) Position 3
d) Position 4
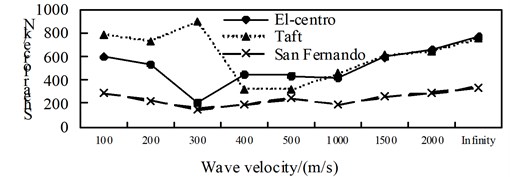
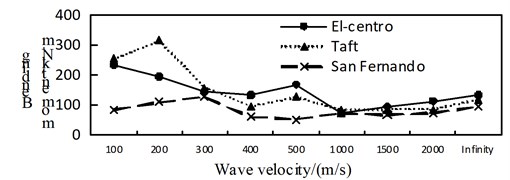
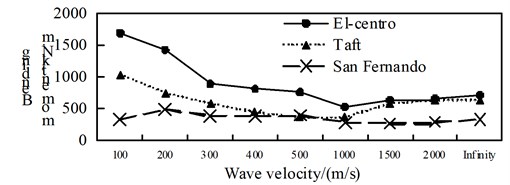
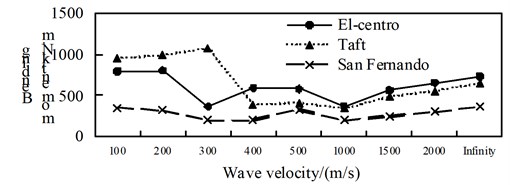
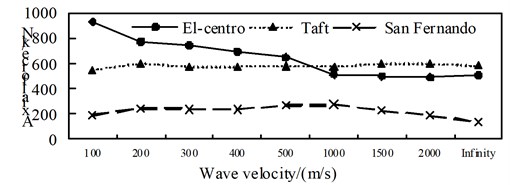
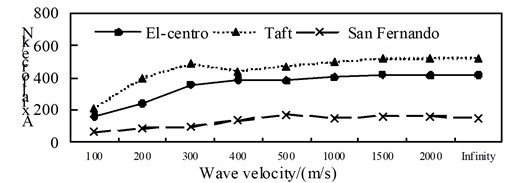
A comparison between Fig. 7 to Fig. 9, it can be obtained: (1) The shaft force and bending moment of middle arch vault position in isolated structure decrease with the increase of the apparent wave velocity, and the shaft force increase of the medium arch vault is most obvious when the apparent wave velocity of the Taft wave is 200 m/s; (2) Shaft force, shear force and bending moment of position 3 isolated structure, shows basically decreased trend with the increase of apparent wave velocity under the action of the El-Centro wave, the basically consistent under the action of the Taft wave, and the generally convex shape under the action of the San Fernando wave; (3) The axis force and the bending moment of position 2 and 4 of the isolated structure, and the shear force of position 1 increases with the growth of the apparent wave velocity; (4) Under the effect of different apparent wave velocity of three seismic waves, the shaft force and bending moment of each selected arch rib position have a similar curve trend for the isolated structure.
Fig. 8Comparison of isolation shear force
a) Position 1
b) Position 2
c) Position 3
d) Position 4
Fig. 9Comparison of isolation bending moment
a) Position 1
b) Position 2
c) Position 3
d) Position 4
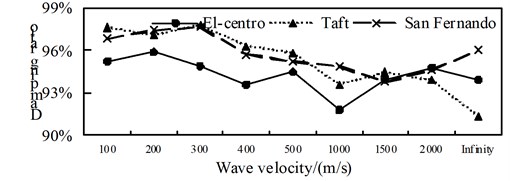
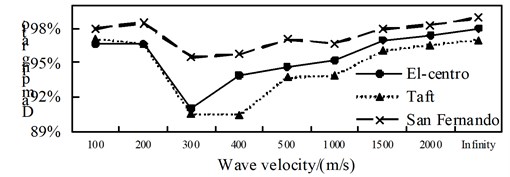
Fig. 10Comparison of axial force aseismic ratio
a) Position 1
b) Position 2
c) Position 3
d) Position 4
Fig. 11Comparison of shear force aseismic ratio
a) Position 1
b) Position 2

c) Position 3
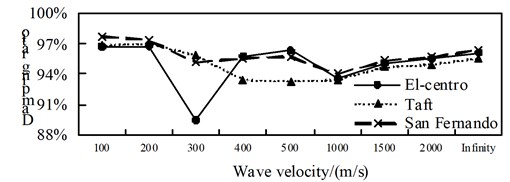
d) Position 4
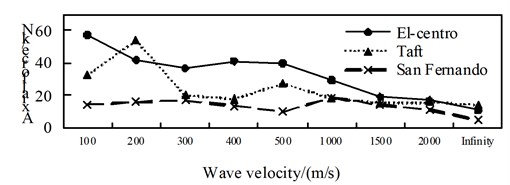
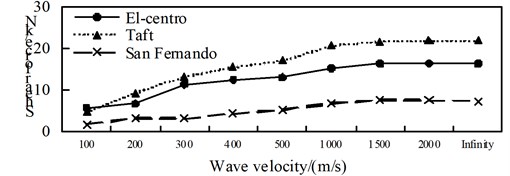
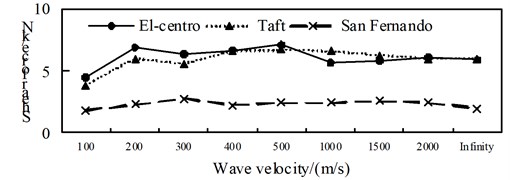
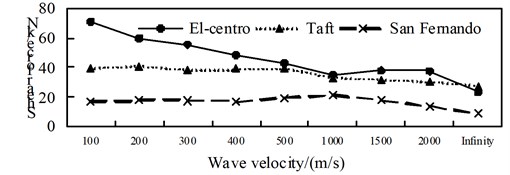
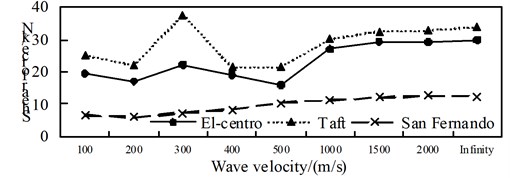
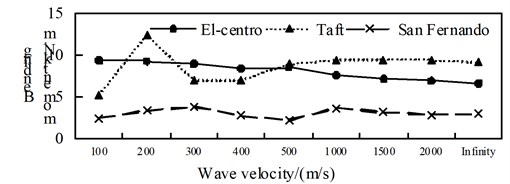
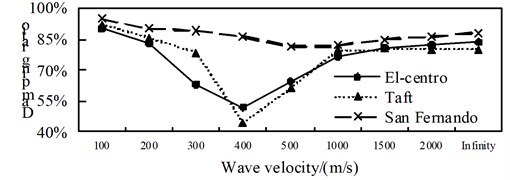
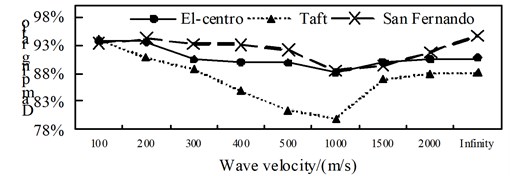
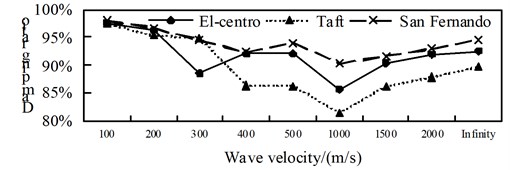
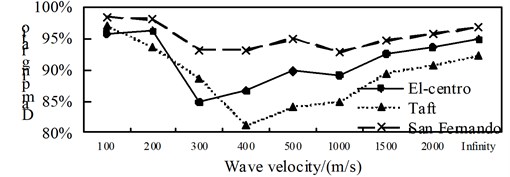
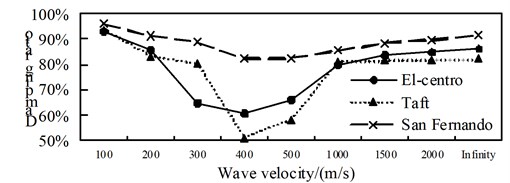
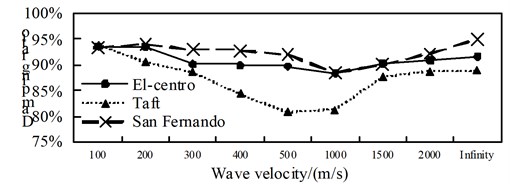
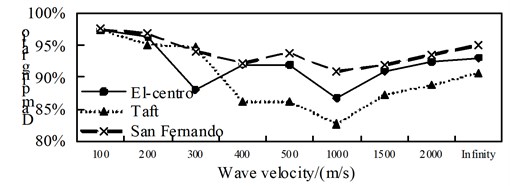
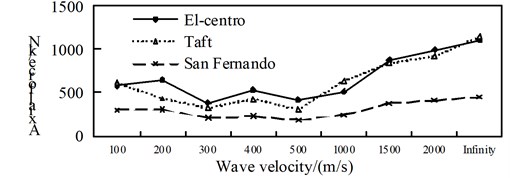
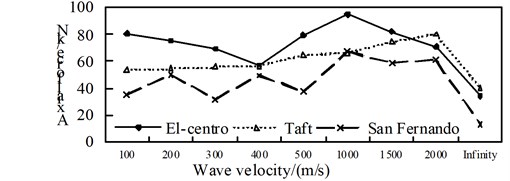
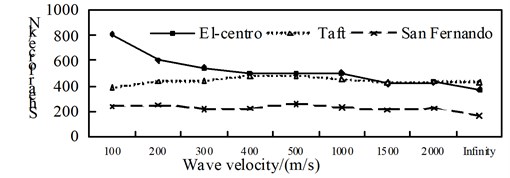
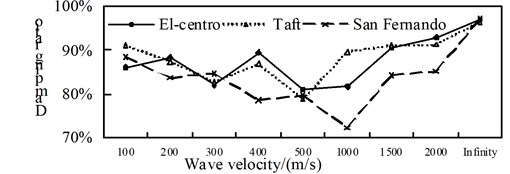
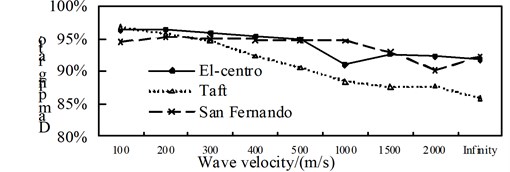
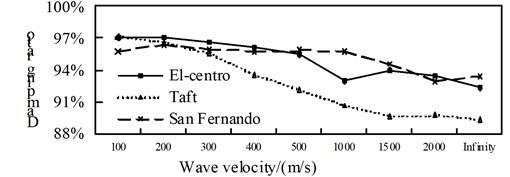
A comparison from Fig. 10 to Fig. 12, is can be obtained: (1) the isolated structure has good isolation effect, except for El-Centro wave and Taft wave in speed of about 400 m/s shock absorption rate for the shaft force and shear force is less than 79.9 % in the 1/4 arch rib (left) position of middle arch rib, the shock absorption rate for the shaft force, shear force and bending moment is more than 79.9 % in the other analysis positions under the action of three kinds of seismic waves; (2) The influence of apparent wave velocity on the shock absorption rate for internal force of the arch ribs of is complex, and different seismic waves and different internal forces show different change curves, but the vast majority of the shock absorption rate curves show basically U-shaped with the wave speed increasing from small; (3) Except for the middle arch vault position, under the action of three seismic waves with different apparent wave velocities, the shock absorption rate of the axial force and the bending moment at the other analyzed positions have a similar curve trend.
Fig. 12Comparison of bending moment aseismic ratio
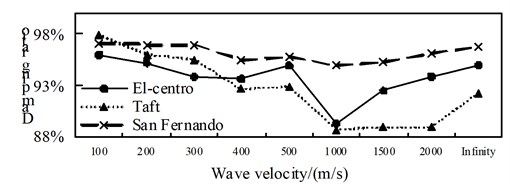
a) Position 1
b) Position 2
c) Position 3
d) Position 4
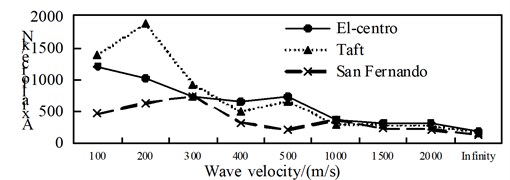
The time history diagram for axial force response of arch rib of different apparent wave velocities excitation of the El-Centro seismic wave in the non-isolated model is shown in Fig. 13, to consider the time history response effect of the traveling wave effect.
6.2. Maximum displacement of arch rib
The maximum displacement and rate of change of the middle arch ribs are shown in Table 3.
Fig. 13Axial force time-histories of arch rib in non-isolated model under the action of different apparent wave velocities excitation of El-Centro seismic waves
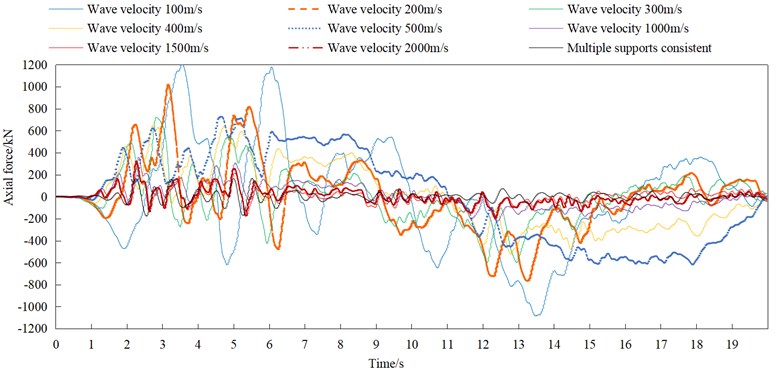
Table 3Maximum displacement (unit: mm) and rate of change in mid-arch rib
Seismic wave | Direction | Model and rate of change | Wave velocity | ||||||||
100 m/s | 200 m/s | 300 m/s | 400 m/s | 500 m/s | 1000 m/s | 1500 m/s | 2000 m/s | Infinity | |||
El-Centro | Direction | Non-isolated | 83.08 | 69.72 | 71.46 | 73.1 | 74.77 | 79.17 | 84.53 | 86.35 | 87.77 |
Isolated | 75.19 | 79.18 | 84.91 | 85.39 | 83.92 | 87.42 | 94.64 | 96.99 | 100.09 | ||
Rate of change | 9.5 % | -13.6 % | -18.8 % | -16.8 % | -12.2 % | -10.4 % | -12.0 % | -12.3 % | -14.0 % | ||
Direction | Non-isolated | 0.11 | 0.15 | 0.1 | 0.13 | 0.11 | 0.15 | 0.21 | 0.24 | 0.25 | |
Isolated | 0.03 | 0.04 | 0.04 | 0.03 | 0.03 | 0.06 | 0.06 | 0.06 | 0.06 | ||
Rate of change | 72.7 % | 73.3 % | 60.0 % | 76.9 % | 72.7 % | 60.0 % | 71.4 % | 75.0 % | 76.0 % | ||
Direction | Non-isolated | 38.2 | 30.88 | 18.96 | 20.2 | 20.23 | 23.43 | 25.22 | 26.96 | 29.16 | |
Isolated | 2.33 | 3.28 | 5.02 | 5.64 | 5.82 | 6.46 | 6.56 | 6.61 | 6.72 | ||
Rate of change | 93.9 % | 89.4 % | 73.5 % | 72.1 % | 71.2 % | 72.4 % | 74.0 % | 75.5 % | 77.0 % | ||
Taft | Direction | Non-isolated | 32.99 | 40.79 | 40.55 | 49.26 | 50.92 | 53.01 | 54.17 | 54.61 | 56.77 |
Isolated | 27.97 | 55.33 | 67.13 | 83.2 | 86.88 | 79.96 | 76.49 | 75.84 | 78.26 | ||
Rate of change | 15.2 % | -35.6 % | -65.5 % | -68.9 % | -70.6 % | -50.8 % | -41.2 % | -38.9 % | -37.9 % | ||
Direction | Non-isolated | 0.12 | 0.14 | 0.12 | 0.15 | 0.12 | 0.14 | 0.18 | 0.21 | 0.22 | |
Isolated | 0.04 | 0.02 | 0.04 | 0.03 | 0.02 | 0.05 | 0.05 | 0.05 | 0.06 | ||
Rate of change | 66.7 % | 85.7 % | 66.7 % | 80.0 % | 83.3 % | 64.3 % | 72.2 % | 76.2 % | 72.7 % | ||
Direction | Non-isolated | 34.58 | 33.8 | 36.38 | 13.18 | 18.02 | 32.48 | 34.31 | 33.79 | 33.11 | |
Isolated | 1.67 | 4.3 | 5.92 | 6.82 | 7.47 | 8.43 | 8.66 | 8.71 | 8.78 | ||
Rate of change | 95.2 % | 87.3 % | 83.7 % | 48.3 % | 58.5 % | 74.0 % | 74.8 % | 74.2 % | 73.5 % | ||
San Fernando | Direction | Non-isolated | 18.57 | 21.28 | 23.34 | 23.38 | 22.15 | 23 | 25.49 | 27.59 | 31.98 |
Isolated | 18.16 | 27.59 | 32.04 | 33.4 | 32.6 | 34.14 | 37.09 | 39.13 | 43.03 | ||
Rate of change | 2.2 % | -29.7 % | -37.3 % | -42.9 % | -47.2 % | -48.4 % | -45.5 % | -41.8 % | -34.6 % | ||
Direction | Non-isolated | 0.13 | 0.13 | 0.08 | 0.11 | 0.1 | 0.1 | 0.14 | 0.16 | 0.17 | |
Isolated | 0.03 | 0.12 | 0.02 | 0.02 | 0.02 | 0.05 | 0.04 | 0.03 | 0.02 | ||
Rate of change | 76.9 % | 7.7 % | 75.0 % | 81.8 % | 80.0 % | 50.0 % | 71.4 % | 81.3 % | 88.2 % | ||
Direction | Non-isolated | 14.53 | 16.01 | 18.35 | 16.76 | 15.11 | 12.59 | 14.49 | 15.72 | 17.64 | |
Isolated | 0.53 | 1.36 | 1.44 | 1.83 | 2.05 | 2.34 | 2.39 | 2.4 | 2.4 | ||
Rate of change | 96.4 % | 91.5 % | 92.2 % | 89.1 % | 86.4 % | 81.4 % | 83.5 % | 84.7 % | 86.4 % | ||
The mean of the three waves | Direction | Average rate of change | 8.97 % | -26.29 % | -40.55 % | -42.86 % | -43.35 % | -36.56 % | -32.89 % | -31.01 % | -28.81 % |
Direction | Average rate of change | 72.11 % | 55.58 % | 67.22 % | 79.58 % | 78.69 % | 58.10 % | 71.69 % | 77.48 % | 78.99 % | |
Direction | Average rate of change | 87.76 % | 79.53 % | 74.20 % | 61.93 % | 65.36 % | 65.46 % | 66.30 % | 49.90 % | 50.15 % | |
According to Table 3, under the multi-point excitation along the bridge considering traveling wave effect, for the arch rib displacement:
(1) It is larger in the longitudinal direction and vertical direction, but smaller in the transverse direction for the non-isolated structure; it is larger in the longitudinal direction, but smaller in the vertical direction and the transverse direction for the isolated structure.
(2) It shows increasing phenomenon in the longitudinal direction, reducing in the transverse direction, and obvious decreasing in the vertical direction.
6.3. Internal force response of the pier
Select the maximum internal force at the bottom of the left pier for comparative analysis.
Fig. 14Comparison of non-isolated internal force
a) Axial force
b) Shear force
c) Bending moment
By contrast from Fig. 14 to Fig. 16, with the increasing of the apparent wave velocity: (1) The maximum shaft force of the non-isolated bridge is roughly decreased and then increased, and the maximum shear force and bending moment are decreasing; (2) The maximum shaft force of the isolated structure bridge is fluctuating, but after considering the traveling wave effect it is greater than the consistent excitation response (infinity), the maximum shear force and the bending moment are decreasing under the action of the El-Centro seismic wave, and the change under the action of Taft wave and San Fernando wave is not obvious; (3) The maximum shaft-force aseismic ratio of the pier is roughly U-shaped, the maximum shear force is decreasing trend, the maximum bending moment is decreasing under the action of the El-Centro seismic wave, the change is not obvious under the action of the Taft wave and the San Fernando wave.
Fig. 15Comparison of isolated internal force
a) Axial force
b) Shear force
c) Bending moment
Fig. 16Comparison of internal forces and aseismic ratio in the isolation structure
a) Axial force
b) Shear force
c) Bending moment
6.4. Deck acceleration
The maximum absolute acceleration and aseismic ratio of the bridge deck are shown in Table 4.
Table 4Deck acceleration (Unit: cm/s2) and aseismic ratio
Seismic wave | Direction | Model and rate of change | Wave velocity | ||||||||
100 m/s | 200 m/s | 300 m/s | 400 m/s | 500 m/s | 1000 m/s | 1500 m/s | 2000 m/s | Infinity | |||
El-centro | Direction | Non-isolated | 175.32 | 163.96 | 148.13 | 150.17 | 161.07 | 135.85 | 264.69 | 227.03 | 281.28 |
Isolated | 120.25 | 126.52 | 124.72 | 126.66 | 122.09 | 122.71 | 128.86 | 122.32 | 122.37 | ||
Rate of change | 31.4 % | 22.8 % | 15.8 % | 15.7 % | 24.2 % | 9.7 % | 51.3 % | 46.1 % | 56.5 % | ||
Direction | Non-isolated | 12.53 | 11.93 | 11.99 | 12.13 | 12.49 | 12.54 | 12.34 | 12.6 | 12.71 | |
Isolated | 12.87 | 12.12 | 12.72 | 12.27 | 12.45 | 12.4 | 12.5 | 12.98 | 12.32 | ||
Rate of change | -2.7 % | -1.6 % | -6.1 % | -1.2 % | 0.3 % | 1.1 % | -1.3 % | -3.0 % | 3.1 % | ||
Direction | Non-isolated | 160.22 | 203.77 | 109.82 | 158.39 | 159.64 | 176.54 | 282.36 | 344.86 | 405.39 | |
Isolated | 32.85 | 25.13 | 23.35 | 25.38 | 26.28 | 37.67 | 27.99 | 32.16 | 17.01 | ||
Rate of change | 79.5 % | 87.7 % | 78.7 % | 84.0 % | 83.5 % | 78.7 % | 90.1 % | 90.7 % | 95.8 % | ||
Taft | Direction | Non-isolated | 142.24 | 128.99 | 143.5 | 146.26 | 135.89 | 129.2 | 189.09 | 177.61 | 163.33 |
Isolated | 121.62 | 128.52 | 128.85 | 130.39 | 127.67 | 129.61 | 129.77 | 130.46 | 128.19 | ||
Rate of change | 14.5 % | 0.4 % | 10.2 % | 10.9 % | 6.0 % | -0.3 % | 31.4 % | 26.5 % | 21.5 % | ||
Direction | Non-isolated | 13.18 | 13.22 | 12.82 | 13.26 | 12.58 | 12.59 | 12.76 | 12.56 | 12.7 | |
Isolated | 13.15 | 13.18 | 12.74 | 13.08 | 12.53 | 12.61 | 12.7 | 12.43 | 12.49 | ||
Rate of change | 0.2 % | 0.3 % | 0.6 % | 1.4 % | 0.4 % | -0.2 % | 0.5 % | 1.0 % | 1.7 % | ||
Direction | Non-isolated | 178 | 207.31 | 115.79 | 132.16 | 113.48 | 174.5 | 260.36 | 296.36 | 333.22 | |
Isolated | 15.13 | 14.98 | 17.46 | 17.44 | 16.47 | 19.41 | 16.37 | 14.96 | 12.3 | ||
Rate of change | 91.5 % | 92.8 % | 84.9 % | 86.8 % | 85.5 % | 88.9 % | 93.7 % | 95.0 % | 96.3 % | ||
San Fernando | Direction | Non-isolated | 114.87 | 102.68 | 136.57 | 135.55 | 105.5 | 105.36 | 181.72 | 130.09 | 143.24 |
Isolated | 118.79 | 121.51 | 121.64 | 119.97 | 121.98 | 122.52 | 121.8 | 120.97 | 119.05 | ||
Rate of change | -3.4 % | -18.3 % | 10.9 % | 11.5 % | -15.6 % | -16.3 % | 33.0 % | 7.0 % | 16.9 % | ||
Direction | Non-isolated | 7.26 | 7.49 | 7.55 | 7.37 | 7.05 | 7.15 | 7.36 | 7.31 | 7.17 | |
Isolated | 7.63 | 7.41 | 7.62 | 7.25 | 7.26 | 7.05 | 7.62 | 7.3 | 7.02 | ||
Rate of change | -5.1 % | 1.1 % | -0.9 % | 1.6 % | -3.0 % | 1.4 % | -3.5 % | 0.1 % | 2.1 % | ||
Direction | Non-isolated | 132.36 | 200.76 | 115.88 | 111.28 | 124.26 | 120.58 | 184.75 | 222.82 | 286.87 | |
Isolated | 11.62 | 14.04 | 12.45 | 12.65 | 12.37 | 17.52 | 14.33 | 14.42 | 7.31 | ||
Rate of change | 91.2 % | 93.0 % | 89.3 % | 88.6 % | 90.0 % | 85.5 % | 92.2 % | 93.5 % | 97.5 % | ||
The mean of the three waves | Direction | Average rate of change | 14.17 % | 1.62 % | 12.31 % | 12.67 % | 4.88 % | -2.31 % | 38.55 % | 26.56 % | 31.63 % |
Direction | Average rate of change | -2.53 % | -0.07 % | -2.13 % | 0.61 % | -0.75 % | 0.79 % | -1.45 % | -0.61 % | 2.27 % | |
Direction | Average rate of change | 84.50 % | 87.62 % | 82.51 % | 82.42 % | 83.88 % | 76.47 % | 82.61 % | 61.88 % | 64.04 % | |
Available from Table 4, considering the traveling wave effect along the bridge under multi-point excitation, the absolute acceleration of the bridge deck is as follows: (1) Larger in longitudinal and vertical direction, smaller in transverse direction in non-isolated structure; larger in longitudinal direction, smaller in transverse and vertical direction in isolated structure; (2) For the isolated structure, the impact of the longitudinal wave speed is more complex, about slightly increased in the transverse direction, and decreasing obvious in the vertical direction.
6.5. Shear force and displacement of isolation support
The maximum shear force and displacement of the isolation support are shown in Table 5.
Table 5Maximum shear force and displacement of isolation support
Seismic wave | Wave velocity | 100 m/s | 200 m/s | 300 m/s | 400 m/s | 500 m/s | 1000 m/s | 1500 m/s | 2000 m/s | Infinity |
El-centro | Shear force/ kN | 120.04 | 181.72 | 227.39 | 269.83 | 294.97 | 332.37 | 340.9 | 344.07 | 349.39 |
Displacement / mm | 18.76 | 28.39 | 35.53 | 42.16 | 46.09 | 51.93 | 53.27 | 53.76 | 54.59 | |
Taft | Shear force / kN | 96.73 | 234.03 | 324.83 | 355.61 | 368.08 | 406.69 | 420.27 | 425.06 | 431.71 |
Displacement / mm | 15.11 | 36.57 | 50.75 | 55.56 | 57.51 | 63.55 | 65.67 | 66.42 | 67.45 | |
San Fernando | Shear force / kN | 30.29 | 69.03 | 81.47 | 87.59 | 93.82 | 103.87 | 102.25 | 100.22 | 102.8 |
Displacement / mm | 4.73 | 10.79 | 12.73 | 13.69 | 14.66 | 16.23 | 15.98 | 15.66 | 16.06 |
It can be seen from Table 9 that the shear force and displacement of the isolation support increase with the increase of apparent wave velocity. The maximum shear force and displacement under infinity excitation are approximately 3-4 times that of the apparent wave velocity of 100 m/s.
7. Conclusions
From the comparative analysis above, it can be concluded that:
1) For this kind of structure, the isolation model has a very good isolation effect, under the action of earthquakes with different apparent wave velocities, the shock absorption rates of axial force, shear force, and bending moment of arch ribs are basically over 79.9 %;
2) The seismic structure should not ignore the effect of the wave effect, and part of the internal force will even increase by ten times if considering the wave effect;
3) The two structural models show similar curve movements with the change of the curve speed of the arch rib shaft force and bending moment;
4) The influence of apparent wave velocity on the internal force and aseismic ratio of arch ribs in isolated structure and non-isolated structure is complex, and different seismic waves show different curves;
5) The shear force and displacement of the isolation bearing increase with the increase of apparent wave velocity, and the maximum shear force and displacement under uniform excitation are approximately 3-4 times as much as the apparent wave velocity of 100 m/s.
References
-
J. Ma and Y. Li, “Analysis of traveling wave effect on half-through CFST arch bridge by large mass method,” Key Engineering Materials, Vol. 540, pp. 21–28, Jan. 2013, https://doi.org/10.4028/www.scientific.net/kem.540.21
-
Y. Xu and G. C. Lee, “Traveling wave effect on the seismic response of a steel arch bridge subjected to near fault ground motions,” Earthquake Engineering and Engineering Vibration, Vol. 6, No. 3, pp. 245–257, Sep. 2007, https://doi.org/10.1007/s11803-007-0761-z
-
Q. Wu, M. Yoshimura, K. Takahashi, S. Nakamura, and T. Nakamura, “Nonlinear seismic properties of the Second Saikai Bridge,” Engineering Structures, Vol. 28, No. 2, pp. 163–182, Jan. 2006, https://doi.org/10.1016/j.engstruct.2005.05.003
-
A.-R. Liu, Q.-C. Yu, and J.-P. Zhang, “Seismic response of long span continuous rigid-frame arch bridge,” Shenzhen Daxue Xuebao (Ligong Ban), Vol. 24, No. 3, pp. 228–233, 2007.
-
Z.-M. Hu, J.-Y. Li, and T.-Y. Huang, “Seismic response analysis of concrete-filled steel tube arch bridge based on traveling wave effect,” (in Chinese), Bridge Construction, pp. 25–28, 2010.
-
Song Bo, Yi Hanbin, and Zhou Hongyu, “Seismic response analysis for long-span arch bridges under consideration of traveling wave effect,” (in Chinese), Journal of Beijing University of Technology, Vol. 37, No. 3, pp. 375–380, 2011.
-
Wang Hao et al., “Influence analysis of seismic traveling wave for long-span CFST arch bridge,” (in Chinese), Journal of Vibration Engineering, Vol. 25, No. 5, pp. 556–563, 2012.
-
D.-Y. Zhang, X. Li, W.-M. Yan, W.-C. Xie, and M. D. Pandey, “Stochastic seismic analysis of a concrete-filled steel tubular (CFST) arch bridge under tridirectional multiple excitations,” Engineering Structures, Vol. 52, pp. 355–371, Jul. 2013, https://doi.org/10.1016/j.engstruct.2013.01.031
-
R. Wang and L. Xu, “Earthquake response analysis with travelling-wave for a long-span steel truss-arch railway bridge” Advances in Structural Engineering, Vol. 16, No. 8, pp. 1365–1370, Aug. 2013, https://doi.org/10.1260/1369-4332.16.8.1365
-
Zhang Yongliang et al., “Influence of traveling wave effect on seismic response of a long-span deck-type railway steel truss arch bridge,” (in Chinese), Zhendong yu Chongji/Journal of Vibration and Shock, Vol. 39, No. 12, pp. 213–220, 2020.
-
Wu Yuhua, Qi Xingjun, and Guo Jianfei, “Analysis of nonlinear seismic response of long-span CFST arch bridge under traveling wave effect,” Journal of Highway and Transportation Research and Development, Vol. 28, No. 1, pp. 80–85, 2011.
-
Lou Menglin and Tang Yu, “Consistent response spectrum method for horizontally travelling seismic wave response analysis of long span arch bridges,” (in Chinese), Journal of disaster prevention and mitigation engineering, Vol. 33, pp. 119–124, 2013.
-
Chen Yanjiang et al., “Stochastic seismic analysis of a CFST arch bridge under spatially varying ground motions,” (in Chinese), Gongcheng Lixue, Vol. 30, No. 12, pp. 99–106, 2013.
-
Liu Zhen, Han Xiaoyu, and Zhang Zhe, “Seismic response analysis of fly-swallow type concrete-filled steel tube arch bridge based on traveling wave effect,” (in Chinese), Journal of Sichuan University ( Engineering Science Edition), Vol. 47, No. 6, pp. 54–60, 2015.
-
Dai Gonglian and Wang Yu, “Seismic response and cushioning research of long-span railway continuous beam-arch bridge,” (in Chinese), Journal of Huazhong University of Science and Technology (Natural Science Edition), Vol. 43, No. 7, pp. 19–23, 2015.
-
Tang Tang and Qian Yongjiu, “Traveling response analysis of large-span reinforced concrete arch bridge,” (in Chinese), Earthquake Engineering and Engineering Dynamics, Vol. 36, No. 2, pp. 111–116, 2016.
About this article

This research was funded by the Fundamental Research Funds for the Central Universities (31920210078), the National Natural Science Foundation of China (51868067), the Project of Innovation Fund for Colleges and Universities in Gansu (2020B-067), the Scientific and Technological Research Project of Gansu Provincial Construction Department (JK201910) and the Special Fund for Basic Scientific Research Operation Expenses of Central University (31920170068).
