Abstract
This paper develops an optimum cell structure design method considering the in-plane tensile/compression and shear properties to improve the stiffness and strength of the honeycomb core. The equivalent elastic modulus in the or direction and shear modulus in the plane are derived using Energy Method for hexagonal, quadrilateral and concave hexagonal cells, and are compared with the results in the related literatures. The multi-objective optimization model in which the vertical wall length, wall thickness and inner angle of the cell are taken as design variables is solved by Genetic Algorithm to maximize the equivalent elastic moduli. The static and dynamic characteristics of the honeycomb cores with original and optimized cells are studied using Finite Element Method. The results show that after the cell optimization, the maximum displacement, stress and strain obviously decrease, thus improving the structural performance of the honeycomb core. The research provides significant guidance for the design of the cell structure.
Highlights
- A cell considering in-plane tensile/compression and shear properties is optimized.
- The results confirm structural performance improvements.
- The research provides significant guidance for the design of cell structure.
1. Introduction
The metallic and polymeric honeycomb cores widely used in panel structures, energy absorbers and insulation layers are formed by periodic permutation and combination of prismatic cellular microstructures [1-3]. Their tensile/compression and shear properties can be improved effectively by the cell structure optimization [4, 5]. Hence, much effort is usually spent on the optimization of geometric parameters of the cell.
Qin et al. [6] optimized the cell wall thickness and its variation gradient index using Non-dominated Sorting Genetic Algorithm (NSGA) to maximize the energy absorption ratio and minimize the collision force peak. Zhang et al. [7] optimized the cell size of a honeycomb structure by NSGA to maximize the energy absorption efficiency. Qiu et al. [8] optimized the size and key point coordinates of a hexagonal cell using Genetic Algorithm (GA) to minimize the flexibility of a chiral honeycomb panel. Wang et al. [9] optimized the relative density and size of the cell to improve the heat dissipation capacity of a composite sandwich honeycomb panel. Zhang et al. [10] optimized the cell wall thickness of an aluminum honeycomb using software Hyperstudy and LS-DYNA integrated optimization technique. Sorohan et al. [11] adopted the optimization module of ANSYS software to optimize the cell geometric parameters of a hexagonal honeycomb core with out-of-plane isotropic properties. Cinar et al. [12] optimized the thickness, diameter and inner angle of a three-dimensional cell using GA combined with a finite element solver to minimize the natural frequency difference square sum of the honeycomb panel. Gholami et al. [13] and Namvar et al. [14] optimized the cell structure parameters by Particle Swarm Optimization and GA to minimize the deflection of a honeycomb core under uniformly distributed normal load and static load, respectively.
To date, it has not been investigated that on the premise of ensuring the honeycomb core light weighting, the cell structure is optimized to improve the tensile/compression and shear moduli in in-plane. The present study firstly derives the formulas of the equivalent elastic moduli of three types of cells by Energy Method, and analyzes the calculation accuracy by comparison with the results of Refs. [15] and [16]. Then, the multi-objective optimization model is established to maximize the equivalent elastic moduli, and the size and shape of the cell are optimized using GA. Finally, the structural performance of original and optimized honeycomb cores are investigated using statics and modal analysis.
2. Equivalent elastic modulus of the cell
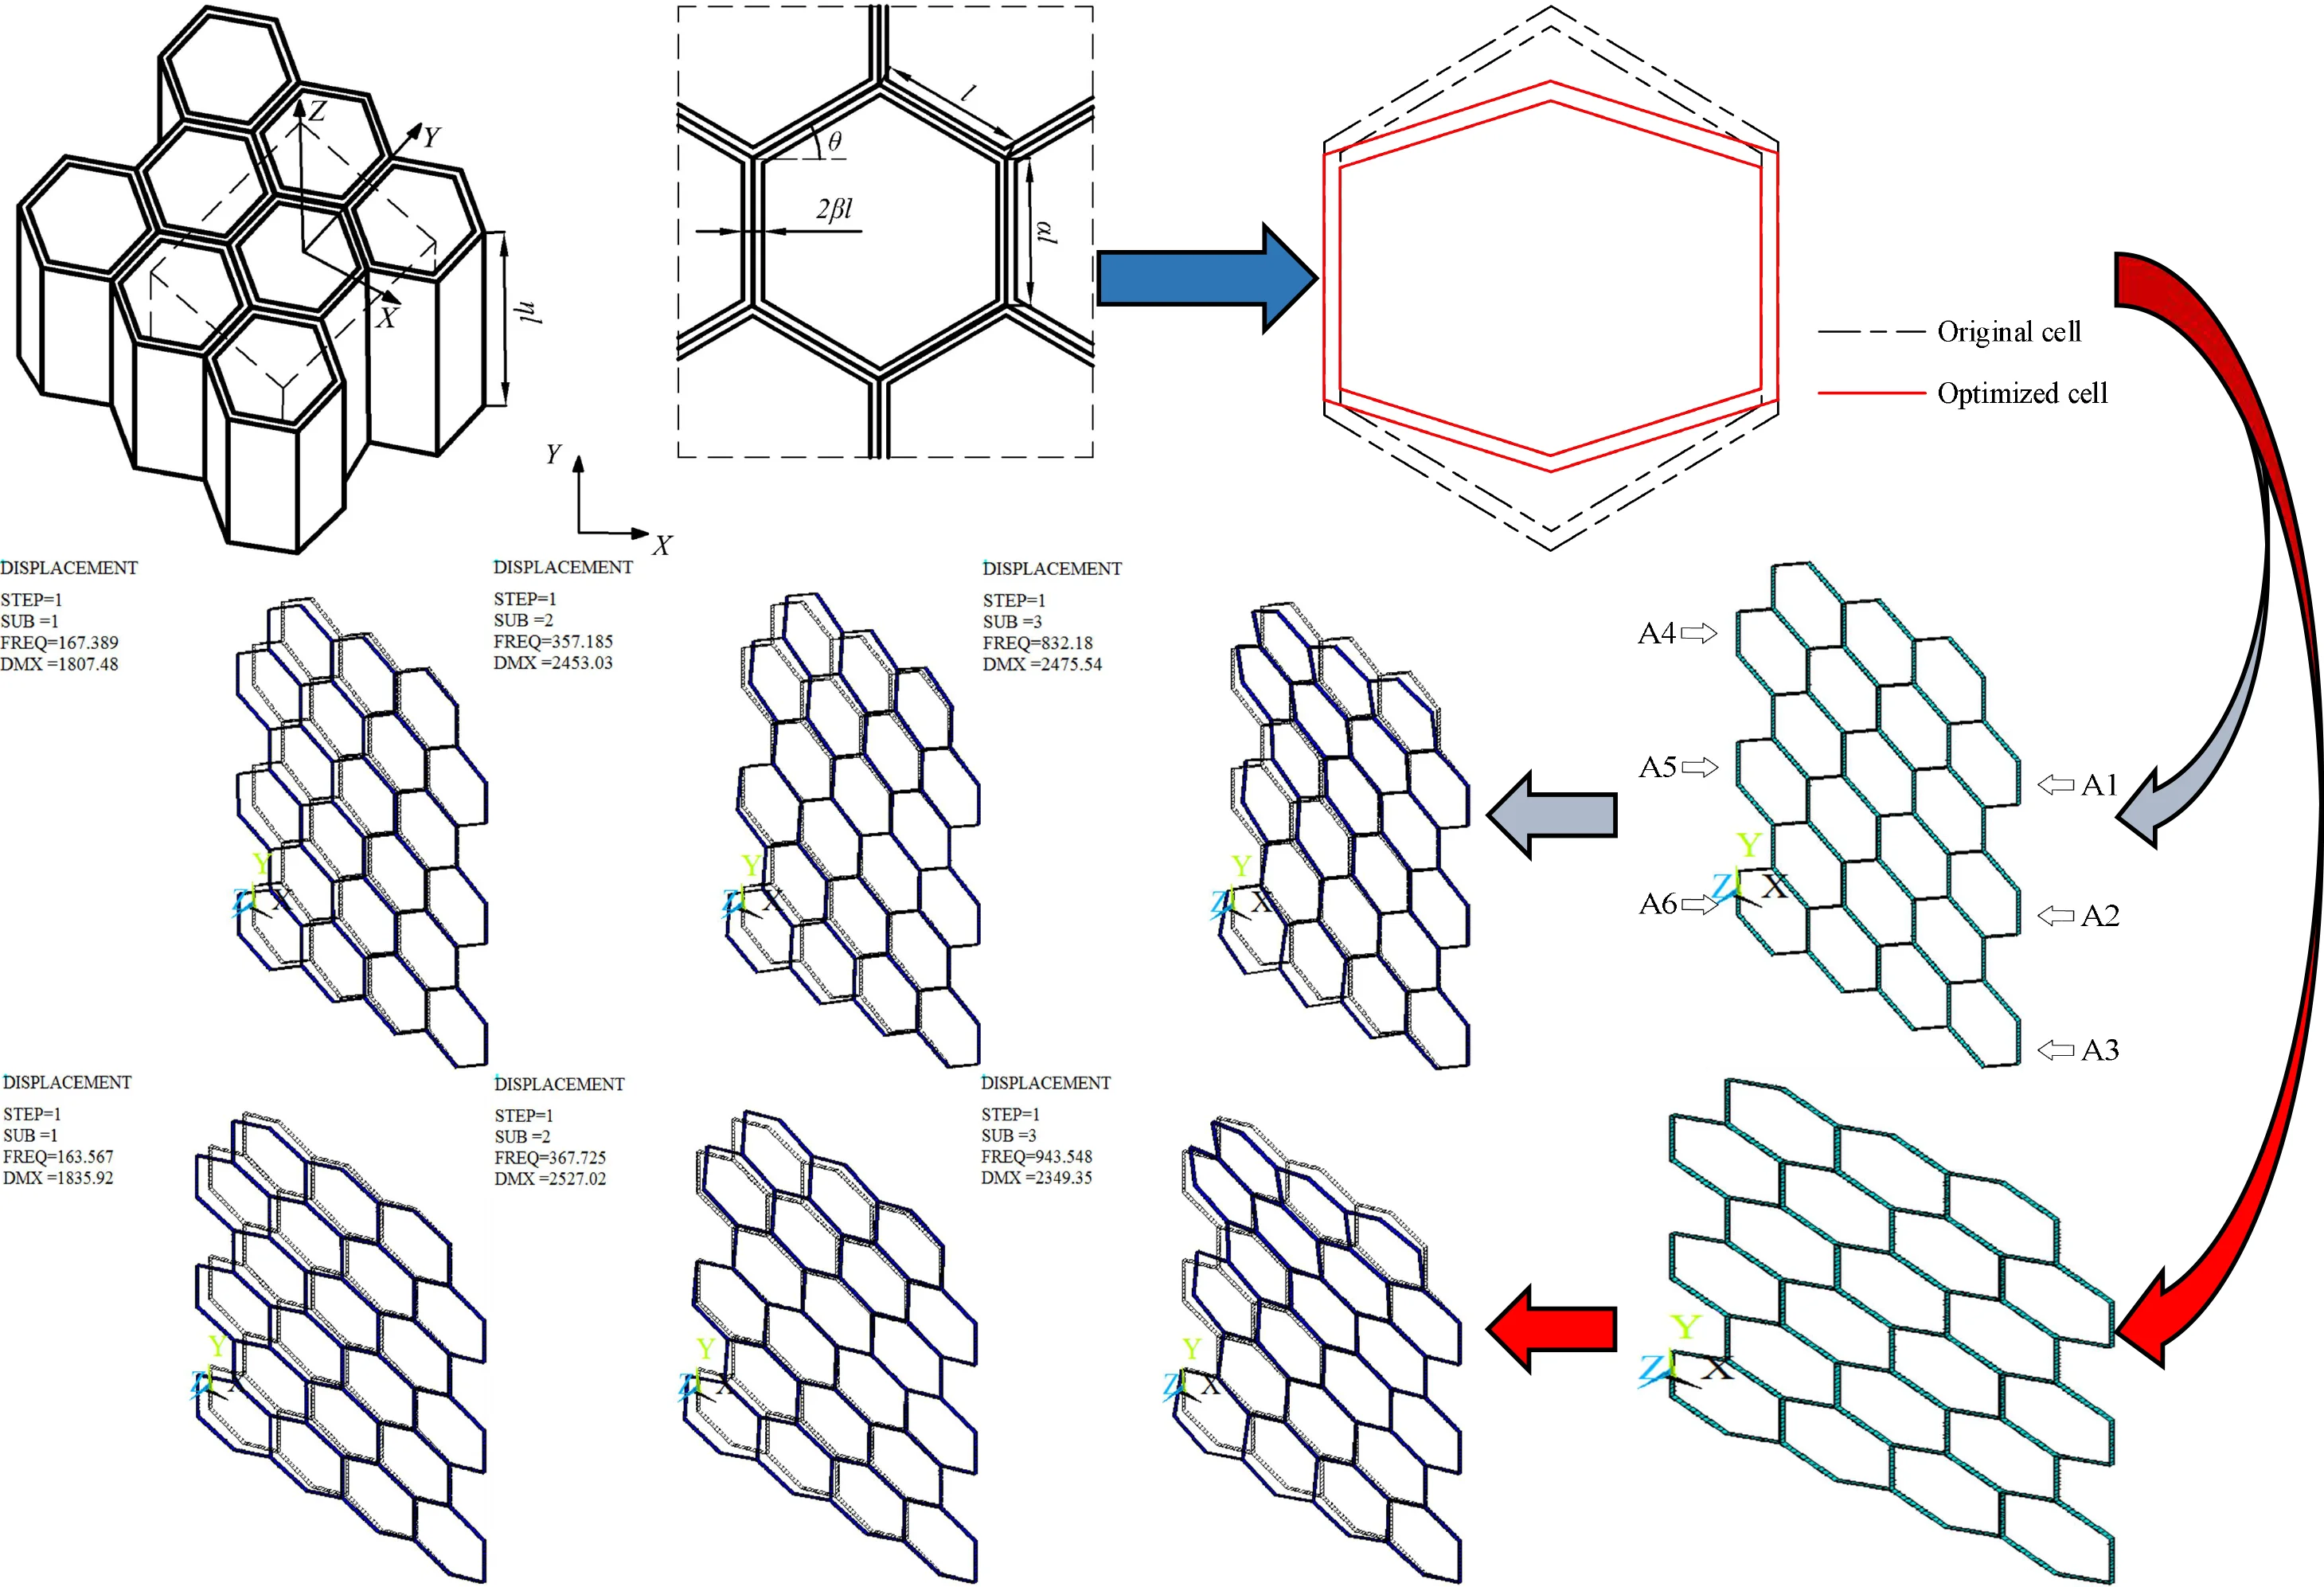
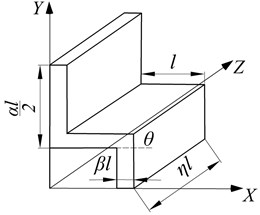
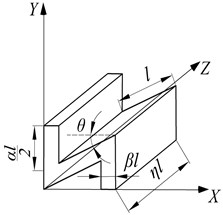
The inclined wall length , vertical wall length , wall thickness and inner angle of the basic cell, and the honeycomb core thickness are shown in Fig. 1. The non-dimensional treatment for the inclined wall length is produced, that is, , and the dimensionless quantities of the vertical wall length, wall thickness and honeycomb core thickness are , , , respectively.
According to , and , the cell is divided into three types: hexagon cell, quadrilateral cell and concave hexagon cell, and the quarter structure and size parameters are shown in Fig. 2. The tensile and compressive stress in the or direction and shear stress in the plane generate when the force acts in the honeycomb core plane. The equivalent elastic and shear moduli are derived, and the processes are the same for hexagon, quadrilateral and concave hexagon cells. The concave hexagonal cell is chosen as a testbed to illustrate the calculation of material constants.
Fig. 1Honeycomb core
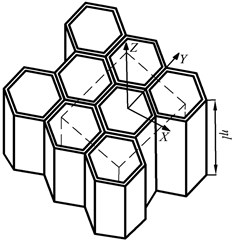
a) Honeycomb core
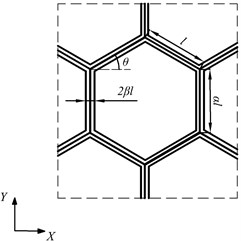
b) Basic cell
Fig. 2Quarter structure and size parameters of hexagonal, quadrilateral and concave hexagonal cells
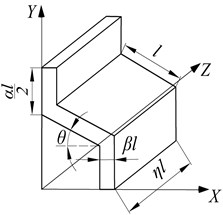
a)
b)
c)
2.1. Equivalent elastic modulus in the direction
The basic cell is subjected to a normal stress along the direction, , when the tensile deformation of the honeycomb core occurs, as shown in Fig. 3(a). The displacement of a quarter of the cell is calculated due to the symmetry, and is the same as that of the inclined wall under the combined action of stretching and bending. The vertical wall is regarded as a fixed-end constraint in view of the interaction between cells, and then the inclined wall is simplified to be a cantilever beam model, as shown in Fig. 3(b). The tensile load and bending load are expressed by:
Fig. 3Concave hexagonal cell subjected to σX and its equivalent model.
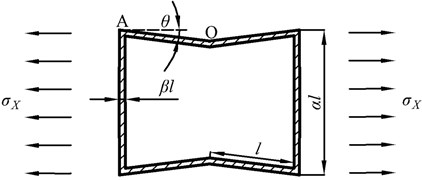
a) Concave hexagonal cell subjected to
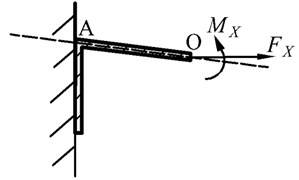
b) Equivalent cantilever beam model
The axial force and bending moment of the inclined wall OA are as follows:
The total deformation energy under the coupling action of and , , is as follows:
where and are the deformation energies produced by and , respectively; is the elastic modulus of matrix material; and are the moment of inertia and the area of the section.
The displacement of the cell along the direction, , is obtained by Castigliano’s Theorem:
The strain along the direction, , is as follows:
The equivalent elastic modulus along the direction, , is expressed according to Hooke’s Law:
For hexagonal and quadrilateral cells, the equivalent elastic modulus along the direction is written as:
2.2. Equivalent elastic modulus in the Y direction
The equivalent elastic modulus in the direction is calculated based on the cantilever beam model when the cell is subjected to a normal stress along the direction, , as shown in Fig. 4. The tensile load and bending load are expressed by:
Fig. 4Concave hexagonal cell subjected to σY and its equivalent model
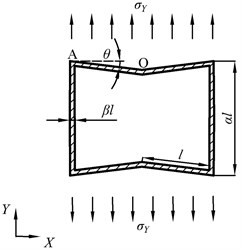
a) Concave hexagonal cell subjected to
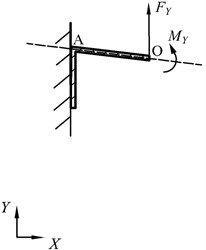
b) Equivalent cantilever beam model
The axial force and bending moment of the inclined wall OA are as follows:
The total deformation energy under the coupling action of and , , is as follows:
The displacement of the cell along the direction, , is obtained by Castigliano’s Theorem:
The strain along the direction, , is as follows:
The equivalent elastic modulus along the direction, , is expressed according to Hooke’s law:
For hexagonal and quadrilateral cells, the equivalent elastic modulus along the direction is written as:
2.3. Equivalent shear modulus in the plane
The displacement of the cell subjected to the shear stress in Fig. 5(a) is obtained by calculating that of point B. Similarly, the vertical wall is regarded as a fixed-end constraint, and the cell is simplified to a symmetric beam with antisymmetric loads, as shown in Fig. 5(b). The load on point B, , is expressed by:
The displacement caused by the shear deformation, , is obtained by Castigliano’s Theorem:
Fig. 5Concave hexagonal cell subjected to τ and its equivalent model
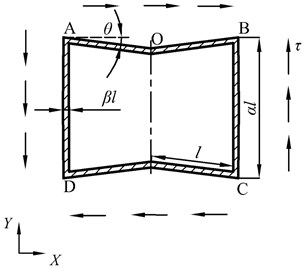
a) Concave hexagonal cell subjected to
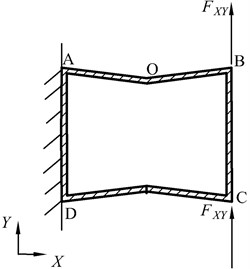
b) Equivalent symmetric beam model
The in-plane shear strain is as follows:
The equivalent shear modulus is expressed according to Hooke’s law:
For hexagonal and quadrilateral cells, the equivalent shear modulus is written as:
2.4. Validation of equivalent elastic and shear moduli
Table 2 gives the values of , and from the presented method, method of Ref. [15] and experiment of Ref. [16] for the cells with the parameters in Table 1. The calculated results from the methods of this paper and Ref. [15] are within the range of experimental values for Sample 1, while from the method of Ref. [15] is out of the range of experimental values for Sample 2. This is because Ref. 15 does not consider the tensile deformation of the cell wall. The displacement caused by the tensile deformation can be ignored due to the thinner wall of Sample 1, and need be taken into account as the wall thickness of Sample 2 is closer to the inclined wall length. Hence, the presented method has good accuracy.
Table 1Size and performance parameters of Sample cells in Ref. 16
Size and performance parameters | Sample 1 | Sample 2 |
/ mm | 6 | 2.5 |
/ mm | 6 | 2.5 |
/ mm | 0.04 | 0.03 |
/ (°) | 30 | 30 |
/ GPa | 72 | 72 |
/ (kg.m-3) | 2700 | 2700 |
0.34 | 0.34 |
Table 2Calculated and experimental values of EX*, EY* and GXY*
Analysis method | Sample 1 | Sample 2 | ||||
/ MPa | / MPa | / MPa | / MPa | / MPa | / MPa | |
Presented method | 0.045 | 0.049 | 0.005 | 0.262 | 0.283 | 0.030 |
Method of Ref. 15 | 0.049 | 0.047 | 0.012 | 0.287 | 0.216 | 0.072 |
Experiment of Ref. 16 | 0.045-0.055 | 0.043-0.053 | — | 0.260-0.300 | 0.270-0.310 | — |
3. Optimization method of cell structure
The vertical wall length, wall thickness and inner angle of the basic cell are chosen as the design variables:
where is the vector of design variables.
The elastic modulus is an important index to measure the strength and stiffness of the honeycomb core. Hence, the design objective is to maximize the equivalent elastic and shear moduli:
where , , are the weight coefficients, and .
Too thin or too thick cell wall increases the processing difficulty and results into the solid cell, respectively, and the cell will disappear if the inner angle is too great. Besides, the relative density is used to characterize the mass in design space. Hence, , , and are bounded by:
where is the relative density of the original cell.
The flow chart of the cell structure optimization is shown in Fig. 6. The multi-objective GA starts the search from a string set of solutions, generating a large number of non-inferior solutions in one optimization thus avoiding the disadvantage that the integrated algorithm is easy to fall into a local optimum. For GA parameters, the crossover probability is 0.7, the mutation probability is 0.02, and the maximum iteration number is 100. To ensure the calculation accuracy, the design variables and optimized results keep 4 decimal places using binary encoding:
where and are the upper and lower limits of design variables, respectively; is accurate to the th decimal place; is the length of the encoded gene, and is 33.
Fig. 6Flow chart of the cell structure optimization
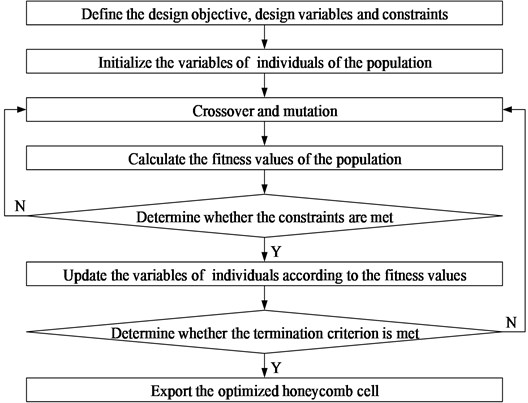
The optimizer performance is illustrated in Fig. 6(a), and the good convergence is achieved after 19 iterations. The structural parameters are shown in Table 3, and Fig. 7 gives the original and optimized cells.
Fig. 7Optimizer performance and cells
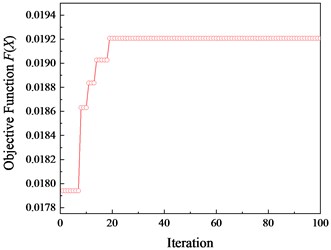
a) Optimizer performance
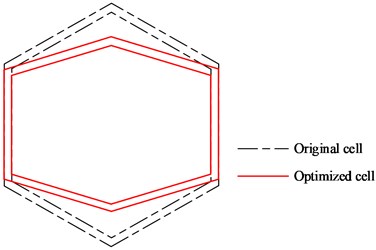
b) Original and optimized cells
Table 3Structural parameters of optimized honeycomb cell
Optimized parameters | Initial values | Optimized values |
/ mm | 6.0000 | 5.5230 |
/ mm | 0.0400 | 0.0384 |
/ ° | 30.0000 | 16.6920 |
0.0153 | 0.0133 |
4. Structure performance analysis of original and optimized honeycomb cores
The original and optimized cells are respectively tiled to form the honeycomb cores, and then the finite element models are established with APDL language in ANSYS environment and are meshed by shell93 element, as shown in Fig. 8. The statics and modal analysis are performed with an aim to study the effects of the cell optimization on the displacement, stress, strain, nature frequency and mode shape.
Fig. 8Finite element models of original and optimized honeycomb cores.
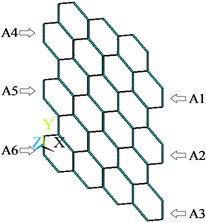
a) Before the cell optimization
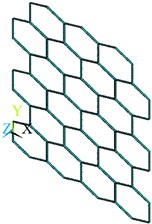
b) After the cell optimization
Fig. 9Displacement, stress and strain distributions of original and optimized honeycomb cores
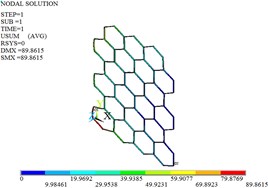
a) Displacement before the optimization
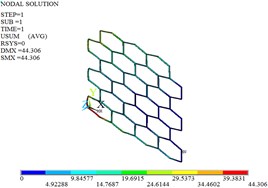
b) Displacement after the optimization
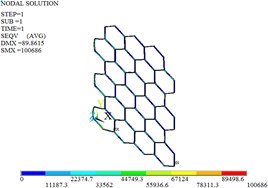
c) Stress before the optimization
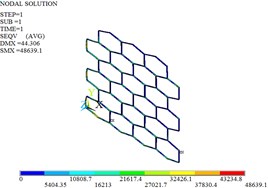
d) Stress after the optimization
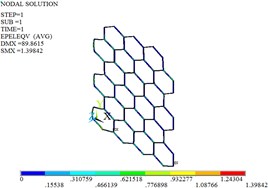
e) Strain before the optimization
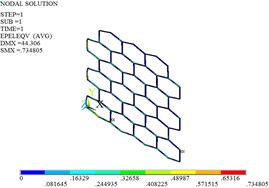
f) Strain after the optimization
4.1. Statics analysis
The planes A1, A2 and A3 are fully constrained, and the uniform load of 1000 N along the positive direction of is applied on the planes A4, A5 and A6. Fig. 9 gives the distributions of the displacement, stress and strain for original and optimized honeycomb cores. The nodal displacement is corrugated from the left to the right, and decreases. The maximum displacement occurs at the cell located in the bottom-left of the honeycomb core, and the maximum stress and strain are at the bottom-left cell connections. The maximum displacement, stress and strain decrease by 50.70 %, 51.69 % and 47.45 % after the cell optimization, respectively.
4.2. Modal analysis
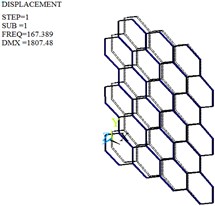
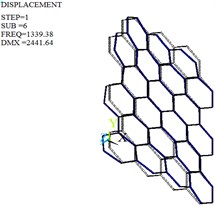
The modal analysis is carried out by Lanczos algorithm, and the frequencies and mode shapes of original and optimized honeycomb cores are obtained. Table 4, Fig. 10 and Fig. 11 give only the first six frequencies and mode shapes due to the greater influence of the lower frequencies on the stability. The first six mode shapes of optimized honeycomb are the same as those of original honeycomb. The second-, third-, fourth- and sixth- order frequencies increase by 2.95 %, 13.38 %, 24.29 % and 2.95 % after the optimization, while the first- and fifth- order frequencies decrease by 2.28 % and 8.33 %.
Table 4Frequencies and mode shapes of original and optimized honeycomb cores
Frequency order | Before the optimization | After the optimization | ||
Frequency / (Hz) | Mode shape | Frequency / (Hz) | Mode shape | |
1st | 167.39 | First-order shimmy vibration | 163.57 | First-order shimmy vibration |
2nd | 357.19 | First-order torsional vibration | 367.73 | First-order torsional vibration |
3rd | 832.18 | First-order bending vibration | 943.55 | First-order bending vibration |
4th | 1109.41 | Second-order bending vibration | 1378.84 | Second-order bending vibration |
5th | 1252.38 | Second-order shimmy vibration | 1148.04 | Second-order shimmy vibration |
6th | 1339.38 | Second-order torsional vibration | 1378.84 | Second-order torsional vibration |
Fig. 10Mode shapes of the original honeycomb core
c) First-order
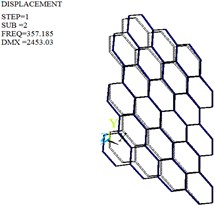
b) Second-order
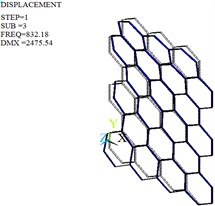
c) Third-order
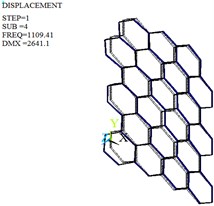
d) Fourth-order
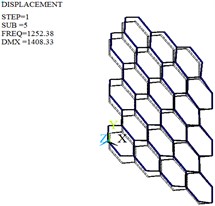
e) Fifth-order
f) Sixth-order
Fig. 11Mode shapes of the optimized honeycomb core
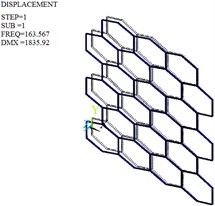
c) First-order
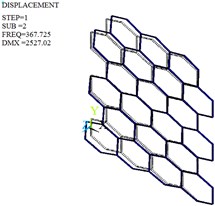
b) Second-order
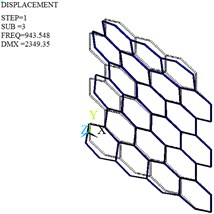
c) Third-order
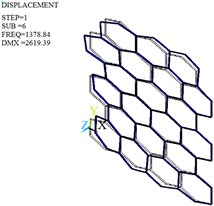
d) Fourth-order
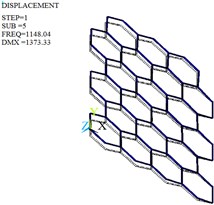
e) Fifth-order
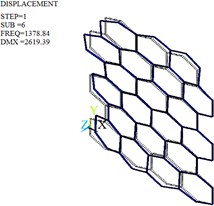
f) Sixth-order
5. Conclusions
Based on the cantilever and symmetric beam models, the equivalent elastic and shear moduli of the basic cell are derived by Energy Method, respectively. Compared with the method of Ref. [15], the accuracies of the formulas are higher since the influences of tensile and bending deformations of the cell wall are considered. The cell structure parameters are optimized with the consideration of in-plane tensile/compression and shear mechanical properties, and the displacement, stress, strain, frequency and vibration mode of original and optimized honeycomb cores are analyzed. The maximum displacement, stress and strain of the honeycomb core decrease by 50.70 %, 51.69 % and 47.45 % after the cell optimization, thus weakening the stress concentration and deformation and increasing the strength and stiffness. The natural frequencies of optimized honeycomb core mostly increase and are all beyond the excitation frequency range, indicating that the optimized structure is less prone to the resonance.
References
-
F. N. Habib, P. Iovenitti, S. H. Masood, and M. Nikzad, “Cell geometry effect on in-plane energy absorption of periodic honeycomb structures,” The International Journal of Advanced Manufacturing Technology, Vol. 94, No. 5-8, pp. 2369–2380, Feb. 2018, https://doi.org/10.1007/s00170-017-1037-z
-
E. Açıkkalp and S. Yerel Kandemir, “Optimum insulation thickness of the piping system with combined economic and environmental method,” Energy Sources, Part A: Recovery, Utilization, and Environmental Effects, Vol. 40, No. 23, pp. 2876–2885, Dec. 2018, https://doi.org/10.1080/15567036.2018.1512683
-
Y. Y. Hou and X. H. Li, “Evaluation of thermal storage performance of honeycomb insulation layer for fireproof clothing,” (in Chinese), Journal of Textile Research, Vol. 40, No. 12, pp. 109–113, 2019, https://doi.org/10.13475/j.fzxb.20181105505
-
H. Heo, J. Ju, and D.-M. Kim, “Compliant cellular structures: application to a passive morphing airfoil,” Composite Structures, Vol. 106, pp. 560–569, Dec. 2013, https://doi.org/10.1016/j.compstruct.2013.07.013
-
S. P. Sun and Y. D. Lai, “Effects of honeycomb cell size on performances of sandwich panels,” (in Chinese), Journal of Aeronautical Materials, Vol. 31, No. 2, pp. 61–66, 2011, https://doi.org/10.3969/j.issn.1005-5053.2011.2.012
-
R. Qin, J. Zhou, and B. Chen, “Crashworthiness design and multiobjective optimization for hexagon honeycomb structure with functionally graded thickness,” Advances in Materials Science and Engineering, Vol. 2019, No. 1, pp. 1–13, Feb. 2019, https://doi.org/10.1155/2019/8938696
-
S. Zhang and F. Xu, “A two-stage hybrid optimization for honeycomb-type cellular structures under out-of-plane dynamic impact,” Applied Mathematical Modelling, Vol. 80, pp. 755–770, Apr. 2020, https://doi.org/10.1016/j.apm.2019.11.052
-
K. Qiu, R. Wang, J. Zhu, and W. Zhang, “Optimization design of chiral hexagonal honeycombs with prescribed elastic properties under large deformation,” Chinese Journal of Aeronautics, Vol. 33, No. 3, pp. 902–909, Mar. 2020, https://doi.org/10.1016/j.cja.2019.09.025
-
C.-X. Yang, X.-Y. Sun, B. Liu, and H.-T. Lian, “Determination of total phosphorus in water sample by digital imaging colorimetry,” Chinese Journal of Analytical Chemistry, Vol. 35, No. 6, pp. 850–853, Jun. 2007, https://doi.org/10.1016/s1872-2040(07)60059-0
-
Z. F. Zhang, W.Jin, Z. M. Xu, Z.Chen, D. R. Shi, and Y. S. He, “Optimization of aluminum honeycomb energy-absorbing structure for pedestrian leg protection,” Automotive Engineering, Vol. 41, No. 8, pp. 927–933, 2019, https://doi.org/10.19562/j.chinasae.qcgc.2019.08.011
-
S. Sorohan, D. M. Constantinescu, M. Sandu, and A. G. Sandu, “Design of commercial hexagonal honeycombs of equal out-of-plane shear moduli,” Materials Today: Proceedings, Vol. 12, pp. 309–318, 2019, https://doi.org/10.1016/j.matpr.2019.03.129
-
O. Çınar, M. Erdal, and A. Kayran, “Accurate equivalent models of sandwich laminates with honeycomb core and composite face sheets via optimization involving modal behavior,” Journal of Sandwich Structures and Materials, Vol. 19, No. 2, pp. 139–166, Mar. 2017, https://doi.org/10.1177/1099636215613934
-
M. Gholami, R. A. Alashti, and A. Fathi, “Optimal design of a honeycomb core composite sandwich panel using evolutionary optimization algorithms,” Composite Structures, Vol. 139, pp. 254–262, Apr. 2016, https://doi.org/10.1016/j.compstruct.2015.12.019
-
A. R. Namvar and A. R. Vosoughi, “Design optimization of moderately thick hexagonal honeycomb sandwich plate with modified multi-objective particle swarm optimization by genetic algorithm (MOPSOGA),” Composite Structures, Vol. 252, p. 112626, Nov. 2020, https://doi.org/10.1016/j.compstruct.2020.112626
-
I. G. Masters and K. E. Evans, “Models for the elastic deformation of honeycombs,” Composite Structures, Vol. 35, No. 4, pp. 403–422, Aug. 1996, https://doi.org/10.1016/s0263-8223(96)00054-2
-
D. Q. Sun, W. H. Zhang, and Y. J. Sun, “Elastic moduli and material efficiency of aluminum honeycomb cores,” (in Chinese), Mechanics in Engineering, No. 1, pp. 35–40, 2008, https://doi.org/10.6052/1000-0992-2007-074
Cited by
About this article

This work was supported by the National Natural Science Foundation of China (Grant No. 51805369), Science and Technology Planning Project of Tianjin (Grant No. 20YDTPJC00820) and Natural Science Foundation of Tianjin (Grant No. 18JCYBJC89000).
