Abstract
To explore the difference in the impact of transverse bracing on the seismic effect of through concrete-filled steel tube arch bridges with non-isolated and earthquake-isolated, nine non-isolated and earthquake-isolated structural models under different cross-bracing arrangements were established, and Elcentro seismic waves were selected. The internal force, displacement, velocity, absolute acceleration, relative acceleration, and separation of arch ribs of each model were compared and analyzed under uniform excitation along the bridge, transverse and vertical directions, multi-dimensional combined excitation, and multipoint excitation considering the traveling wave effect. Based on the shear force and displacement of the earthquake support, it is concluded that the internal force response of different excitations of various models is more complicated. The installation of transverse bracing on the upper part of the arch rib can reduce the vertical displacement of the arch rib of the nonseismic structure. The “X”-shaped cross brace at the top of the arch rib and the “K”-shaped cross brace at the lower part help to reduce the transverse acceleration of the arch rib. The absolute acceleration and relative acceleration of the seismic structure arch ribs are significantly reduced.
Highlights
- Time-history response of arch foot axial force
- Time-history response of vault displacement under various conditions of non-seismic isolation
- Time-history response of vault lateral velocity in each case of seismic isolation
- Time-history response of lateral acceleration of nine vaults under working conditions
- Hysteresis curve
1. Introduction
In recent years, there have been frequent earthquakes around the world. As a lifeline project for postdisaster reconstruction and disaster relief, bridges have always received extensive attention. A large number of concrete-filled steel tube arch bridges have been built, and research on related cross-bracing arrangements is also ongoing.
Dong Rui et al. [1] studied the effectiveness of new L-shaped cross-braces in the stability of long-span concrete-filled steel tube truss arch bridges. Hejiang Third Bridge was taken as the engineering background, using a combination of numerical calculation and theoretical analysis to compare and analyze its mechanical performance and stability, and use orthogonal experiment and variance analysis methods to evaluate the significance of L-shaped cross braces in the stability of long-span CFST truss arch bridges Zhang Sumei and Yundi [2] analyzed and compared the possible layout schemes of cross braces and X braces for a 360-meter-span half-through concrete-filled steel tube arch bridge, and proposed the rationality of X braces and cross braces accordingly. According to the principle of equal bracing area and similar material consumption of transverse bracing system, four bracing schemes were proposed and analyzed for ultimate bearing capacity respectively; Wan Peng et al. [3] designed the Guangzhou Xinguang Bridge with a main span of 428 meters in plan, the large-scale finite element software ANSYS was used to establish a three-dimensional finite element model of the full bridge, and the influence of the number and position of the transverse braces on the elastic stability and the ultimate bearing capacity of the plane was analyzed. Jin Bo et al. [4] used the finite element method to analyze the influence of transverse bracing on the overall stability of a cable-stayed concrete-filled steel tube arch bridge; Chen Baochun et al. [5] found arch and arch-girder composite bridges are the main ones; Liu Zhao et al. [6] derived the analytical calculation formula for the lateral elastic stability bearing capacity of arch bridges with transverse braces based on the energy principle, and verified the proposed finite element numerical solution through a numerical example. The correctness of the analytical formula and finally discussed the influence of structural parameters on the stability of bearing capacity; Wu Meirong et al. [7] stepped into the non-thrust half-through concrete-filled steel tube arch bridge in terms of rise-span ratio, width-span ratio, main arch rib stiffness, transverse bracing Changes in the dynamic characteristics of the bridge structure when the layout mode, suspender failure, and support layout are changed; Kong Dandan et al.[8] took a steel truss arch bridge in a certain city as the research object and showed that increasing the number of wind bracing structures can significantly improve the structure’s performance stability; but when the number of wind bracing is sufficient, the continue to increase the number of wind bracing structures, the stability of the structure cannot be greatly improved, and the setting of diagonal braces has a great influence on the overall stability, especially “K” and “X” diagonal braces have a significant impact on the structural stability; Li Xiayuan et al. [9] relying on a certain through-type steel tube concrete arch bridge, based on the original bridge wind bracing form, using the MIDAS Civil finite element analysis software to establish the “-” The calculation model for the through-type steel tube concrete arch bridge with “X”-shaped wind bracing, “K”-shaped wind bracing, “m”-shaped wind bracing, and “X”-shaped wind bracing, extracts the first 20-order natural frequency and The vibration mode types of the first 6 steps were compared and analyzed with the original bridge; Zheng Xiaoyan et al. [10] studied the stability of the tied arch bridge during the construction phase and the influence of temporary transverse bracing on the structural stability.
In this paper, nine non-isolated and earthquake-isolated structural models under different cross-bracing arrangements were established, and Elcentro seismic waves were selected. The internal force, displacement, velocity, absolute acceleration, relative acceleration, and separation of arch ribs of each model were compared and analyzed under uniform excitation along the bridge, transverse and vertical directions, multi-dimensional combined excitation, and multipoint excitation considering the traveling wave effect.
The layout position and layout of the transverse bracing have different effects on the through-type concrete-filled steel tube seismic arch bridge and the seismic isolation arch bridge. The article will conduct comparative analysis and research to provide the necessary references for the design and construction of similar arch bridges.
2. Principles of time history analysis
The vibration equation for dynamic time history analysis is:
where , , denote the mass matrix, damping matrix and stiffness matrix of the corresponding structural non-supporting position, respectively, use , , to denote the mass matrix, damping matrix and stiffness matrix of the corresponding structural support position, respectively, and use , , to denote the structural non-supporting position under earthquake action, the acceleration, velocity and absolute displacement of the support, with , , , respectively represent the acceleration, velocity and absolute displacement vector of the structural support position under the action of an earthquake. is the reaction force of the support under the action of an earthquake. Then the vibration equation can be expressed in the following form:
3. Finite element model
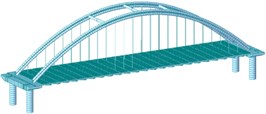
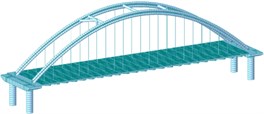
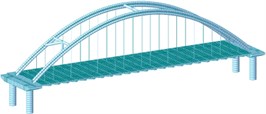
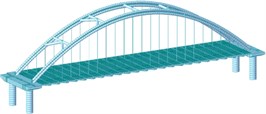
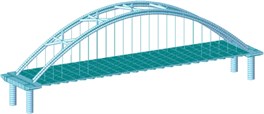
Taking an actual through arch bridge as the background, nine non-seismic and seismic finite element models of different transverse bracing arrangements are established. The transverse bracing arrangement and finite element model are shown in Table 1 and Fig. 1. The seismic isolation model is equipped with lead-core rubber seismic isolation bearings, and the bearing parameters are shown in Table 2. The bridge has a main span of 127 m and a bridge deck width of 31 m. The arch rib cross-section is dumbbell-shaped. The diameter of the upper and lower arch ribs is 1.2 m, and the diameter of the cross brace is 1.3 m.
Table 1The layout of transverse bracing in various working conditions
Working condition 1 | Working condition 2 | Working condition 3 | Working condition 4 | Working condition 5 | Working condition 6 | Working condition 7 | Working condition 8 | Working condition 9 |
A cross brace in the shape of “-” on the vault | Three “-”-shaped cross braces on the vault and the middle and upper parts | Three “-”- shaped cross braces on the vault and the middle and lower parts | Five-way "-" cross brace | One “-”- shaped cross brace on the vault, and two “K” cross braces in the middle and upper part | One “-”- shaped cross brace on the vault, two “K” cross braces in the middle and lower part | The vault has one “-”- shaped cross brace and four “K”-shaped cross braces | One “-”- shaped cross brace on the vault and four “X” cross braces | Five “X”- shaped cross braces |
Table 2Parameter table of lead rubber bearing
Support plane size (mm×mm) | Lead core yield (kN) | Rigidity before yielding (kN/mm) | Rigidity after yielding (kN/mm) | Horizontal equivalent stiffness (kN/mm) |
1320×1320 | 964 | 25.6 | 3.9 | 6.4 |
Fig. 1Finite element model diagram

a) Working condition 1
b) Working condition 2
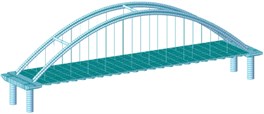
c) Working condition 3
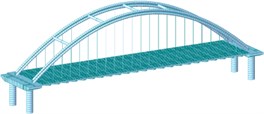
d) Working condition 4
e) Working condition 5
f) Working condition 6
g) Working condition 7

k) Working condition 8
l) Working condition 9
4. Analysis of dynamic characteristics
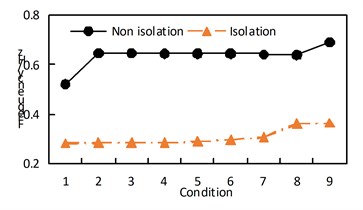
Through the finite element software analysis of the dynamic characteristics, the frequency and mode shape of the non-isolated and isolated models under nine working conditions are obtained. The first three orders are shown in Table 3, and the frequency comparison is shown in Fig. 2. It can be seen that the first-order modes of the two models under nine working conditions are all arch rib lateral inclination, and the first-order frequencies of working conditions 1, 2, 3, and 4 have little difference, while the first-order frequencies of working conditions 8 and 9 are relatively different. Large “K”-shaped cross braces and “X” cross braces can increase the fundamental frequency, and the effect of being close to the lower part of the arch rib is obvious. The “X” cross brace on the dome actually reduces the fundamental frequency. The second and third order frequencies and modes of the two models are quite different, and the influence of the cross bracing of the non-isolated model is more obvious than that of the isolated model.
Table 3The first third-order frequency and mode shape of each working condition
Working condition | Types | Frequency and mode shape | First order | Second order | Third order |
Working condition 1 | Non-isolated | Mode shape | 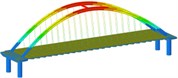 |  | 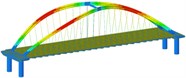 |
Frequency | 0.167 | 0.520 | 0.521 | ||
isolation | Mode shape | 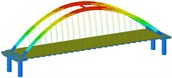 |  | 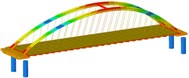 | |
Frequency | 0.160 | 0.253 | 0.283 | ||
Working condition 2 | Non-isolated | Mode shape |  | 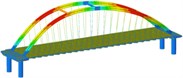 | 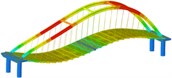 |
Frequency | 0.167 | 0.517 | 0.647 | ||
isolation | Mode shape | 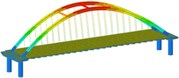 | 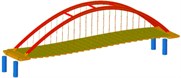 | 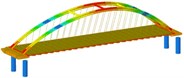 | |
Frequency | 0.160 | 0.252 | 0.284 | ||
Working condition 3 | Non-isolated | Mode shape | 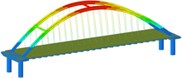 |  |  |
Frequency | 0.168 | 0.518 | 0.647 | ||
isolation | Mode shape | 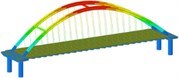 |  | 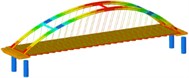 | |
Frequency | 0.161 | 0.252 | 0.284 | ||
Working condition 4 | Non-isolated | Mode shape |  |  | 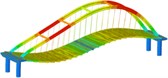 |
0.168 | 0.515 | 0.645 | |||
isolation | Mode shape | 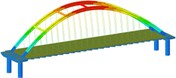 | 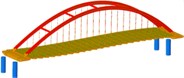 |  | |
Frequency | 0.161 | 0.252 | 0.284 | ||
Working condition 5 | Non-isolated | Mode shape | 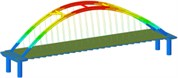 | 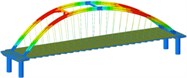 | 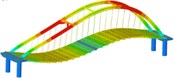 |
Frequency | 0.188 | 0.522 | 0.645 | ||
isolation | Mode shape | 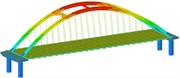 | 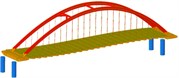 | 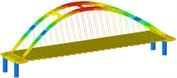 | |
Frequency | 0.177 | 0.252 | 0.290 | ||
Working condition 6 | Non-isolated | Mode shape | 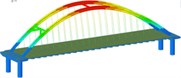 | 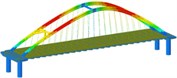 | 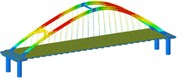 |
Frequency | 0.213 | 0.546 | 0.645 | ||
isolation | Mode shape | 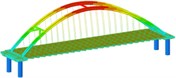 | 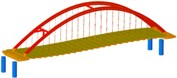 | 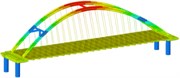 | |
Frequency | 0.195 | 0.252 | 0.297 | ||
Working condition 7 | Non-isolated | Mode shape | 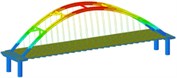 | 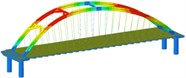 | 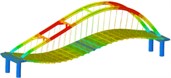 |
Frequency | 0.231 | 0.548 | 0.642 | ||
isolation | Mode shape | 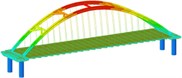 |  | 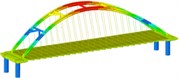 | |
Frequency | 0.205 | 0.252 | 0.306 | ||
Working condition 8 | Non-isolated | Mode shape | 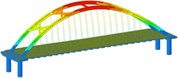 | 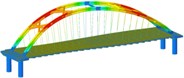 | 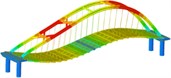 |
Frequency | 0.332 | 0.619 | 0.640 | ||
isolation | Mode shape | 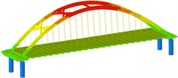 | 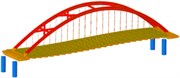 | 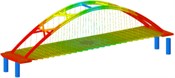 | |
Frequency | 0.233 | 0.251 | 0.363 | ||
Working condition 9 | Non-isolated | Mode shape | 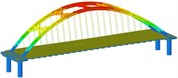 |  | 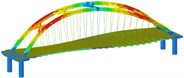 |
Frequency | 0.330 | 0.640 | 0.691 | ||
isolation | Mode shape | 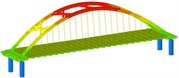 |  | 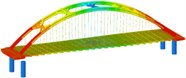 | |
Frequency | 0.232 | 0.251 | 0.365 |
5. Selection of seismic wave and apparent wave speed
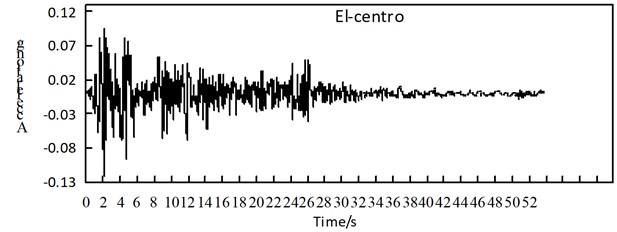
The seismic fortification intensity of the area where the bridge is located is 8 degrees (0.2 g), and the site category is Type II. The El Centro seismic wave is selected, and the peak acceleration value of the seismic wave is multiplied by a coefficient of 0.339 for adjustment. The adjusted seismic wave is shown in Fig. 3, and the action time is taken as 20 s, the excitation direction is uniform excitation along the bridge direction, uniform excitation across the bridge direction, uniform excitation vertical direction, multi-dimensional combination one (long bridge direction + 0.3 horizontal bridge direction + 0.3 vertical) excitation, multi-dimensional combination two (0.3 forward bridge direction + Transverse bridge direction + 0.3 vertical direction) excitation, multi-dimensional combination three (0.3 along bridge direction + 0.3 transverse bridge direction + vertical direction) excitation and the apparent wave speed is 100 m/s, 200 m/s, 300 m/s, 400 m/s, Multi-point excitation of 500 m/s, 1000 m/s, 1500 m/s, 2000 m/s.
Fig. 2Frequency comparison
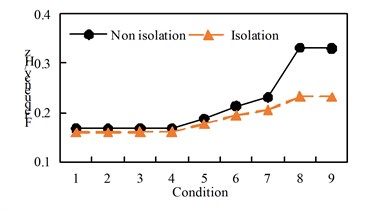
a) First order
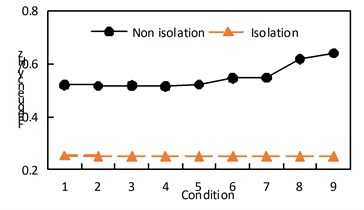
b) Second order
c) Third order
Fig. 3El-centro seismic wave adjusted
6. Earthquake response analysis
6.1. Internal force of arch rib
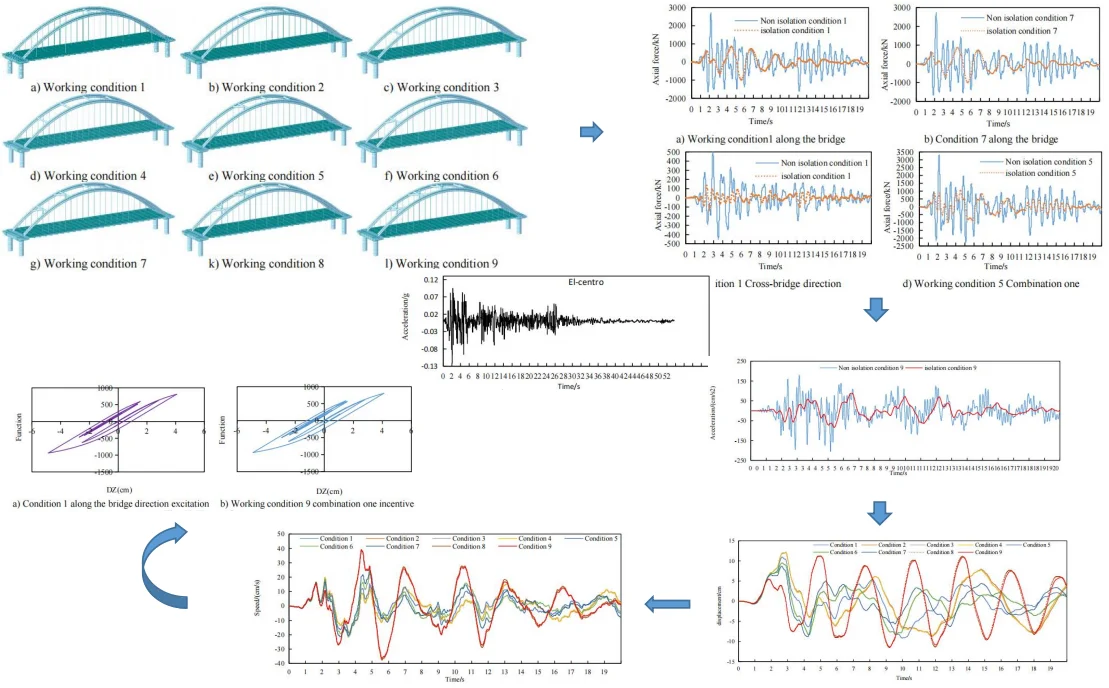
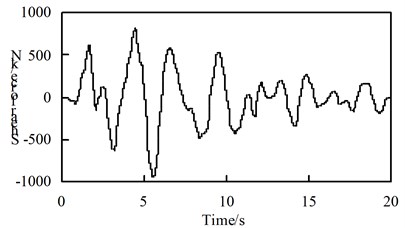
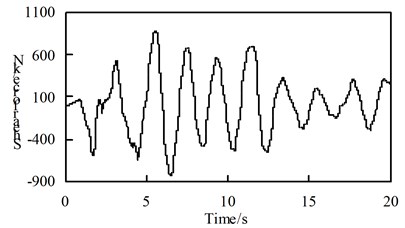
See Table A1 for the maximum internal force and damping rate of arch ribs in different models under uniform excitation. See Table A2 for the maximum internal force and damping rate of arch ribs in different models under multi-dimensional combined excitation. Under multi-point excitation considering traveling wave effect, the maximum internal force and shock absorption rate of arch ribs in different models under various working conditions are shown in Table A3. The time-history response of partial arch foot axial force is shown in Fig. 4.
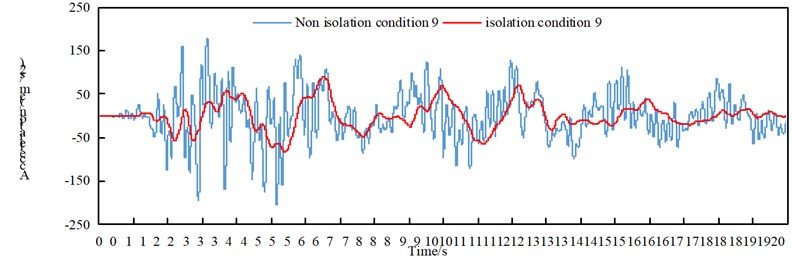
Through the comparison of Table A1 to Table A3 and Fig. 4, we can get:
(1) Under the action of seismic waves with different wave speeds in the bridge direction, transverse bridge direction, combination 1 and bridge direction, the main internal force of the seismic isolation structure arch rib in each working condition is significantly reduced;
(2) Under the action of vertical earthquake, the main internal forces of the seismic isolation structure arch ribs in various working conditions increased, the shear force increased by more than twice, and the bending moment increased by more than three times;
(3) Under the action of the second combination earthquake, the arch rib axial force of each working condition of the seismic isolation structure decreases, the shear force increases, the bending moment in working condition 8 and 9 increase, and the rest decrease. Under the action of the combination three earthquakes. The main internal force of the arch rib of the seismic isolation structure in the working condition increased, the shear force increased more than doubled, and the bending moment increased more than doubled;
(4) Under the effects of lateral earthquake and combination, the main internal force of the seismic isolation structure arch ribs in working conditions 8 and 9 increase significantly.
Fig. 4Time history response of arch foot axial force
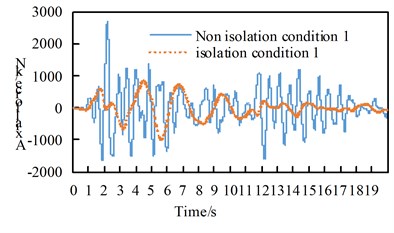
a) Working condition1 along the bridge
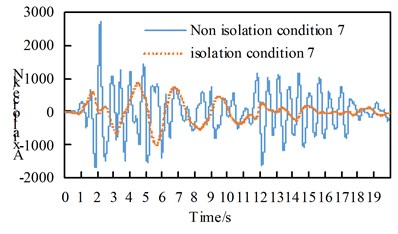
b) Condition 7 along the bridge
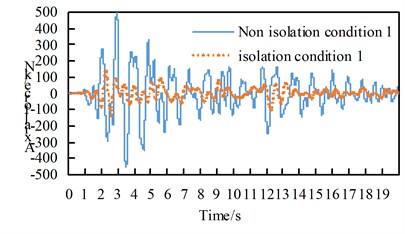
c) Condition 1 Cross-bridge direction
d) Working condition 5 Combination one
6.2. Arch rib displacement
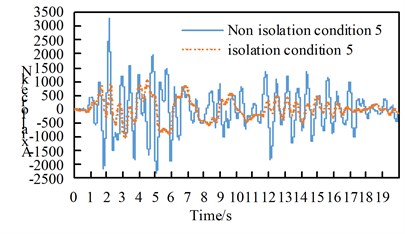
The maximum displacement of the arch rib under transverse excitation is shown in Table 4, and the time-history response of the DY time history of the vault displacement under non-seismic conditions is shown in Fig. 5.
Fig. 5DY time-history response of vault displacement under various conditions of non-seismic isolation
Through the comparative analysis of Table 4 and Fig. 5, we can get:
(1) Under the action of transverse bridge seismic wave, the arch ribs of non-seismic and isolation models mainly undergo lateral displacement. The lateral displacements of working conditions 1, 2, 3, and 4 are not much different. The lateral displacements of working conditions 5, 6, and 7 are more than other, the working condition is small, and it is concluded that the “K”-shaped cross brace is better than the “-” cross brace and the “meter” cross brace in reducing the lateral displacement of the arch rib;
(2) Comparing various working conditions, it can be concluded that setting up transverse bracing on the upper part can reduce the vertical displacement of the arch rib of the non-seismic model.
Table 4Arch rib displacement (unit: cm)
Incentive direction | Displacement direction | Model | Working condition | ||||||||
1 | 2 | 3 | 4 | 5 | 6 | 7 | 8 | 9 | |||
Cross bridge | Along the bridge | Non-isolated | 0.220588 | 0.217772 | 0.218886 | 0.216088 | 0.19172 | 0.215155 | 0.190403 | 0.234662 | 0.238253 |
Vertical Horizontal Vertical Isolated | 0.095618 | 0.095142 | 0.095793 | 0.095229 | 0.08672 | 0.090369 | 0.097304 | 0.14055 | 0.138715 | ||
Cross bridge | Non-isolated | 12.178108 | 12.190638 | 12.160166 | 12.177714 | 10.963965 | 9.490335 | 8.852437 | 11.574302 | 11.437827 | |
Vertical Horizontal Vertical Isolated | 13.456979 | 13.433771 | 13.436001 | 13.414679 | 12.387384 | 11.74146 | 10.855834 | 17.104378 | 16.846004 | ||
Vertical | Non-isolated | 0.575183 | 0.569438 | 0.572487 | 0.566709 | 0.505177 | 0.567788 | 0.505335 | 0.55977 | 0.564412 | |
Isolated | 0.225666 | 0.225264 | 0.225162 | 0.224671 | 0.19714 | 0.210035 | 0.216076 | 0.3417 | 0.344369 | ||
6.3. Arch rib speed
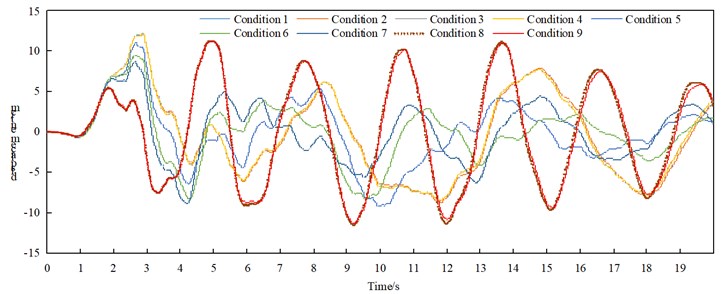
The maximum speed of arch ribs under transverse excitation is shown in Table 5. The time-history response of the transverse velocity of the vault under each condition of seismic isolation is shown in Fig. 6. Through the comparative analysis of Table 5 and Fig. 6, we can get:
(1) Under the action of transverse bridge seismic waves, the lateral velocity of arch ribs in non-seismic and seismic isolation models basically increases in working conditions 1 to 8, while working condition 9 decreases slightly;
(2) Under the action of transverse bridge seismic waves, the longitudinal and vertical speeds of arch ribs in non-seismic and seismic models are relatively small in condition five;
(3) The speed of the arch ribs of the seismic isolation structure in each working condition is reduced.
Table 5Arch rib speed (unit: cm/s)
Incentive direction | Speed direction | Model | Working condition | ||||||||
1 | 2 | 3 | 4 | 5 | 6 | 7 | 8 | 9 | |||
Cross bridge | Along the bridge | Non-isolated | 1.572553 | 1.573233 | 1.55233 | 1.555467 | 1.481314 | 1.592136 | 1.495981 | 1.442885 | 1.443201 |
Isolated | 0.8401 | 0.842009 | 0.831214 | 0.836434 | 0.801512 | 0.875925 | 0.845275 | 0.88414 | 0.885579 | ||
Cross bridge | Non-isolated | 25.172737 | 25.105125 | 25.468387 | 25.328813 | 27.179484 | 29.70583 | 31.043626 | 39.780206 | 38.68521 | |
Isolated | 19.793487 | 19.782502 | 19.837443 | 19.837609 | 18.940581 | 23.446982 | 26.028057 | 39.182534 | 38.69969 | ||
Vertical | Non-isolated | 3.808268 | 3.734763 | 3.786084 | 3.709999 | 3.400459 | 3.806481 | 3.455232 | 3.459467 | 3.521407 | |
Isolated | 1.711642 | 1.729262 | 1.698642 | 1.715102 | 1.625263 | 1.767564 | 1.702519 | 1.688422 | 1.690779 | ||
Fig. 6Time-history response of vault lateral velocity in each case of seismic isolation
6.4. Absolute acceleration of arch rib
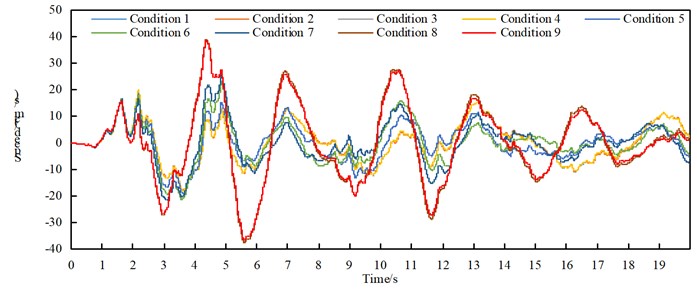
The maximum absolute acceleration of the arch rib under transverse excitation is shown in Table 6, and the time-history response of the lateral acceleration of the nine vaults under working conditions is shown in Fig. 7. Through the comparative analysis of Table 6 and Fig. 7, it can be obtained:
(1) Under the action of the transverse bridge seismic wave, the non-isolated and isolated model arch rib lateral acceleration, the non-seismic structure working condition 5 and working condition 7 are smaller, the seismic isolation structure working condition 7 is relatively small, and the working condition 9 is relatively small. Working condition 8 is reduced, it can be inferred that the “米”-shaped cross brace at the top of the arch rib, and the “K”-shaped cross brace at the lower part will help reduce the absolute acceleration of the arch rib.
(2) The absolute acceleration of the arch rib of the seismic isolation structure in each working condition is significantly reduced.
Table 6Absolute acceleration of arch ribs (unit: cm/s2)
Incentive direction | Absolute acceleration direction | Model | Working condition | ||||||||
1 | 2 | 3 | 4 | 5 | 6 | 7 | 8 | 9 | |||
Cross bridge | Cross bridge | Non-isolated | 302.069666 | 298.588074 | 314.635446 | 306.619751 | 291.123396 | 315.517481 | 291.100165 | 343.150259 | 338.930472 |
Isolated | 83.273905 | 82.935068 | 82.92821 | 83.290524 | 82.154905 | 81.068172 | 79.804811 | 91.825414 | 88.816718 | ||
Fig. 7Time-history response of lateral acceleration of nine vaults under working conditions
6.5. Relative acceleration of arch rib
The maximum relative acceleration of arch ribs under transverse excitation is shown in Table 7.
Table 7Relative acceleration of the arch ribs (unit: cm/s2)
Incentive direction | Relative acceleration direction | Model | Working condition | ||||||||
1 | 2 | 3 | 4 | 5 | 6 | 7 | 8 | 9 | |||
Cross bridge | Cross bridge | Non-isolated | 350.799422 | 353.664181 | 349.011316 | 349.716454 | 351.965781 | 330.543943 | 325.231323 | 348.104201 | 346.062742 |
Isolated | 157.707118 | 157.621842 | 157.721081 | 157.612437 | 156.244506 | 156.104435 | 154.734779 | 150.697906 | 151.129868 | ||
Through the comparative analysis of Table 7, we can get:
(1) Under the action of the transverse bridge seismic wave, the relative acceleration of the arch ribs of the non-seismic and isolation models is relatively small for the non-seismic structure working conditions 6 and 7, and the seismic isolation structure working conditions 1 to 7 basically show a decreasing trend;
(2) The relative acceleration of the arch rib of the seismic isolation structure in each working condition is significantly reduced.
6.6. Shear force and displacement of seismic isolation support
See Table 8 for the maximum shear force and displacement of the seismic isolation support. See Fig. 8 for the shear force comparison of some supports. See Fig. 9 for the displacement comparison of some supports.
Table 8Maximum shear force and displacement of seismic isolation support
Incentive direction | Working condition | 1 | 2 | 3 | 4 | 5 | 6 | 7 | 8 | 9 |
Along the bridge | Shear force / kN | 940.21 | 939.78 | 939.62 | 940.56 | 940.73 | 940.49 | 939.69 | 938.43 | 938.22 |
Displacement / cm | 4.87 | 4.87 | 4.86 | 4.90 | 4.90 | 4.90 | 4.89 | 4.84 | 4.84 | |
Cross bridge | Shear force / kN | 873.87 | 873.54 | 873.76 | 873.44 | 861.16 | 844.86 | 843.41 | 762.70 | 753.41 |
Displacement / cm | 4.34 | 4.33 | 4.34 | 4.33 | 4.23 | 4.09 | 3.95 | 3.40 | 3.35 | |
Vertical | Shear force / kN | 190.50 | 190.67 | 190.48 | 190.66 | 190.81 | 190.56 | 190.93 | 191.25 | 191.63 |
Displacement / cm | 0.75 | 0.75 | 0.75 | 0.75 | 0.75 | 0.75 | 0.75 | 0.75 | 0.76 | |
Combination one | Shear force / kN | 934.84 | 937.98 | 937.77 | 936.80 | 934.97 | 936.03 | 937.64 | 938.89 | 938.63 |
Displacement/cm | 4.97 | 4.99 | 5.00 | 5.01 | 4.98 | 4.98 | 4.96 | 4.94 | 4.91 | |
Combination two | Shear force / kN | 852.10 | 851.64 | 855.63 | 852.19 | 837.90 | 822.17 | 815.99 | 745.03 | 741.08 |
Displacement / cm | 4.37 | 4.38 | 4.41 | 4.37 | 4.22 | 4.18 | 3.91 | 3.45 | 3.34 | |
Combination three | Shear force / kN | 448.11 | 450.55 | 448.51 | 452.70 | 440.66 | 442.84 | 446.90 | 442.42 | 442.31 |
Displacement / cm | 1.88 | 1.84 | 1.84 | 1.81 | 1.88 | 1.85 | 1.85 | 1.86 | 1.86 |
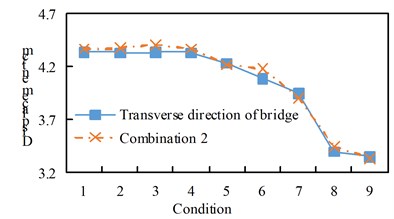
Fig. 8Comparison of bearing shear force
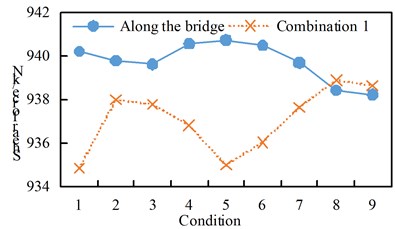
a) Along the bridge and combination one
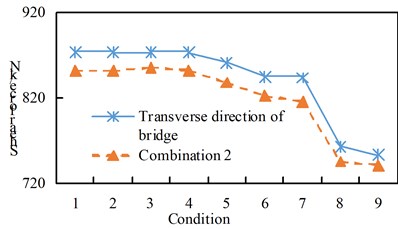
b) Cross-bridge direction and combination two
Fig. 9Comparison of bearing displacement
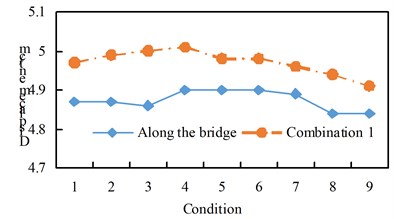
a) Along the bridge and combination one
b) Cross-bridge direction and combination two
See Figure 10 for the shear response time history of some supports. Hysteresis curve for some supports. See Fig. 11. From the analysis of Table 8 and Fig. 8 to Fig. 11, we can get:
(1) The maximum shear force of the seismic isolation support under the excitation of working conditions 1 to 7 is greater than that of combination 1, and the maximum shear force of the seismic isolation support under the excitation of working conditions 8 and 9 is greater than the excitation of the forward bridge;
(2) Under the action of the transverse bridge direction and combination two, the maximum shear force of the seismic isolation support of working conditions 1 to 9 shows a decreasing trend, and the linear direction is basically similar, and the transverse bridge excitation of each working condition is greater than the combination two excitation;
(3) The maximum displacement of each working condition is that the excitation of combination one is greater than the excitation along the bridge direction, and the cross-bridge direction and combination two are basically the same, and there is a decreasing trend from working condition 1 to working condition 9;
Under the vertical excitation, the shear force and displacement of all working conditions are basically the same.
Fig. 10Time history response of bearing shear force
a) Working condition 5, along the bridge direction excitation
b) Working condition 1 cross-bridge excitation
Fig. 11Hysteresis curve
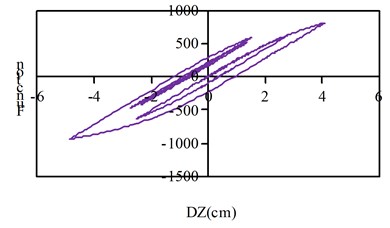
a) Condition 1 along the bridge direction excitation
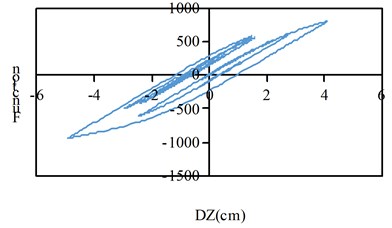
b) Working condition 9 combination one incentive
7. Conclusions
Nine non-isolated and earthquake-isolated structural models under different cross-bracing arrangements were established, and Elcentro seismic waves were selected. The internal force, displacement, velocity, absolute acceleration, relative acceleration, and separation of arch ribs of each model were compared and analyzed under uniform excitation along the bridge, transverse and vertical directions, multi-dimensional combined excitation, and multipoint excitation considering the traveling wave effect.
Through the above comparative analysis, we can get:
1) The main internal force of the arch ribs of the seismic isolation structure in each working condition decreases significantly under the action of the bridge direction, the horizontal bridge direction, the combination one, and the seismic waves with different wave speeds. Under the vertical earthquake action, the arch of the seismic isolation structure, the main internal force of the rib increases. Under the action of the second combination earthquake, the axial force of the arch rib in each working condition of the seismic isolation structure decreases, the shear force increases, the bending moment working conditions eight and nine increase, and the rest decrease, and the combination three under the action of an earthquake, the main internal forces of the seismic isolation structure arch ribs in various working conditions have increased;
2) Under the action of transverse bridge seismic waves, the arch ribs of non-seismic and isolation models mainly undergo lateral displacement. The “K”-shaped cross brace is better than the “-” cross brace and the “meter” shape in reducing the lateral displacement of the arch rib. Transverse bracing, setting transverse bracing on the upper part of the arch rib can reduce the vertical displacement of the arch rib of the non-seismic model;
3) Under the action of transverse seismic waves, the lateral velocity of the arch ribs of the non-seismic and isolation models basically increased, and the velocity of the arch ribs of the seismic isolation structure under various working conditions decreased;
4) The “meter”-shaped cross brace at the top of the arch rib and the “K”-shaped cross brace at the lower part help reduce the lateral acceleration of the arch rib. The absolute acceleration and relative acceleration of the arch rib of the seismic isolation structure under various working conditions are significantly reduced;
5) Under the action of the maximum shear force of the seismic isolation support in the transverse direction and the combination two, working conditions 1 to 9 show a decreasing trend, and the linear directions are basically similar. In all conditions, the excitation of combination one is greater than the excitation along the bridge direction, and the cross-bridge direction and combination two are basically the same, and there is a decreasing trend from working condition one to working condition nine.
References
-
Dong Rui et al., “Stability analysis of long-span CFST truss arch bridges with L-shaped bracings,” (in Chinese), China Civil Engineering Journal, Vol. 53, No. 5, pp. 89–99, 2020.
-
Zhang Sumei and Yun Di, “Lateral brace arrangement for large-span half-through concrete filled steel tube arch bridge,” (in Chinese), Journal of Jilin University (Engineering and Technology Edition), Vol. 39, No. 1, pp. 108–112, 2009.
-
Wan Peng and Zheng Kaifeng, “The effect of end bracing location on out-of-plane ultimate bearing capacity of steel arch bridges,” (in Chinese), China Railway Science, Vol. 27, No. 1, pp. 19–22, 2006.
-
Jin Bo et al., “Effect of lateral brace on the stability of cable-stayed concrete filled steel tube arch bridge,” (in Chinese), Journal of Hunan University (Natural Sciences), Vol. 33, No. 6, pp. 6–10, 2006.
-
Chen Baochun et al., “Application of concrete-filled steel tube arch bridges in China: current status and prospects,” (in Chinese), China Civil Engineering Journal, Vol. 50, No. 6, pp. 50–61, 2017.
-
Liu Zhao and Lu Zhitao, “Lateral buckling load of tied-arch bridges with transverse braces,” (in Chinese), Engineering Mechanics, Vol. 21, No. 3, pp. 21–24, 2004.
-
Wu Meirong et al., “Dynamic characteristics of half-through concrete-filled steel tubular arch bridges,” (in Chinese), Journal of Vibration and Shock, Vol. 36, No. 24, pp. 85–90, 2017.
-
Kong Dandan et al., “Influence of local instability of members on overall stability of steel truss arch bridge,” (in Chinese), Journal of Northeast Forestry University, Vol. 49, No. 7, pp. 116–121, 2021.
-
Li Xiayuan, Chen Jianbing, and Bao Guangming, “Comparison and selection of wind bracing reinforcement schemes for concrete-filled steel tube tied arch bridges based on dynamic characteristics,” (in Chinese), Chinese Foreign Highway, Vol. 35, No. 1, pp. 160–165, 2015.
-
Zheng Xiaoyan et al., “Analysis of stability and influences of temporary cross bracings of PC tied arch bridge at construction stages,” (in Chinese), Bridge Construction, Vol. 42, No. 1, pp. 67–71, 2012.
About this article

This research was funded by the Fundamental Research Funds for the Central Universities (31920210078), the National Natural Science Foundation of China (51868067).
The datasets generated during and/or analyzed during the current study are available from the corresponding author on reasonable request.
The authors declare that they have no conflict of interest.
