Abstract
The characters of high frequency reciprocating equipment are quick starting and stopping, short range, high frequency and multi-freedom reciprocating motion. The inertia introduced by the high frequency reciprocating motion of a LED chip sorter has complicated effects on the positional accuracy. It is necessary to obtain dynamics of the sorting arm to suppress the vibration of the high frequency operation. The positioning precision and positioning time are affected by the natural vibration of the sorting arm by analyzing the displacement response. The paper verifies that the inherent vibration of the sorting arm has a crucial effect on its positioning precision and positioning time. Under static condition, due to the additional mass of the accelerometers, the research results show that there is no obvious difference in the experimental modal analysis (EMA) based on multi-type sensors. The modal parameters identified by accelerometers and strain gauges are very close. The modal parameters are obtained through the modal analysis method, which combines the strain modal analysis and operational modal analysis (OMA), under high frequency reciprocating motion. The paper verifies that the modal parameters of lightweight structure are very different in the static and operation. The key points of each mode are found by analyzing the modal amplitudes at different speeds which provide the guiding principle and basis for the dynamic optimization of the sorting arm mechanism.
Highlights
- The positioning precision and positioning time are affected by the natural vibration of the sorting arm by analyzing the displacement response.
- The paper verifies that the inherent vibration of the sorting arm has a crucial effect on its positioning precision and positioning time.
- The paper verifies that the modal parameters of lightweight structure are very different in the static and operation.
- The key points of each mode are found by analyzing the modal amplitudes at different speeds.
1. Introduction
The operating vibration of the high-speed rotating mechanism is a major factor hindering the production efficiency. The chip sorting machine is such a structure in the chip industry. The most critical component is the sorting arm which quickly grips and moves a chip. It has the following characteristics: fast movement, short movement distance, high frequency reciprocating motion, quick start and stop and so on. The vibration of the sorting arm directly affects the positioning precision, increases the positioning time and reduces the production efficiency. Therefore, the vibration characteristics of the high-frequency mechanism in operation are studied in this paper. The purpose is to suppress vibration and improve chip pickup precision. The vibration of the sorting arm occurs during operation, and the end of the vibration is mainly from the high-speed movement process. The flexible features present on the sorting arm as the speed increases and its dynamic characteristics will change, affecting the positioning precision.
At present, a vibration suppression method must be capable of achieving dynamic characteristics during operation. Taking the PLCK-PLACE class structure as the research object, Barre P. J. pointed out the inertial vibration is caused by the repeated starting and stopping, which has a direct influence on positioning precision. The effect of inertial vibration, which can be neglected at a low speed, becomes the key factor in high-speed motion [1]. Symens W pointed out that high acceleration may stimulate the vibration mode structure, where the natural frequency of these structures depends on the work area location [2]. Canadian scholar Zaghbani I studied the dynamic characteristics of the machine in the stationary and motion states, and the results demonstrate that the modal parameters of the machine differ significantly [3]. For the high-speed rotation positioning mechanism, the rotation speed and positioning precision are high. The positioning precision has a direct relationship with the natural frequency and modal shape of the mechanism. Therefore, the dynamic characteristics of the motion and stationary states cannot be regarded as the same, and the traditional experimental modal analysis method is not applicable to the operating state. A method must therefore be proposed for obtaining the modal parameters of the mechanism at a high speed. Baradie M. A. E. studied the flutter problem of the radial drilling machine during operation and stressed that drilling in the working state constitutes a dynamic system. Certain system parameters from the static state become unstable, and the final processing efficiency and quality are affected by the machine vibration [4]. The boundary conditions of the joint are changed because of the relative movement between the flexible members. The natural frequency and mode of the structure are closely related to the state of the mechanism. This nonlinear phenomenon inevitably affects the stability and performance of the system [5, 6].
The current dynamic analysis methods can be divided into four categories: theoretical, experimental, operational modal, and strain modal analyses. (i) Theoretical analysis is an important method for obtaining modal parameters. Although the finite element method is used extensively in structural dynamics, the variation law of parameters among parts is still not fully understood [7]. Therefore, the precision of operating parameters is not high when using this method. (ii) Experimental modal analysis (EMA) methods are usually applied to the static state and obtain the static modal parameters, which is not suitable for acquiring parameters in the operating state [8]. (iii) Operational modal analysis (OMA) is used under this condition [9]. Ibrahim S. R first used the stochastic reduction method to identify structural modal parameters in 1977 [10]. While the operational modal analysis method overcomes various defects of the experimental modal analysis method, it also exhibits certain shortcomings. This method requires white noise excitation [11], which is difficult to achieve. Furthermore, the method relies only on the response signal for parameter identification and cannot obtain the frequency response or transfer functions [12]. In this study, an accelerometer is used to obtain the response signal. For light structures, the accelerometer contributes an additional mass that affects the precision of the final experimental results. (iii) Strain modal analysis can avoid the above problems [13]. Kranjc T. proposed a strain mode shape acquisition method by symmetrically arranging the accelerometer and strain gauge, where only one excitation can be obtained for the displacement and strain mode shapes [14]. Kranjc T. made a comparison between classic and strain experimental modal analysis [15]. Zhang C. D. presents an algorithm for optimal placement of multi-type sensors, including strain gauges, displacement transducers and accelerometers, for the best reconstruction of responses of key structural components [16]. Anastasopoulos D. performed the identification of the modal strains of a pre-stressed concrete beam, subjected to a progressive damage test [17]. Loutas T. H. carried out in-plane dynamic strain measurements for structural health monitoring [18]. Zhu H. Z. analyzed the influence of asphalt performance on the fatigue resistance performance of asphalt mixture based on strain test [19].
In summary, strain gauges are widely used in fatigue testing and health monitoring. Some methods can only obtain the modal shapes of the structure at a low speed or static state. Some methods cannot avoid the impact of sensor quality on the experiment. Considering the shortcomings of the above-mentioned methods, an experiment for identifying modal parameters under high frequency reciprocating motion is carried out, which is based on strain response and combines the strain modal analysis method and OMA method. This experiment expands the application scope of the classic EMA and reduces the error because of the additional quality of the actual sensors. The main purpose of the study is (i) to analyze the influence of sorting arm vibration on positioning precision and (ii) to compare the EMA based on multi-type sensors and (iii) to study the dynamics of the sorting arm under the static and operation.
The paper is organized as follows. In Section 2, the influence of sorting arm vibration on positioning precision is discussed. In Section 3, the EMA experiment based on multi-type sensors is studied. In Section 4, the OMA experiment based on the strain response is analyzed. In Section 5, a conclusion from the current research is presented.
2. Influence of sorting arm vibration on positioning precision
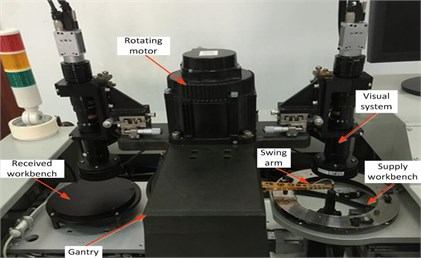
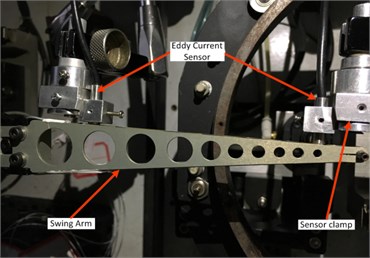
Fig. 1(a) presents an experiment platform: high-speed LED sorting machine (model: DH-LS436LED). Its motion precision is in the micron level, and the movement acceleration of rotary arm is up to 15 g. The reciprocating frequency of arm is greater than 15 Hz, and the chips picking time is 10 ms. The double sorting arm system rotates 180° back and forth. When the one arm takes a chip, the other arm puts the chip. While two worktables move in the horizontal plane to ensure the positioning precision of the chip. Fig. 1(b) presents the arrangement of the eddy current sensor.
Fig. 1a) LED chip sorting machine sorting arm, b) Eddy current sensor arrangement
a)
b)
The vibration that affects the precision of chip pick-up comes from the following aspects: (i) As the sorting arm movement is driven by the servo system motor, and the movement speed is extremely fast, there is a certain error in response precision between the servo system and the motor. When the servo system sends a stop command, the motor cannot stop immediately, so that the sorting arm is still in the motion state that means that the vibration error is caused by the motor drive. But Bloch. S. [3] pointed out that (i) the servo control method was difficult to reduce the high-frequency operating mechanism vibration on the operating precision; (ii) The angular arm velocity could be the same during the movement, but the linear velocity at the end of the arm was much larger than that at the root. The small vibration of the end was amplified to produce a large vibration displacement. This kind of vibration due to size of arm could be avoided effectively. (iii) The sorting arm was very light, and the running speed was great, it would appear inevitably with flexible characteristics during the operation. The sorting arm has a certain vibration morphology, which has an inseparable relationship with structure design, material and operating status. It is also a main factor affecting the positioning precision. Some scholars have pointed out that the natural modal vibration could be ignored in the low speed, but it would become a key factor affecting the positioning precision.
In the operation of a high-speed mechanism, complex mode shapes are caused by an inertial impact which affects the positioning precision. To study the influence of the inherent vibration on the positioning precision during the operation, the vibration displacement of arm is analyzed at three speeds by using an eddy current sensor (operating frequencies: 4 Hz, 5 Hz and 6 Hz). The model of eddy current sensor is Keith EX-V01, and the precision is 1 μm. The range is 1 mm, and the sampling frequency is 4096 Hz. The root and end vibration displacements are measured in the rotation direction in the emergency stop positioning.
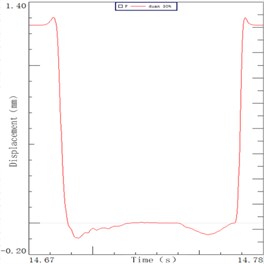
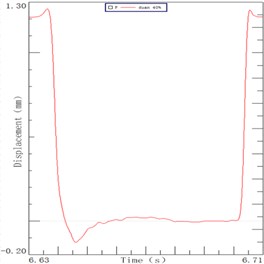
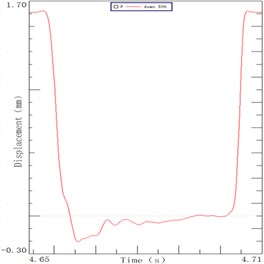
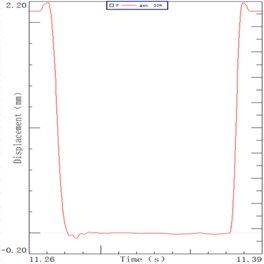
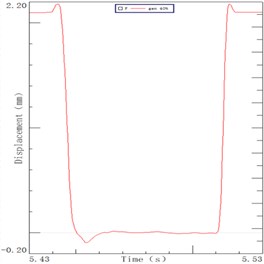
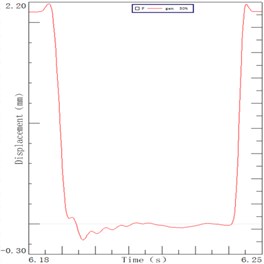
The sorting arm moves up and down in the process of picking up chips. The sorting arm is not excited in the horizontal direction, so its process is the decay movement. The displacement curves of the 4 Hz, 5 Hz and 6 Hz speeds are shown in Fig. 2. It can be seen from the figure, the end of the sorting arm carries out the following movement under the inertia effect after the motor stops moving: it firstly continues to exercise, then there is a decay movement and finally a slow back movement to zero. The end of arm was decayed to zero for 26.9 ms, 27.8 ms, 29.7 ms in three speeds in the Fig. 2(a), 2(b), 2(c). The maximum displacement of the arm end is 95 μm, 127 μm, and 206 μm in the inertia. The displacement curve of the arm root under the speed of 3.8 Hz, 5.1 Hz and 6.2 Hz are respectively shown in Fig. 2(d), 2(e), 2(f). It can be seen from the figure that the displacement curve of the root is similar to that of the end. The root of arm was decayed to zero for 10.5 ms, 12.5 ms and 16.8 ms in three speeds. There is a time difference between the end and the root of the sorting arm which shows that the flexible feature is presented during the operation. Its internal vibration will affect the positioning time and precision of the sorting arm. The time difference is 16.4 ms, 15.3 ms and 12.9 ms which accounts for more than half of the decay time.
A LED chip sorting machine as a representative of the high-speed sorting arm with the description of its main structure and operating process is introduced. Its sorting arm moved forward after the motor emergency stop due to inertia, and then the decay movement is present under the inertial impact. The decay time of arm end is longer than that of the root for about 15 ms, which accounts for more than half of the decay time. Therefore, the inherent vibration of the sorting arm has a crucial effect on its positioning precision and positioning time.
Fig. 2Decay curve of sorting arm end at speeds: a) 4 Hz, b) 5 Hz, c) 6 Hz. Decay curve of sorting arm root at speeds: d) 4 Hz, e) 5 Hz, f) 6 Hz
a)
b)
c)
d)
e)
f)
3. Experimental modal analysis based on multi-type sensors
3.1. Experimental setup and measurements
To study the dynamic characteristics of the sorting arm in the stationary state, the following experiments were carried out as shown in Fig. 3.
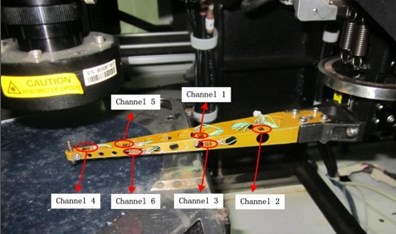
Test #1 (Strain gauge): Strain gauges were attached to the side of the sorting arm. The -direction (rotation direction) of the sorting arm end is excited by a pulse hammer (model: INV9311). Each point strain response is picked up using a dynamic strain acquisition instrument (model: DH5929). The sampling frequency is 5 kHz. The positioning of the strain gauges is shown in Fig. 3(a).
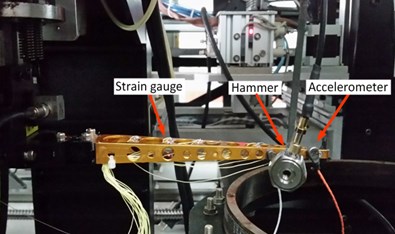
Test #2 (Accelerometer): The vibration of the sorting arm is measured by two accelerometers. An accelerometer is fixed as a reference point (point 5), and the other accelerometer moves the positioning in turn (points 1-4, 6-9). The -direction of the sorting arm end is excited by a pulse hammer (model: INV9311) in Fig. 3(b). The acceleration response signal of the arm is collected by the vibration signal data acquisition instrument (model: LMS SCADAS). The sampling frequency is 4096 Hz. Modal parameters are identified by using the PolyMAX algorithm.
Test #3 (FEA): A finite element model of the sorting arm is created using MSC.PATRAN. It is modeled by 3515 tetrahedral elements and 1425 nodes. For the nodes of the arm root, three translational degrees of freedom are set to zero. The material is 5A06 aluminum alloy, the elastic modulus is 70 GPa, the Poisson’s ratio is 0.34, the density is 2710 kg/m3, and the unit is Solid92 [20].
Fig. 3Experimental setup: a) strain gauges placement, b) accelerometers placement
a)
b)
3.2. Analysis of dynamic characteristics of rotating direction
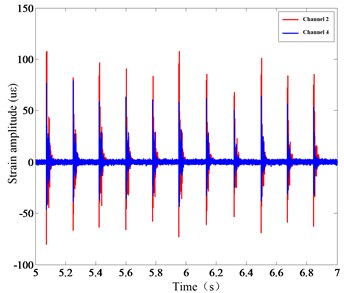
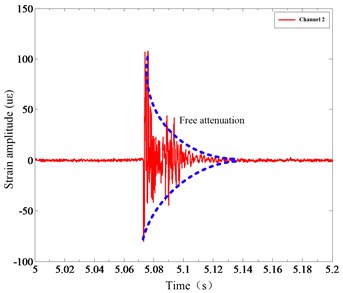
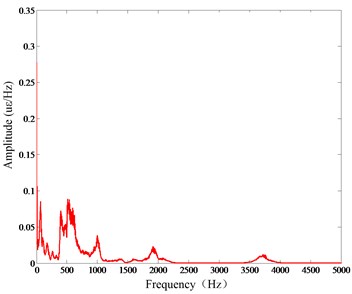
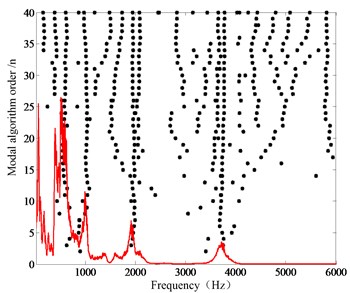
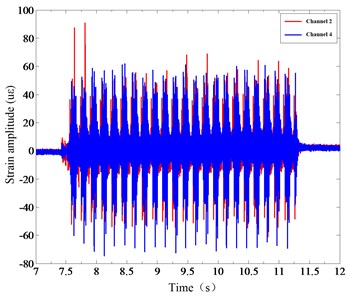
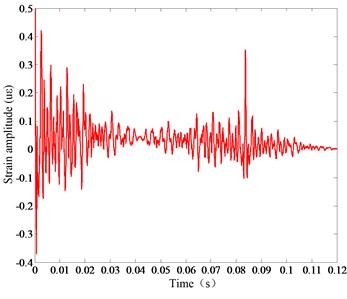
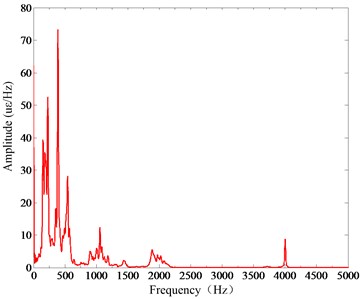
Fig. 4(a) shows the vibration signals collected by strain gages in the tapping state. It can be seen from the figure that the strain response amplitude of channel 2 is greater than that of channel 4, so the signal-to-noise ratio of channel 2 is higher than that of channel 4. Fig. 4(b) presents the free attenuation vibration of the sorting arm and the overall decay time is 0.07 s. Fig. 4(c) shows the strain frequency response function, and Fig. 4(d) contains a mode stabilization diagram. Then, the modal parameters of the sorting arm will be obtained under the static state, as shown in Table 1.
Table 1Modal parameters
Natural frequency (Hz) | Mode 1 | Mode 2 | Mode 3 | Mode 4 | Mode 5 |
Accelerometer | 169.25 | 429.68 | 706.19 | 993.26 | 1819.57 |
Strain gauge | 169.31 | 436.98 | 723.73 | 1019.38 | 1893.11 |
FEA | 168.58 | 434.46 | 735.41 | 1033.85 | 1912.76 |
Relative difference of accelerometers | 0.4 % | 1.1 % | 4.1 % | 3.8 % | 4.9 % |
Relative difference of strain gauges | 0.60 % | 0.5 % | 1.7 % | 1.4 % | 1.0 % |
From the comparison results, the traditional modal test, strain test and computational modal analysis (FEM) have obtained the first five modes in Table 1. There is a certain error in the recognition of modal frequencies in the high frequency band. The relative difference is not more than 5 % what shows that the results obtained by two methods are more accurate. In addition, there is an additional sensor mass effect in the accelerometer measurement, however the strain gauge additional mass can be ignored. The additional stiffness of the strain gauge is small, and the strain gauge is superior to the accelerometer in the low frequency. The frequency of the strain modal method is closer to the FEA than that of the traditional modal method. Therefore, the modal parameters of the sorting arm can be accurately measured by using the strain modal method.
Fig. 4a) Strain response time-domain under static state, b) free attenuation vibration, c) strain frequency response function, d) mode stabilization diagram
a)
b)
c)
d)
The mode shapes represent the relative vibration shapes of the structures in the order modes. Table 2 presents the fifth-order mode shapes identified by conventional modal experiment, strain modal experiment and FEA calculations in the stationary state. The vibration of the arm middle and root is small, but the vibration of the end is the highest in the second mode. The sorting arm exhibits a reverse posture in the fourth mode. It is the type of vibration that has a significant effect on the arm positioning precision.
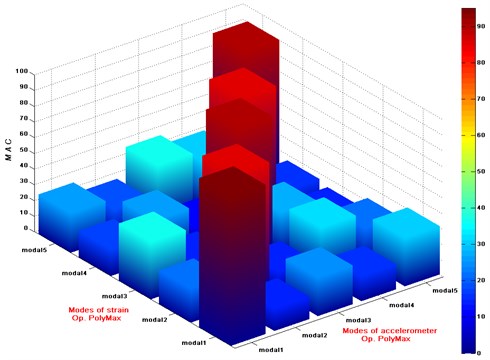
Besides, a powerful tool, having the modal assurance criterion (MAC), was used to evaluate the quality of the mode shapes. MAC is defined as the squared correlation coefficient between two mode shape vectors as follows:
If two vectors are estimates of the same physical mode shape, the MAC should approach the unity (100 %), otherwise the MAC should be low [21]. A high-quality mode set normally contains diagonal elements which are 100 % (by definition) and off-diagonal elements which have a low value (close to 0 %). Fig. 5 presents the MAC values of the displacement mode shapes between accelerometers and the strain gauge test. From the figure, it is a high-quality MAC because the diagonal elements are close to 100 %, and the diagonal elements are small [22-24]. It illustrates that the displacement mode shapes identified by accelerometers and strain test parameters are very close. The mode shapes obtained by strain response are high-quality modes.
Table 2Modal shapes of five order modes
Mode | DMSs (FEA) | DMSs (accelerometer) | DMSs (strain) |
1 | 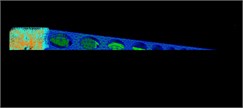 | 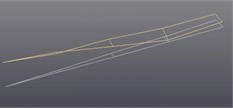 | 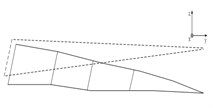 |
2 | 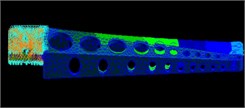 |  | 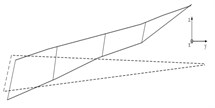 |
3 | 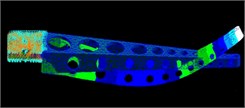 | 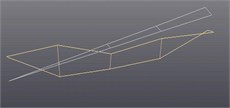 | 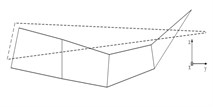 |
4 | 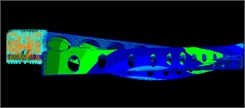 | 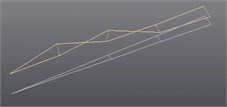 | 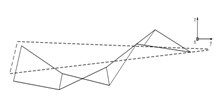 |
5 | 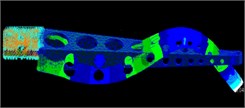 |  | 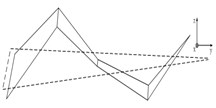 |
Fig. 5MAC values between mode shapes of accelerometer and strain using Op.PolyMAX
4. Operational modal analysis based on strain response
4.1. Time domain analysis based on strain response in operating state
Under the high-frequency reciprocating motion, the moment of inertia of the acceleration sensor is very high, so it is impossible to measure the arm vibration using the accelerometers. Therefore, the lightweight strain gauges are required.
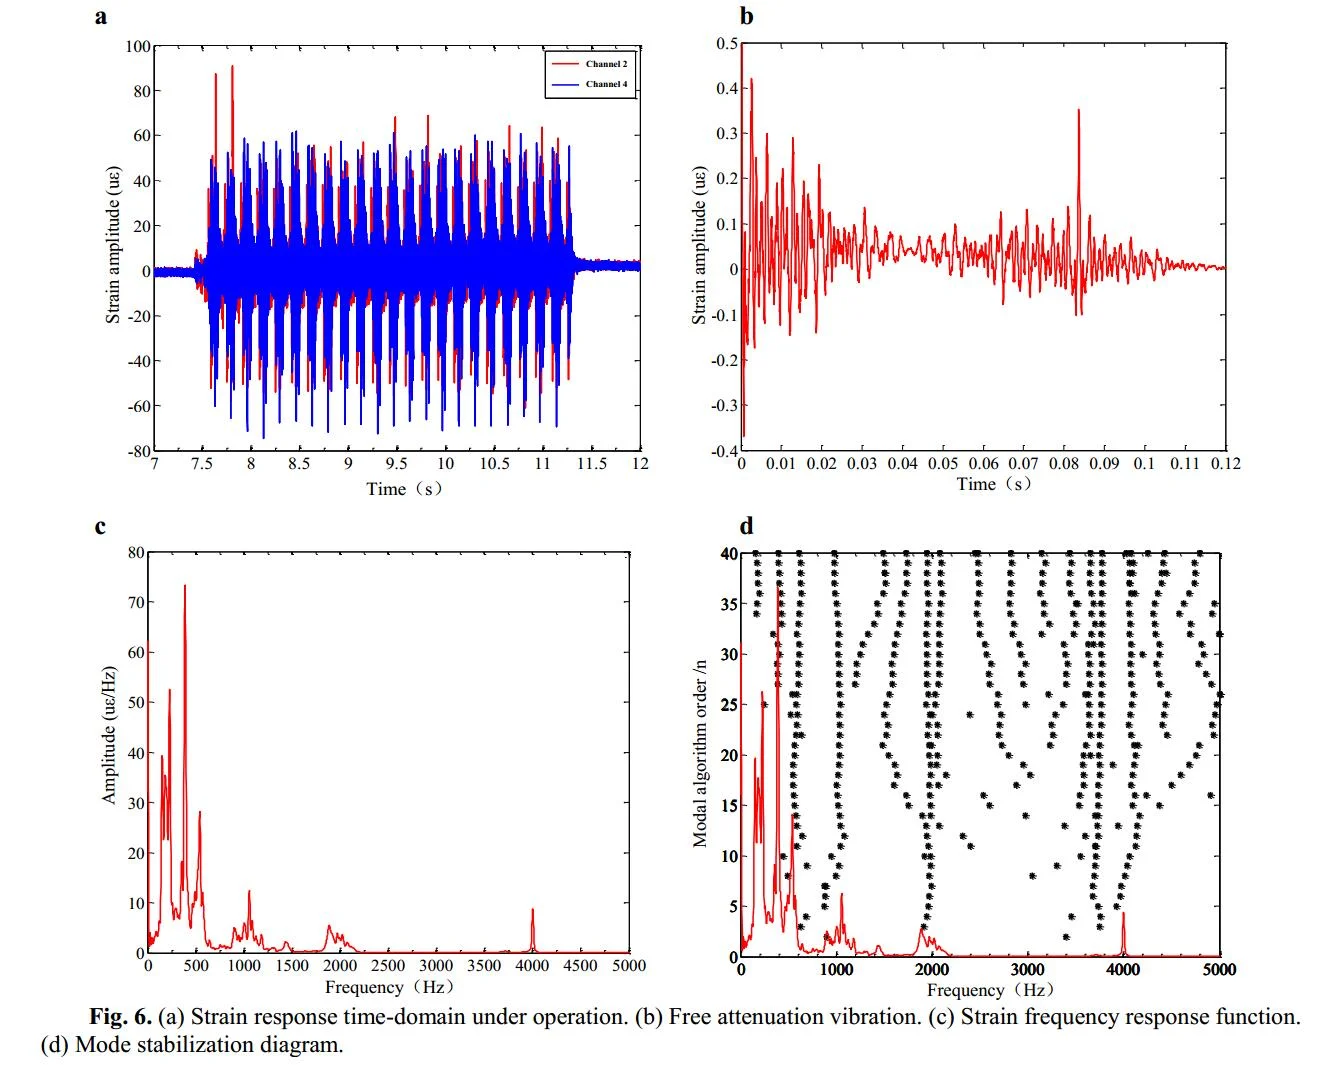
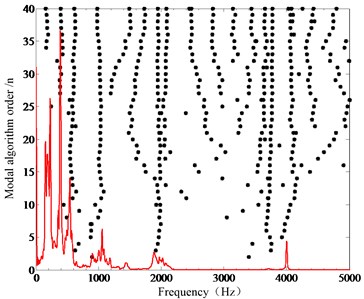
Fig. 6(a) shows the vibration time-domain signals collected by strain gages in the operation. Fig. 6(b) shows the free attenuation vibration of the sorting arm and the overall decay time is 0.1 s. Fig. 6(c) is the strain frequency response function, and Fig. 6(d) is the mode stabilization diagram. Then, the modal parameters of the sorting arm will be obtained under the operation.
Table 3 presents the natural frequency of the sorting arm under the operating and static states. With the change of the state of motion, the 1st mode remains unchanged, and the rest of the modes becomes smaller. Since the 1st mode is the structure of the whole machine, the natural frequency of this mode basically does not change with the movement. For the 2nd, 3rd, 4th and 5th mode, it is the local modal of the sorting arm. Due to the high-frequency reciprocating motion, the boundary conditions of the joint of the sorting arm structure are changed, and the natural frequencies increase.
Fig. 6a) Strain response time-domain under operation, b) free attenuation vibration, c) strain frequency response function, d) mode stabilization diagram
a)
b)
c)
d)
Table 3Sorting arm frequency under operation and static states.
Natural frequency (Hz) | Mode 1 | Mode 2 | Mode 3 | Mode 4 | Mode 5 |
Stationary state | 169.31 Hz | 436.98 Hz | 723.73 Hz | 1019.38 Hz | 1893.11 Hz |
High-frequency reciprocation | 174.46 Hz | 445.53 Hz | 733.17 Hz | 1035.67 Hz | 1915.77 Hz |
The components of the arm structure have a certain movement sequence in operation, so its dynamic characteristics are not the same in the motion and static states. The arm performance is directly affected by the dynamic characteristics in operation. The validity of modal analysis based on the strain response has been proved in Chapter 3, so the strain gauge is used to analyze the response signal in operation. To study the difference of dynamic characteristics in operation, the vibration response signal was collected at several speeds (operating frequency: 4 Hz, 6 Hz, 10 Hz). As the chip is placed on the blue film, the vibration noise is absorbed by the blue film in the picking process. In addition, the amplitude of arm is relatively small in the vertical direction (-direction), so the vertical vibration will be not considered, and the horizontal vibration (-direction) will be mainly analyzed.
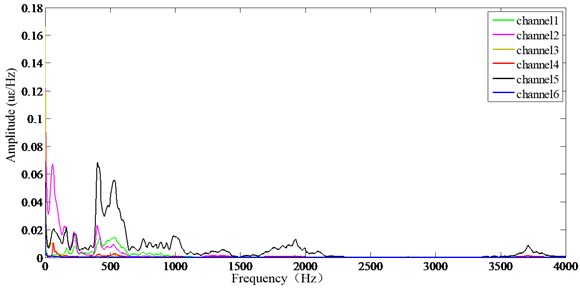
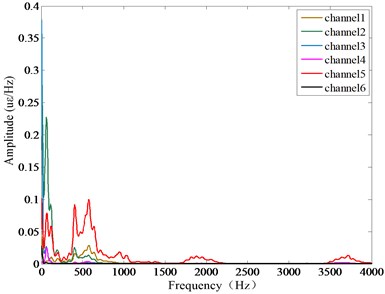
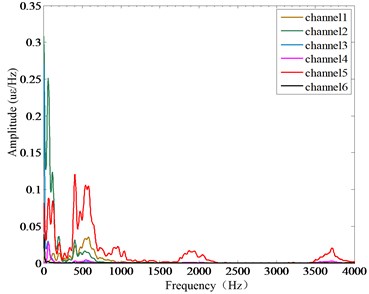
Strain frequency response function of sorting arm at different speeds (4 Hz, 6 Hz and 10 Hz) is shown in Fig. 7. The following conclusion through analyzing: the greater the sorting arm speed is, the clearer the frequency domain image is, and the higher the peak is. Because the swing speed of the sorting arm is accelerated, and the inertia excitation is increased, the current disturbance is obviously reduced. At 4 Hz speed, only the 1st mode (169.31 Hz) is identified. At 6 Hz speed, 2nd and 3rd modes (171.58 Hz, 439.45 Hz) are identified. At 10 Hz speed, 1stand 2nd and 3rd modes (172.89 Hz, 441.57 Hz and 729.79 Hz) are identified.
Fig. 7Strain frequency response function of sorting arm at different speeds: a) 4 Hz, b) 6 Hz, c) 10 Hz
a)
b)
c)
4.2. Analysis frequency characteristics in operation state
The dynamic characteristics are obtained by comparing the static state and the operating state, as shown in Table 4. Get the following conclusion through analyzing:
(i) Only a few modes have an influence on the arm rotation process, and the frequencies are concentrated in the area of 1000 Hz. The 5th mode frequency in the stationary state does not appear during operation, indicating that only a few modes play a role in the operation.
(ii) The modes are identified in the operation as opposed to the static state. The difference of the 1st mode in two states is about 4 Hz. The difference of the 2nd mode is about 10 Hz. The difference of the 3rd mode is about 9 Hz. The difference of the 4th mode is about 15 Hz. The difference of the 5th mode is about 18 Hz. It shows that dynamics are different in the static and operation states.
(iii) The number of identified modes at different speeds is not the same. It illustrates that the modal frequencies which affect the motion are also different. The greater the speed is, the more the number of modal frequencies will be affected.
(iv) The 1st mode is more stable than the others indicating that the 1st mode is the main mode of vibration.
(v) The 2nd mode always appears either in the static state or the different operation, what indicates that the 2nd mode has a crucial effect on the arm vibration.
Table 4Modal parameters of sorting arm in different states
Natural frequency (Hz) | Mode 1 | Mode 2 | Mode 3 | Mode 4 | Mode 5 | |
Stationary | Accelerometer | 169.25 | 429.68 | 706.19 | 993.26 | 1819.57 |
Strain gauge | 169.31 | 436.98 | 723.73 | 1019.38 | 1893.11 | |
Operation | 6 Hz speed | 171.58 | 439.45 | – | – | – |
10 Hz speed | 172.89 | 441.57 | 729.79 | – | – | |
12 Hz speed | 174.46 | 445.53 | 733.17 | 1035.67 | 1915.77 | |
4.3. Analysis vibration characteristics at different speeds
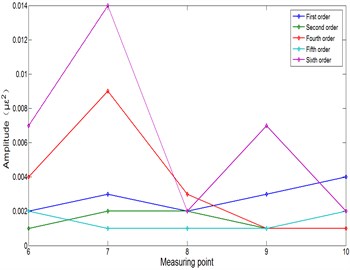
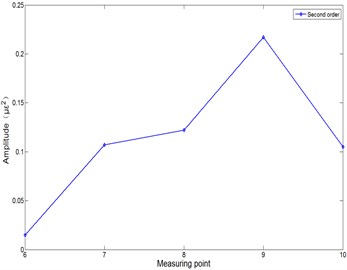
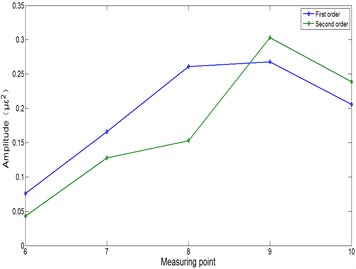
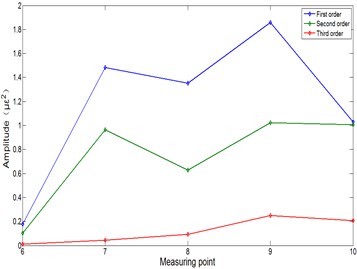
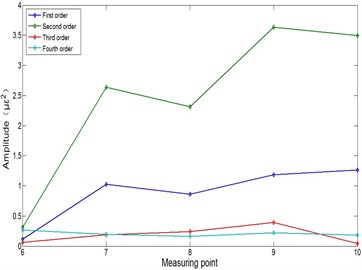
Each modal frequency amplitude of different speeds is presented in Table 5. Fig. 8(a)-(e) presents the modal frequency amplitude at 0 Hz (stationary), 4 Hz, 6 Hz, 10 Hz, 12 Hz speeds respectively. The measuring points numbers 6-10 are five points evenly arranged from the end to the root:
(i) Overall, the modal frequency amplitude increases from the end to the root of the arm. The point 9 is the maximum at the 4 Hz and 6 Hz speeds in Fig. 8(b), 8(c). However, the points 7 and 9 are the maximum at the 10 Hz and 12 Hz speeds in Fig. 8(d), 8(e). It is shown that the point 9 has the greatest influence on the arm vibration at a low speed, and the points 7 and 9 have the greatest influence on the arm vibration at a high speed.
(ii) Each mode has the effect on the arm operation process at different speeds. Fig. 8(c) presents the first two modes which frequency amplitudes are close at 6 Hz speed. Fig. 8(d) presents the first mode frequency amplitude as the largest one at 10 Hz speed. Fig. 8(e) presents the second mode frequency amplitude as the largest one at 12 Hz speed. The influence of the first and second modes is very close at 6 Hz speed in Fig. 8(c), the influence of the first mode is the largest at 10 Hz speed in Fig. 8(d), and the influence of the second mode is the largest at 12 Hz speed in Fig. 8(e).
Table 5Modal frequency amplitude at different speeds
Strain amplitude (μm2) | Measuring channel | |||||
6# | 7# | 8# | 9# | 10# | ||
Stationary state | Mode 1 | 0.002 | 0.003 | 0.002 | 0.003 | 0.004 |
Mode 2 | 0.001 | 0.002 | 0.002 | 0.001 | 0.001 | |
Mode 4 | 0.004 | 0.009 | 0.003 | 0.001 | 0.001 | |
Mode 5 | 0.002 | 0.001 | 0.001 | 0.001 | 0.002 | |
4 Hz speed | Mode 2 | 0.015 | 0.107 | 0.122 | 0.217 | 0.105 |
6 Hz speed | Mode 1 | 0.076 | 0.166 | 0.261 | 0.268 | 0.206 |
Mode 2 | 0.043 | 0.128 | 0.153 | 0.303 | 0.239 | |
10 Hz speed | Mode 1 | 0.179 | 1.484 | 1.352 | 1.857 | 1.029 |
Mode 2 | 0.103 | 0.963 | 0.629 | 1.023 | 1.006 | |
Mode 3 | 0.010 | 0.045 | 0.093 | 0.248 | 0.206 | |
12 Hz speed | Mode 1 | 0.113 | 1.024 | 0.860 | 1.185 | 1.264 |
Mode 2 | 0.312 | 2.636 | 2.311 | 3.636 | 3.498 | |
Mode 3 | 0.060 | 0.190 | 0.242 | 0.390 | 0.043 | |
Mode 4 | 0.270 | 0.193 | 0.160 | 0.224 | 0.183 | |
Fig. 8Modal frequency amplitude at different speeds: a) 0 Hz, b) 4 Hz, c) 6 Hz, d) 10 Hz, e) 12 Hz
a)
b)
c)
d)
e)
5. Conclusions
The paper takes the sorting arm of LED chip sorting machine as the studied object. The dynamics of the sorting arm are studied in the high-frequency reciprocating motion. The main research work is summarized as follows: (i) The positioning precision and positioning time are affected by the natural vibration of the sorting arm by analyzing the displacement response. It is verified that the inherent vibration of the sorting arm has a crucial effect on its positioning precision and positioning time. (ii) Due to the additional mass of the accelerometers, the research results show that there is no obvious difference in the EMA based on multi-type sensors. The modal parameters identified by accelerometers and strain gauges are very close. In addition, the mode shapes obtained by strain gauges are high-quality modes. The dynamics of light structure can be obtained by using of accelerometers and strain gauges under static state, and the results of using strain gauges are more accurate. (iii) The paper verifies that the modal parameters of lightweight structure are very different in the static and operation. The dynamics are also different under different operating parameters. The key points of each mode are found by analyzing the modal amplitudes at different speeds which provide the guiding principle and basis for the dynamic optimization of the sorting arm mechanism.
There are still many shortcomings in this research work. The following aspects can be further studied. (i) The next step is to study the damping of sorting arm structure and explore the influence of damping in high-speed rotating structure. (ii) Fiber Bragg Grating sensors are more accurate, sensitive and more stable than the traditional strain gauges, which can be used to get the strain response. It is more accurate for the recognition results. (iii) The dynamic characteristics and the mode shapes of the sorting arm are studied, but there are many factors affecting its vibration. Next, the influence of positioning accuracy caused by motor control can be studied, such as torsional vibration and so on.
References
-
Barre P. J., Bearee R., Borne P., Dumetz E. Influence of a jerk controlled movement law on the vibratory behaviour of high-dynamics systems. Journal of Intelligent and Robotic Systems, Vol. 42, Issue 3, 2005, p. 275-293.
-
Symens W., Brussel H. V., Swevers J. Gain-scheduling control of machine tools with varying structural flexibilities. CIRP Annals – Manufacturing Technology, Vol. 53, Issue 1, 2004, p. 321-324.
-
Zaghbani I., Songmene V. Estimation of machine-tool dynamic parameters during machining operation through operational modal analysis. International Journal of Machine Tools and Manufacture, Vol. 49, Issues 12-13, 2009, p. 947-957.
-
Baradie M. A. E., Sadek M. M., Tobias S. A. Dynamic acceptance tests for horizontal milling machines based on a statistical theory of machine tool chatter. Journal of Engineering for Industry, Vol. 98, Issue 3, 1976, p. 919-929.
-
Asner B. A. Stability of a large flexible beam in space. Nonlinear Phenomena in Mathematical Sciences, 1982, https://doi.org/10.1016/B978-0-12-434170-8.50013-3.
-
Bruls O., Hoffait S., Cugnon F., Kerschen G. Finite element analysis of strongly nonlinear phenomena in deployable flexible systems. 1st ESA Multibody Dynamics Workshop on Multibody Dynamics for Space Applications, 2010.
-
Rao S. S. The Finite Element Method in Engineering. Fourth Edition, Elsevier, 2005.
-
Eman K. F., Kim K. J. Modal analysis of machine tool structures based on experimental data. Journal of Engineering for Industry, Vol. 105, Issue 4, 1983, p. 282-287.
-
Peeters B., De Roeck G. Stochastic system identification for operational modal analysis: a review. Journal of Dynamic Systems, Measurement, and Control, Vol. 123, Issue 4, 2001, p. 659-667.
-
Ibrahim S. R. Random decrement technique for modal identification of structures. Journal of Spacecraft and Rockets, Vol. 14, Issue 11, 2012, p. 696-700.
-
Schiehlen W. White noise excitation of road vehicle structures. Sadhana, Vol. 31, Issue 4, 2006, p. 487-503.
-
Li B., Cai H., Mao X., Huang J., Luo B. Estimation of CNC machine-tool dynamic parameters based on random cutting excitation through operational modal analysis. International Journal of Machine Tools and Manufacture, Vol. 71, 2013, p. 26-40.
-
Santos F. L. M. D., Peeters B. Strain Modal Analysis. Recent Progress in Flow Control for Practical Flows. Springer International Publishing, 2017.
-
Kranjc T., Slavič J., Boltežar M. The mass normalization of the displacement and strain mode shapes in a strain experimental modal analysis using the mass-change strategy. Journal of Sound and Vibration, Vol. 332, Issue 26, 2013, p. 6968-6981.
-
Kranjc T., Slavič J., Boltežar M. A comparison of strain and classic experimental modal analysis. Journal of Vibration and Control, Vol. 22, Issue 2, 2016, p. 371-381.
-
Zhang C. D., Xu Y. L. Optimal multi-type sensor placement for response and excitation reconstruction. Journal of Sound and Vibration, Vol. 360, 2016, p. 112-128.
-
Anastasopoulos D., De Smedt M., De Roeck G., Vandewalle L., Reynders E. Modal strain identification using sub-microstrain FBG data from a pre-stressed concrete beam during progressive damage testing. Procedia Engineering, Vol. 199, 2017, p. 1846-1851.
-
Loutas T. H., Bourikas A. Strain sensors optimal placement for vibration-based structural health monitoring. The effect of damage on the initially optimal configuration. Journal of Sound and Vibration, Vol. 410, 2017, p. 217-230.
-
Zhu H. Z., Yan E. H., Lu Z. T. Evaluation of fatigue performance of asphalt based on constant strain DSR test. IOP Conference Series: Materials Science and Engineering, Vol. 170, Issue 1, 2017, p. 12003.
-
ANSYS User’s Manual. Volumes I, II, III, IV, Swanson Analysis Systems, 1994.
-
Heylen W., Sas P. Modal Analysis Theory and Testing. Katholieke Universteit Leuven, 2006.
-
Hanson D., Randall R. B., Antoni J., Thompson, D. J., Waters T. P., Ford R. A. J. Cyclostationarity and the cepstrum for operational modal analysis of mimo systems – part I: modal parameter identification. Mechanical Systems and Signal Processing, Vol. 21, Issue 6, 2007, p. 2441-2458.
-
Choi S., Park S., Hyun C. H., Kim M. S., Choi K. R. Modal parameter identification of a containment using ambient vibration measurements. Nuclear Engineering and Design, Vol. 240, Issue 3, 2010, p. 453-460.
-
Hanson D., Randall R. B., Antoni J., Waters T. P., Thompson D. J., Ford R. A. J. Cyclostationarity and the cepstrum for operational modal analysis of MIMO systems – part II: obtaining scaled mode shapes through finite element model updating. Mechanical Systems and Signal Processing, Vol. 21, Issue 6, 2007, p. 2459-2473.
About this article

The research is supported by the National Natural Science Foundation of China under Grant No. 51775212 and 51505084. The authors are grateful to other participants of the project for their cooperation.
Dr. Xuchu Jiang performed the data analyses, wrote and revised the manuscript. Professor Bin Li conceived and designed the experiments in the third section, he played an important role in interpreting the results. Dr. Songping He performed the experiments in the fourth section and approved the final version. Professor Xinyong Mao analyzed the data, and he contributed significantly to analysis and manuscript preparation. Professor Wei Jiang helped perform the analysis with constructive discussions.
