Abstract
Under high-frequency reciprocating operation, the dynamics of the sorting arm are different between operating status and standstill status. First of all, the energy of inertial impact and frequency band depend on the actual motion state, which are closely related to the dynamics of the arm structure. Secondly, during the high-frequency reciprocating operation, the positions of sorting arm change, which causes its configurations changes. At the same time, the acceleration and deceleration in each stage of operation are also inconsistent. These factors make the vibration of the sorting arm structure more complicated. Therefore, the dynamics of the sorting arm mechanism must be analyzed under the actual operating conditions. The paper takes the sorting arm of LED chip sorter as the research object, and it is pointed out that the sorting arm structure has the characteristics of multi-mode high-low frequency during operation. However, the structural configurations and operating parameters of the sorting arm are the main influencing factors of its vibration, which have different characteristics of the high-low frequency response. In this paper, the use of sequential sub-section design to determine the configurations and the corresponding time-series during the operation. Through the analysis of multi-mode frequency response of the sorting arm, the characteristics of high-low frequency range corresponding to the two kind of work excitation are obtained. This paper verifies that the dynamics of the sorting arm are affected by the excitation of structural configurations and the excitation of operating speed during high-speed operation. The laws of high-low frequency response of the sorting arm under different operation parameters and configurations are found out, which provides guidance for the vibration suppression of the sorting arm under operation.
Highlights
- It is pointed out that the sorting arm structure has the characteristics of multi-mode high-low frequency during operation.
- The structural configurations and operating parameters of the sorting arm are the main influencing factors of its vibration, which have different characteristics of the high-low frequency response.
- This paper verifies that the dynamics of the sorting arm are affected by the excitation of structural configurations and the excitation of operating speed during high-speed operation.
1. Introduction
At present, in order to obtain the dynamics of the mechanism vibration system, the analysis method of the dynamic characteristics of the operational structure has not been calculated with the required accuracy in the model. The main reason is that the complex stiffness and damping characteristics between the structural joints cannot be fully determined, and these characteristics have an important impact on the dynamics of the whole machine. In the study of viscoelastic properties of cast iron joint, Liu P. F., found that more than half of the total flexibility of the whole machine comes from the flexibility of the joint surface, and almost all of the total damping of the whole machine comes from the damping of the joint part [1]. Therefore, the study of the structural dynamics needs to rely on the model test under the actual working conditions. At present, the experimental modal analysis method is usually used to identify the structural modal parameters. The method has the following characteristics: (1) the modal parameters of the structure under non-working conditions will not change with time; (2) the excitation force and response of the structure are measured by artificial excitation; (3) the modal parameters are identified by the frequency response function to analyze the structural dynamics [2, 3]. However, the relative motion between the structural components makes the boundary conditions between the joints change constantly, which inevitably affects the dynamics. Weck M. obtained the resonance amplitude of milling machine’s slide plate under working condition and static state, and He found that the resonance amplitude under working condition was increased by about 30 % compared with that under static state [4]. Li B found that with the change of machine tool operating parameters, the spindle speed and position of machine tool will changes of its dynamics [5].
There is a big deviation between the dynamics identified by the traditional experimental modal experiment and the actual working state, because the hammering excitation cannot simulate the real working excitation. It is easier to obtain the structural vibration response under the actual processing state of the mechanism [6]. Therefore, the methods of collecting and analyzing structural vibration response under processing state have been widely developed, and many methods have been gradually derived [7, 8]. Symens W believes that the interaction between structural components under high-frequency operation leads to flexible characteristics and time-varying boundary conditions, resulting in the modal parameters being quite different from those under static conditions [9]. Spiridonakos MD studies the simply supported beam with movable mass, and obtains the dynamics of time-varying steel beam with mass block at different speeds by analyzing the vibration response [10]. In view of the time-varying characteristics of the operating mechanism, some common time-varying structural identification methods have appeared, such as short-time Fourier transform [11], wavelet transform [12], ARMA model [13], Wigner distribution [14]. Zhou SD has also made some achievements in the identification of time-varying structural modal parameters [15]. In a word, the research on accurate identification of modal parameters of time-varying structures is still in the primary stage. The current method generally assumes that the time-varying structure is equivalent to a linear time invariant structure in a short period of time, and then the modal parameters are identified [16].
Considering the shortcomings of the above-mentioned methods, the main factors that affect the vibration of the rotating arm during operation are be discussed, which combines the strain modal analysis method and OMA method. This paper provides guidance for the vibration suppression of the sorting arm under operation. The main purpose of the study is (i) to analyze the factors that affect the vibration of the rotating arm during operation and (ii) to study the influence of structural configurations on the dynamics of sorting arm and to (iii) study the influence of operating parameters on the dynamics of sorting arm.
The paper is organized as follows. In Section 2, the main factors that affect the vibration of the rotating arm under operation are discussed. In Section 3, the influence of structural configurations on the dynamics is studied. In Section 4, the influence of operating parameters on the dynamics is analyzed. In Section 5, a conclusion from the current research is presented.
2. Vibration analysis of sorting arm under high-frequency reciprocating motion
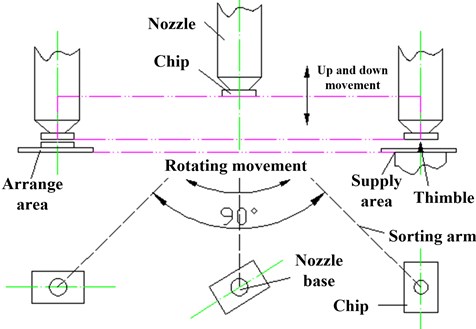
The study shows that the dynamics of the arm’s end are related to the operation process. The operating frequency of the sorting arm is 10 Hz, which means that the 10 pick-up chips action are done in one second. The movement of the 180° rotation and the up-and-down movement of 1.5 mm are carried out under the high frequency reciprocating motion. The instantaneous acceleration of each part is large, and the strenuous vibration of the sorting arm is caused by the inertia impact during the operation, which directly affects the sorting accuracy of chips. Fig. 1(a) shows the specific motion process of sorting arm. In order to reduce the impact of the swinging arm vibration on the chips pickup and placement process, a certain stable time period should be reserved to attenuate the vibration response at the arm’s end. Fig. 1(b) presents the sorting cycle of chips.
Considering the influence of the working sequence related to the up-and-down movement and operation process, the dynamics of the sorting arm is analyzed from the two points under the high frequency reciprocating operation.
(i) Influence of structural configurations on the dynamics of sorting arm.
(ii) Influence of operating parameters on the dynamics of sorting arm.
Fig. 1a) Motion process diagram, b) the sorting cycle of chips
a)
b)
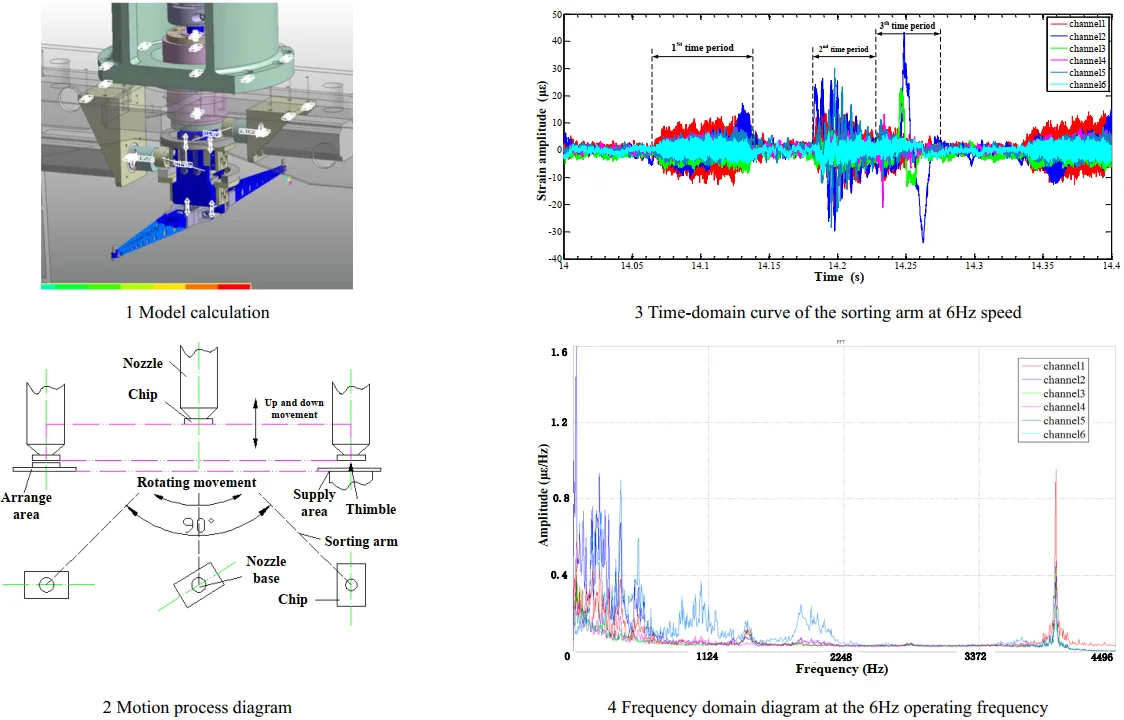
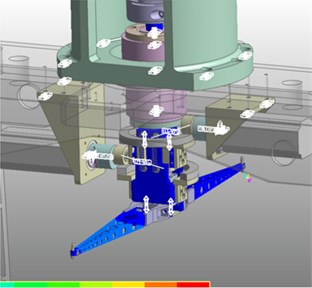
In order to analyze the relationship between the structure and the vibration response of the sorting arm, the finite element analysis (FEA) of the sorting arm mechanism is carried out. The highest position in the process of ascending and descending and the position of the contact chips are selected to analyze the influence of structural configuration on the dynamics of sorting arm.
There is a difference of 1.5 mm between these two locations. As shown in Fig. 2(a), the arm, the arm connector and the arc guide are moved together in the process of up-and-down movement. The mass distribution of the sorting arm mechanism changes because of their position changes. As a result, the dynamics of the sorting arm mechanism are different in the above two positions. Therefore, there is a relationship between swinging vibration response and position.
The multi-body model of the LED sorter sorting arm mechanism is established. The sorting arm is analyzed in the two positions mentioned above. The model calculation results are shown in Fig. 2(b). The simulation results show that the limit position of up-and-down is too small (1.5 mm). The influence of structural configuration on the dynamics of sorting arm cannot be reflected by the model. Therefore, the dynamics of the sorting arm under different configurations are studied based on the method of experimental modal analysis (EMA) method and operational modal analysis (OMA).
Fig. 2a) Positions of sorting arm, b) model calculation
a)
b)
3. Analysis the influence of structural configurations on the dynamics of sorting arm.
3.1. Non-steady characteristics
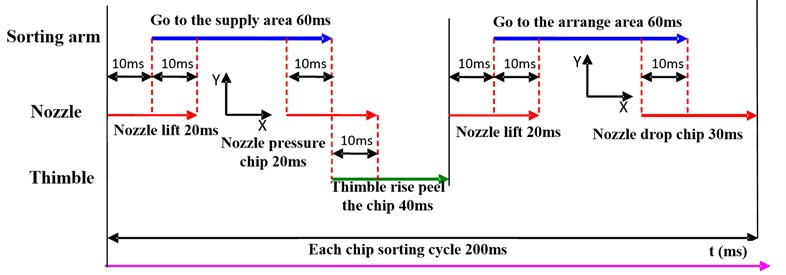
The topological structure of the sorting arm varies in three different positions continuously under the high frequency reciprocating operation. There are two forms of non-touch and contact state between the nozzle and the chip blue film when the sorting arm is in the contact position of the chip. The vibration response of the sorting arm is complicated by the above factors.
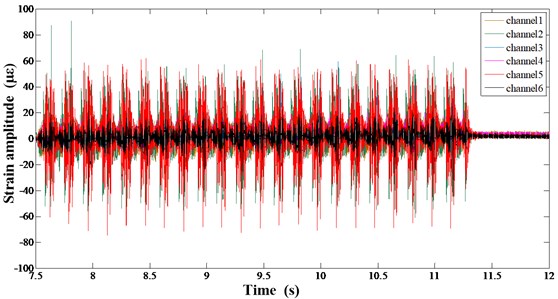
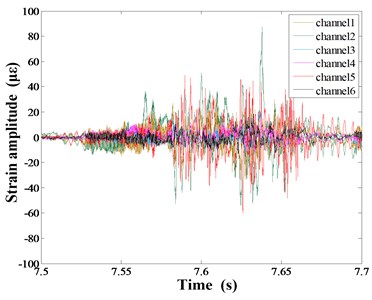
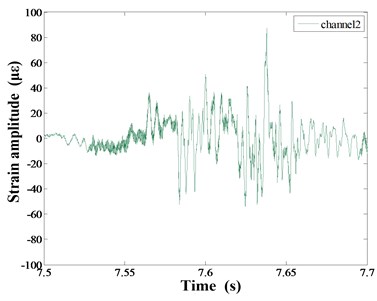
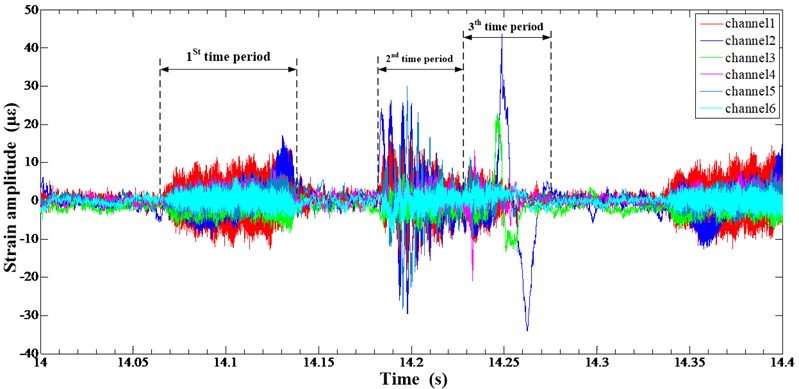
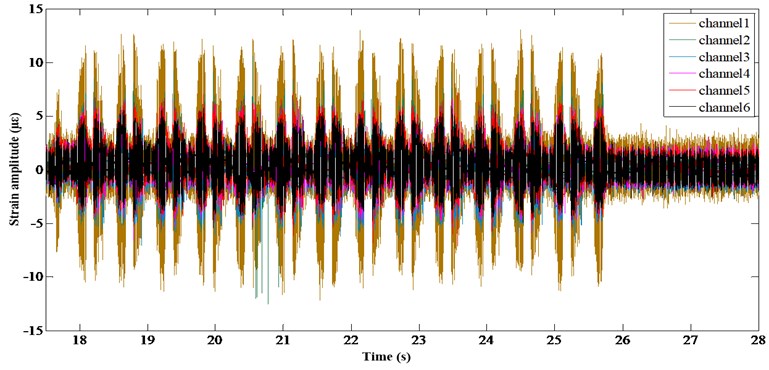
Fig. 3a) Global strain response time domain curve, b) a periodic strain response time domain curve of Channel 1-6, c) strain response time domain curve of Channel 2
a)
b)
c)
Fig. 3(a) presents the strain time-domain curve of the sorting arm under 6 Hz speed. Fig. 3(b) shows the time-domain signal of 6 measurement points in the place of pick-up and pick-down of chips links during the sorting process. Among them, Fig. 3(c) is the time-domain curve of point 2.
Since the position of the sorting arm changes in the working process, the response of the structure is complex under the operation. The inertia excitation caused by different working frequencies will lead to the change of the dynamics of the sorting arm. Therefore, the power spectrum analysis (PSD) analysis of the sorting arm is carried out at the different working frequencies. Two working frequencies of 6 Hz and 10 Hz are selected, (that is, the rotation frequency is 6 times per second and 10 times per second respectively), and the location of the structure is in the same position as the above.
Fig. 4Non-steady state characteristics under operation: a) structural response analysis at 6 Hz speed, b) structural response analysis at 10 Hz speed
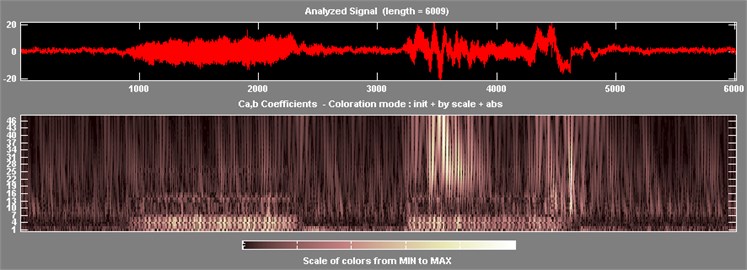
a)
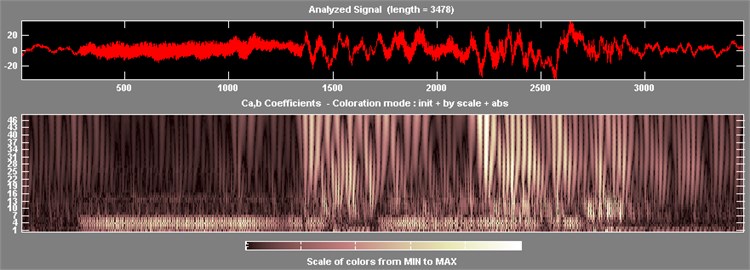
b)
Fig. 4 shows the results of the wavelet analysis of structural strain responses at two operating frequencies. Fig. 4(a) is the result of 6 Hz working frequency, and Figure 4b is the result of 10 Hz working frequency. Fig. 4 shows that the frequency components of pickup and placement are changed. When the position of sorting arm structure changes, the peaks of response spectrum are changed. The peak of response spectrum varies with different working frequency. Therefore, it is known that the steady state characteristics of the structural response are not significant during the pickup and placement of the chips. Its configuration changes when the position of sorting arm changes in different time series, and the response characteristics change obviously.
Due to the unsteady signal characteristics of sorting arm under the high frequency reciprocation, so the timing design of chip sorting works by means of signal processing with time division, which provides an effective method for the vibration suppression.
3.2. Position-dependent vibration analysis
Firstly, it is necessary to analyze the time series of the arm, and then study the influence of structural configurations on the dynamics of sorting arm. From the time series diagram, the structural configurations change at all critical moments in the time series, and the characteristics of unsteady state exist in the structural strain signal. Therefore, it is necessary to segment the response signal according to the time sequence, and each time sequence corresponds to different configurations, so as to get the response spectrum of the sorting arm structure under different configurations.
Fig. 5Time-domain curve of the sorting arm at 6 Hz speed
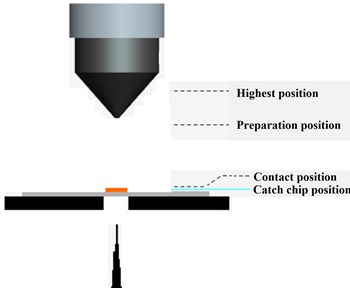
According to the working sequence of sorting arm, the strain response time domain signal is segmented in the Fig. 5, and then the PSD of the strain response signal at different time sequence is carried out. The period selection criteria are as follows: first time series section corresponds to the rotation process at the highest position, which is used to analyze the characteristics of the sorting arm under the rotating impact. The second period corresponds to the highest position before and after the process which is used to analyze the dynamics of the sorting arm. During the third period, the sorting arm descends from the highest position to the contact position for analyzing the dynamics during descending. Fig. 6(a) shows the strain measurement point arrangement, and the sampling rate is set to 25 KHz.
Fig. 6a) Strain measurement point arrangement, b) frequency domain diagram at the 6 Hz operating frequency
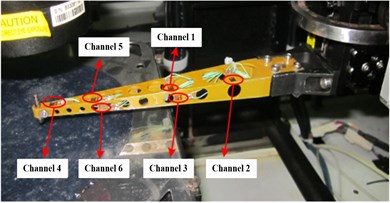
a)
b)
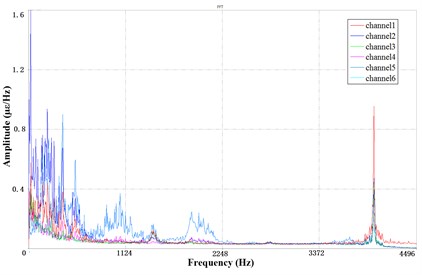
Fig. 5 is the time-domain diagram at the 6 Hz operating frequency and the corresponding PSD is shown in Fig. 6(b). The high-frequency characteristics of sorting arm parts under operation are different from the static state. The corresponding PSD of the static is smooth and the peak value is not significant. However, the peak value in high-frequency of the sorting arm is quite significant under the operation, which is equivalent to the low-frequency amplitude. At the same time, there are more peaks in the PSD of the sorting arm under operation. Therefore, the peak in low frequency of the sorting arm not only needs to be considered, but also the peak of high frequency needs to take into account. The response in low-frequency of the sorting arm is in agreement with the static. The low-frequency response of channel 2, which measures the transverse vibration of the sorting arm, is also significant under the operation. The low-frequency vibration is sensitive to the direction of the rotation.
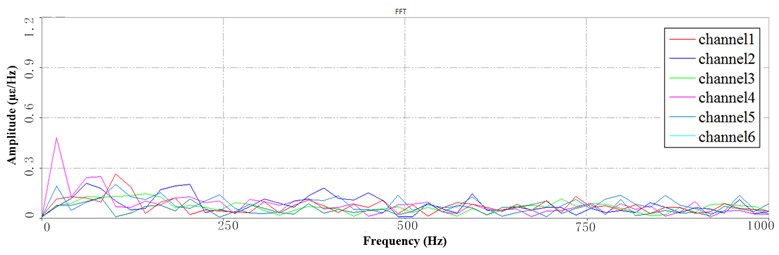
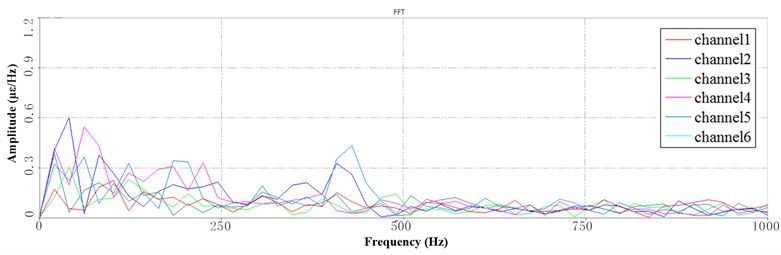
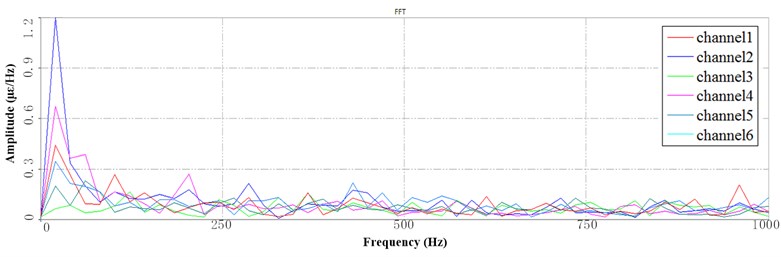
Fig. 7Segment PSD at 6 Hz speed: a) the 1st PSD, b) the 2nd PSD, c) the 3rd PSD
a)
b)
c)
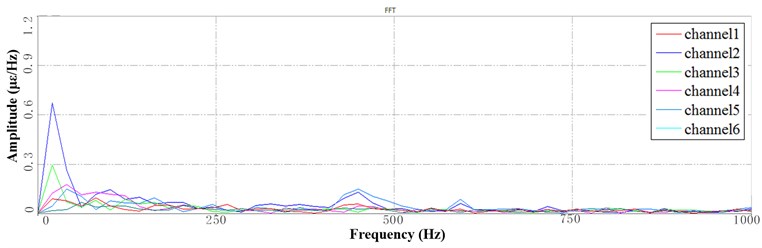
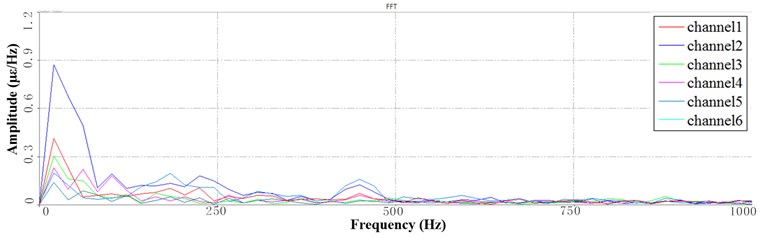
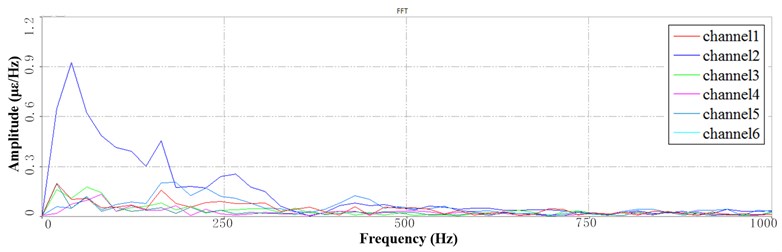
The corresponding working sequence is processed in different time segments. Fig. 7 shows the sub-band PSD of the sorting arm at 6 Hz frequency. Different times correspond to the different positions of the sorting arm structure. As shown in Fig. 7(a), the first period indicates that the sorting arm structure is in the upper limit position. As shown in Fig. 7(b), the second time means that the sorting arm structure is in the lower limit position. As shown in Fig. 7(c), the third period indicates that the arm contacts the chips. Comparing the three states shows that when the structure changes, the vibration energy changes in frequency domain. The following conclusions can be obtained. When the sorting arm in the highest position, the vibration energy is concentrated in the low frequency range of 0-50 Hz. When the sorting arm is in the contact position, the vibration energy of the sorting arm is not only concentrated in the low frequency range of 0-100 Hz, but also distributed in the frequency range of 100-200 Hz. When the sorting arm is in contact with the chips, the vibration energy of the sorting arm is more widely distributed, and more energy distribution exists in the range of 300 Hz to 500 Hz. The above analysis shows that, the vibration frequency of the sorting arm structure is distributed more widely as the position changes.
4. Analysis the influence of operating parameters on the dynamics of sorting arm.
The operating status of the sorting arm is mainly determined by the chips sorting frequency. When the sorting frequency is set to higher, the operating speed of each component is faster, and the acceleration impact force during rotation and lifting is larger, further causing the change of sorting arm structural dynamics, and affecting the sorting accuracy. In order to analyze the influence of the sorting frequency on the dynamics of the swing arm structure, this section analyzes the vibration characteristics of the swing arm under the rotation speed of 3 Hz, 6 Hz and 10 Hz respectively.
This section will separately analyze the low-frequency characteristics and high-frequency characteristics of the sorting arm mechanism under different operating parameters. The analysis is divided into two parts: the low-frequency band (LFB) and the high-frequency band (HFB). The former is within 1000 Hz, the latter is above 1000 Hz.
4.1. Vibration analysis under low-frequency band
Fig. 8 is the strain time-domain diagram of the sorting arm at the operating speed of 3 Hz. Among them, channel1-channel6 are corresponding to the No. 1-6 strain gauges.
Fig. 8Time domain diagram at the 3 Hz operating frequency
According to the working sequence, the time-domain is processed in different periods to obtain the PSD under different operating speed. Fig. 9 shows the segmentation PSD at 3 Hz operating speed. The dynamics of each frequency band under different working sequences can be more clearly reflected by using the time-division processing method. The PSD analysis results of full-time cannot reflect the dynamics related to this process.
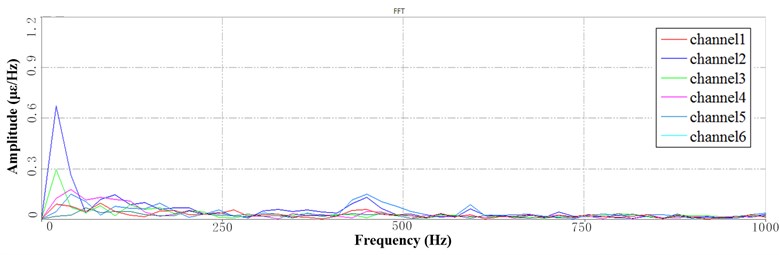
It can be seen from Fig. 9 that the channel 2 of the sorting arm’s root has a significant peak at 12 Hz under LFB, which indicates that the transverse vibration appears on the sorting arm in the direction of rotation. The amplitude of this frequency band gradually increases with the time-series backward, but the overall amplitude is still relatively small. The sorting arm begins to decline when the it rotates above the chips. There is a significant peak in channel 4 which located at the front of the sorting arm, which indicates the up-down vibration of the sorting arm. In the process of picking up the chips, although the arm is lowered by a short distance of 5 mm, which can still cause the vibration response in the up-down direction. For the three periods, the peaks at higher frequencies are not significant in the LFB, which can be considered that the higher frequency components of static state in the LFB are not effectively motivated in the low working speed.
Fig. 9Segment PSD at LFB under 3 Hz speed: a) the 1st PSD, b) the 2nd PSD, c) the 3rd PSD
a)
b)
c)
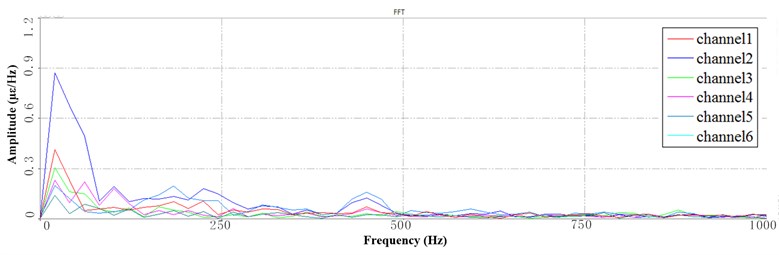
Fig. 10 shows the PSD of LFB at the 6Hz speed which is based on the segmentation of the time series. Fig. 10(a) shows that during the rotation movement, the peak of the LFB of the channel 2 is significant which located at the root of the sorting arm, which indicates that the obvious lateral vibration appears in the rotation process. Compared with Fig. 9(a), the peak trend is close to that of 3 Hz speed, but the corresponding amplitude is different from that of 3 Hz speed. The first peak in the Fig. 10(a) is 5 times of the second peak, which indicates that the mode shape represented by the peak is very sensitive to the operating speed. The mode is easily affected by impact in the direction of rotation. Fig. 10(b) shows the PSD corresponding to the descending working sequence. There is no significant peak in the channel 4 which locates at the front end of the sorting arm. It indicates that the vibration in the up-and-down direction can be neglected at 6 Hz speed. There is no peak at the back of the LFB at 3 Hz operating speed, but there is a clear peak at 6 Hz speed. Fig. 10(c) shows that significant peaks occur in the back of the LFB. The peak of the channel 2 of the sorting arm is significant, and sharp peaks appear at 200 Hz, 240 Hz and 300 Hz. It indicates that the sorting arm is sensitive to the impact of rotational movement at the 6 Hz speed, while the vibration in the direction has a great influence on the working accuracy.
Fig. 10Segment PSD at LFB under 6 Hz speed: a) the 1st PSD, b) the 2nd PSD, c) the 3rd PSD
a)
b)
c)
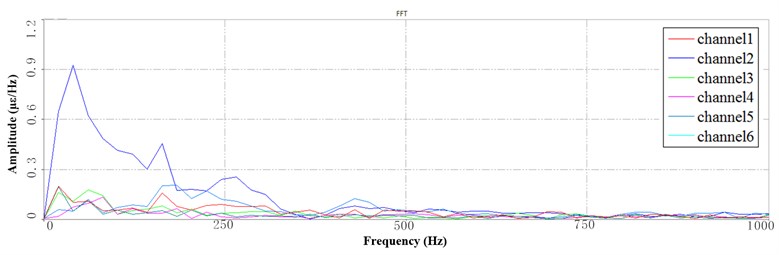
Fig. 11 shows the PSD of LFB at the 10 Hz speed which is based the segmentation of the time series. Fig. 11(a) shows the PSD corresponding to the rotation process, in which the peaks are dense and the amplitude is larger, but most of the frequencies rapidly decay in the subsequent period. The peak values of these attenuation lines are still larger than those of 3 Hz and 6 Hz speed. Fig. 11(b) shows the PSD corresponding to the process of up-down, in which the peak of the channel 5 located root and the channel 2 located are significant. The channel 2 measures the lateral vibration of the sorting arm, and the channel 5 measures the up-down vibration of the sorting arm. The multi-mode vibration frequency occurs in the lateral vibration of the sorting arm, such as the three frequencies near the 10 Hz, 200 Hz and 300 Hz. Fig. 11(c) shows the 3rd period of PSD, the frequencies of which remain unchanged. The frequency of peak is significant whose amplitude decay. However, the peak value of each frequency is about 2 times larger than the 6 Hz speed.
Fig. 11Segment PSD at LFB under 10 Hz speed: a) the 1st PSD, b) the 2nd PSD, c) the 3rd PSD
a)
b)
c)
4.2. Vibration analysis under high-frequency band
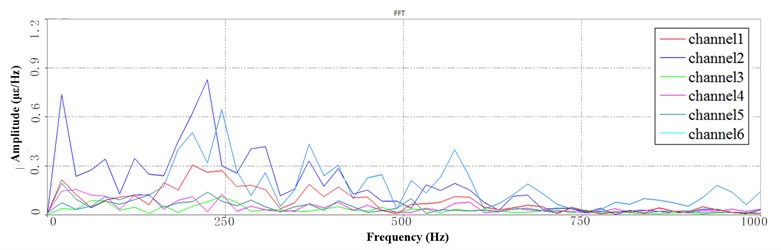
Fig. 12 shows the PSD of HFB at the 3 Hz speed which is based the segmentation of the time series. The peak value of channel 1 is significant which indicates that the lateral vibration of sorting arm is obvious under rotational motion, but this amplitude decreases after that.
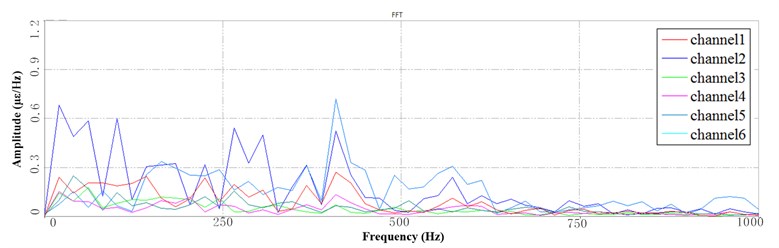
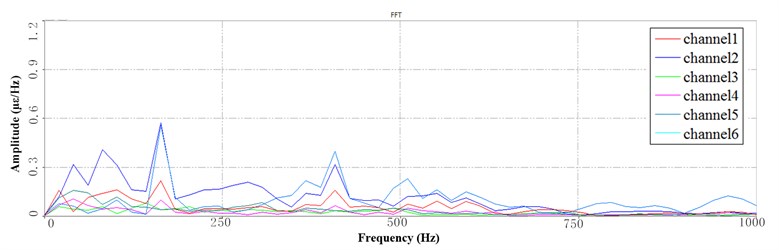
Fig. 13 shows the PSD of HRB at the 6 Hz speed which is based the segmentation of the time series. Since the trend of the spectral lines is similar at each time under the 6 Hz speed, only the PSD of the first and the third periods are presented. In the same way, the trend of the spectral lines is similar at each time under the 10 Hz speed, so only the PSD of the third periods are presented.
Fig. 12PSD at HFB under 3 Hz speed: a) the 1st PSD, b) the 2nd PSD, c) the 3rd PSD
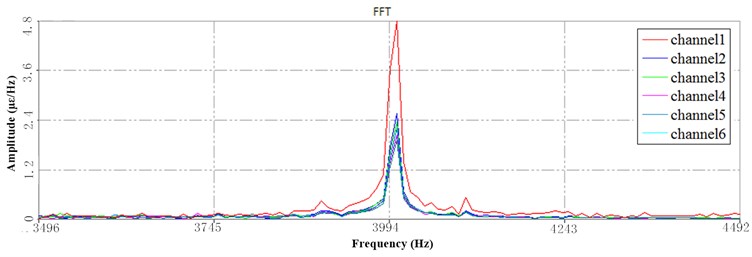
a)
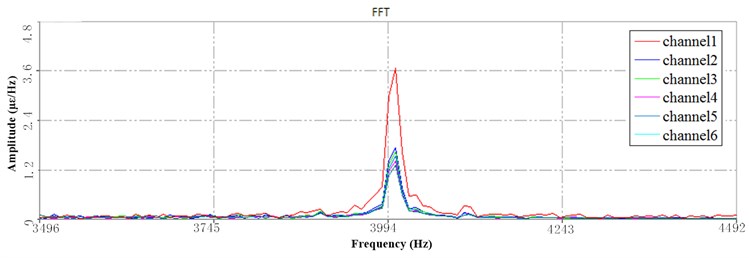
b)
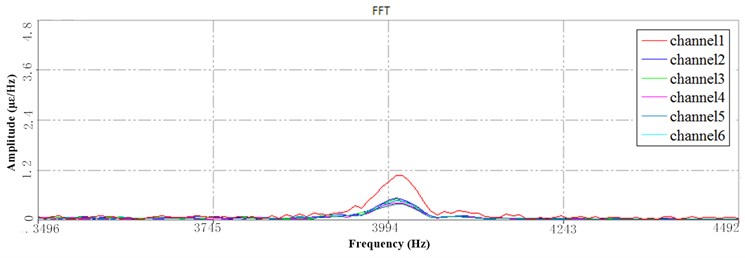
c)
Compared with the PSD of HFB at 3Hz speed, there are differences between the peak values at 6 Hz and 10 Hz, as shown in Fig. 13.
Fig. 13a) The 1st PSD at HFB under 6 Hz speed, b) the 3rd PSD at HFB under 6 Hz speed, c) The 3rd PSD at HFB under 10 Hz speed
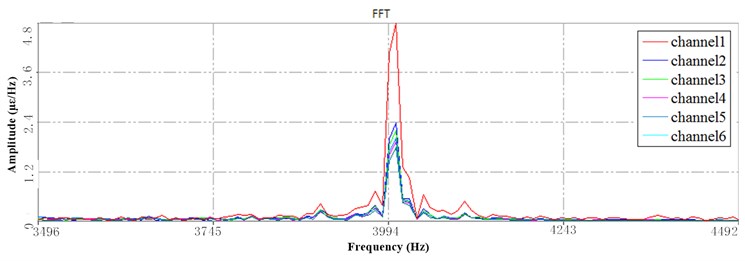
a)
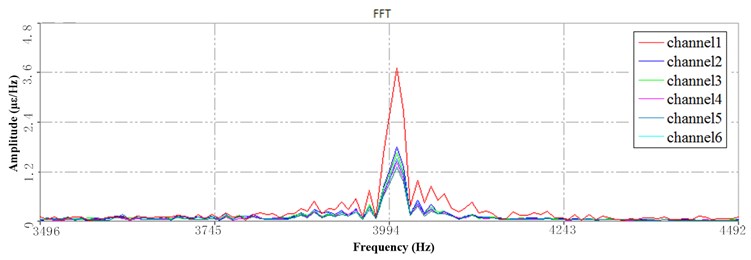
b)
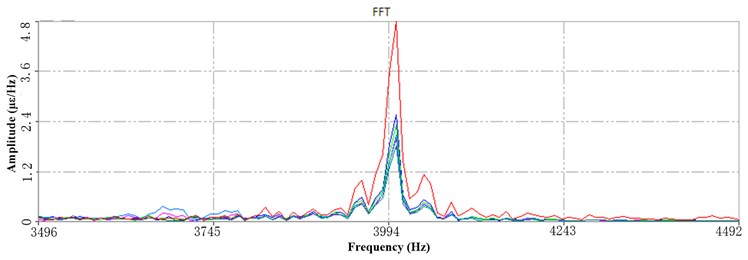
c)
Under 6 Hz (Fig. 13(a, b)) and 10 Hz (Fig. 13(c)) speed, the peak amplitude of the high-frequency response spectrum in the three periods remained the same, the frequency remained the same, and the relative changes of the strain at each point were basically the same. Therefore, it can be seen that the high-frequency response corresponds to the higher working speed during, and the change of the dynamics is no longer obvious when the operating speed is above 6 Hz. The different configurations have no significant effect on the dynamics of sorting arm.
5. Conclusions
The paper takes the sorting arm of LED chip sorter as the research object, and it is pointed out that the sorting arm structure has the characteristics of multi-mode high-low frequency during operation. However, the structural configurations and operating parameters of the sorting arm are the main influencing factors of its vibration, which have different characteristics of the high-low frequency response. In this paper, the use of sequential sub-section design to determine the configurations and the corresponding time-series during the operation. Through the analysis of multi-mode frequency response of the sorting arm, the characteristics of high-low frequency range corresponding to the two kind of work excitation are obtained. This paper verifies that the dynamics of the sorting arm are affected by the excitation of structural configurations and the excitation of operating speed during high-speed operation. The laws of high-low frequency response of the sorting arm under different operation parameters and configurations are found out, which provides guidance for the vibration suppression of the sorting arm under operation.
References
-
Liu P. F., Peng X. Q., Guo Z. Y., et al. Viscoelastic bilinear cohesive model and parameter identification for failure analysis of adhesive composite joints. Composite Structures, Vol. 224, 2019, p. 111016.
-
Bąk P. A., Jemielniak K. Automatic experimental modal analysis of milling machine tool spindles. Proceedings of the Institution of Mechanical Engineers, Part B: Journal of Engineering Manufacture, Vol. 230, Issue 9, 2016, p. 1673-1683.
-
Maia N. M. M., Silva J. M. M. Modal analysis identification techniques. Philosophical Transactions of the Royal Society of London. Series A: Mathematical, Physical and Engineering Sciences, Vol. 359, Issue 1778, 2001, p. 29-40.
-
Weck M., Teipel K. Dynamisches Verhalten spanender Werkzeugmaschinen: Einflußgrößen, Beurteilungsverfahren, Meßtechnik. Springer, 1977.
-
Li B., Cai H., Mao X., Huang J., Luo B. Estimation of CNC machine-tool dynamic parameters based on random cutting excitation through operational modal analysis. International Journal of Machine Tools and Manufacture, Vol. 71, 2013, p. 26-40.
-
Hung J. P., Lai Y. L., Lin C. Y., et al. Modeling the machining stability of a vertical milling machine under the influence of the preloaded linear guide. International Journal of Machine Tools and Manufacture, Vol. 51, Issue 9, 2011, p. 731-739.
-
Devriendt C., De Sitter G., Vanlanduit S., et al. Operational modal analysis in the presence of harmonic excitations by the use of transmissibility measurements. Mechanical Systems and Signal Processing, Vol. 23, Issue 3, 2009, p. 621-635.
-
Devriendt C., Steenackers G., De Sitter G., et al. From operating deflection shapes towards mode shapes using transmissibility measurements. Mechanical Systems and Signal Processing, Vol. 24, Issue 3, 2010, p. 665-677.
-
Symens W., Van Brussel H., Swevers J. Gain-scheduling control of machine tools with varying structural flexibility. CIRP Annals-Manufacturing Technology, Vol. 53, Issue 1, 2004, p. 321-324.
-
Spiridonakos M. D., Fassois S. D. Parametric identification of a time-varying structure based on vector vibration response measurements. Mechanical Systems and Signal Processing, Vol. 23, Issue 6, 2009, p. 2029-2048.
-
Satpathi K., Yeap Y. M., Ukil A., et al. Short-time Fourier transform based transient analysis of VSC interfaced point-to-point dc system. IEEE Transactions on Industrial Electronics, Vol. 65, Issue 5, 2017, p. 4080-4091.
-
Chen J., Li Z., Pan J., et al. Wavelet transform based on inner product in fault diagnosis of rotating machinery: a review. Mechanical Systems and Signal Processing, Vol. 70, 2016, p. 1-35.
-
Yuan C., Liu S., Fang Z. Comparison of China's primary energy consumption forecasting by using ARIMA (the autoregressive integrated moving average) model and GM (1,1) model. Energy, Vol. 100, 2016, p. 384-390.
-
Pachori R. B., Nishad A. Cross-terms reduction in the Wigner-Ville distribution using tunable-Q wavelet transform. Signal Processing, Vol. 120, 2016, p. 288-304.
-
Zhou S. D., Ma Y. C., Liu L., et al. Output-only modal parameter estimator of linear time-varying structural systems based on vector TAR model and least squares support vector machine. Mechanical Systems and Signal Processing, Vol. 98, 2018, p. 722-755.
-
Ljung L. Estimating linear time-invariant models of nonlinear time-varying systems. European Journal of Control, Vol. 7, Issues 2-3, 2001, p. 203-219.
About this article

The research is supported by the Natural Science Foundation of Hubei Province, China (Grant No. 2020CFB180), and supported by “the Fundamental Research Funds for the Central Universities”, Zhongnan University of Economics and Law (Grant No. 2722020SQY16, No. 2722021BZ036), and supported by the Teaching Research Project of Zhongnan University of Economics and Law (Grant No. YB202065). The authors are grateful to other participants of the project for their cooperation.
