Abstract
Damping Loss Factor (DLF) is an important input parameter in Statistical Energy Analysis (SEA) simulations, therefore its accurate determination via measurement is crucial from simulation accuracy point of view. This paper presents a methodology for the accurate measurement of DLF via the Half Power Bandwidth Method (HPBM) for three test cases: a) a rectangular steel plate, b) the same plate with viscoelastic bitumen sheets imposed on the middle of plate and c) the same plate with the viscoelastic bitumen sheets placed randomly. The aim of the different bitumen layer applications was to develop a methodology for representing them in Statistical Energy Analysis, since this simulation technique takes into account only the coverage of the damping layers but not their distribution over a panel. Measurement of the DLF in random locations on the plate gave the appropriate parameters for the simulation. Measurement results were then applied in SEA simulations, which showed good agreement with the experimental results in all test cases, with the maximum difference of only 2 dB.
1. Introduction
In NVH (Noise, Vibration, Harshness) development, one of the most important fields is the accurate determination of the Damping Loss Factor (DLF) since this serves as an input parameter for simulations. Typically, users can determine the value of the Damping Loss Factor either from the database of the applied simulation software, experimentally from measurements, or from look up tables. The most accurate way to evaluate the DLF for a given structure is to calculate it from data obtained from measurements [1]. Petrik et al. [2] measured the DLF of a plywood plate with the Decay Rate Method (DRM), while Iwaniec [3] – also using the same method - measured it for various materials, such as steel, brass, plexiglass and aluminium plates. On the other hand, Mandale et al. [4] and Jadhav and Desia [5] determined the damping loss factor by the Half Power Bandwidth Method (HPBM) for plate structures. Some other authors focussed on comparing the various DLF measurement techniques to each other. For example, Bustamante et al. [6] examined the DLFs of steel and aluminium plates as well as beams by HPBM and Power Injection Method (PIM). Cherif et al. [7] identified the DLF of aluminium and composite plates not only by the HPBM, DRM and Power Injection Method, but also by the Inverse Wave Correlation Method as well. Seçgin [8] estimated the Statistical Energy Analysis (SEA) parameters of point connected, directly coupled, symmetrically laminated composite plates via a modal-based methodology and employed PIM to calculate the CLFs between the plates. In another work, Seçgin et al. [9] determined the loss factors of different types of connections between composite plates, such as point-connected, right-angle and T shape connections. They obtained the in-situ energy loss by using numerical and experimental PIM. Seçgin et al. [10] investigated these parameters for the different connection types from another aspect, such as the effect of the local mass variability, to simulate the uncertainty of the structure. With this methodology, the authors improved the classical SEA in the mid-frequency range for complex systems.
In the vehicle and aircraft industry, the application of damping layers is one of the most efficient ways to find the optimal balance between noise reduction and added mass. Noise reduction is crucial from customer satisfaction point of view, while the added mass increases the weight of the vehicle, which consequence can be the increase of CO2-emission. Since this is an important field in the industry, numerous papers have investigated constrained and unconstrained damping layers. Wodtke and Lamancusa [11] optimized the distribution of an unconstrained damping layer for a circular plate, with the goal to reduce the radiated sound power for a given frequency band. Ege et al. [12] have achieved good results in the determination of the frequency dependent complex modulus of a polymer core layer, in a three-layered sandwich composite plate. Arenas and Hornig [13] applied an unconstrained damping layer onto a rectangular plate and estimated the sound power radiation numerically. Beldar and Kushare [14] compared the DLFs of different beams, such as that of undamped free-layer beams, and they applied different damping materials on the structure, and made comparisons of FEM results with experiments. Fan et al. [15] developed and measured new damping materials (e.g. bitumen-based, water-based as well as butyl rubber) for railway carriages. They applied these materials in free-layer and constrained-layer form too. They have proposed that the measure of loudness should be used to assess reduction effect. Sanliturk [16] developed a multi-layered isotropic composite finite element method to assess its damping capability. Cherkasov et al. [17] examined the damping of sandwich beams of two steel sheets, connected by self-adhesive bitumen-rubber mastic. They focused on investigating the effect of the thickness of the viscoelastic layer as well as the temperature change to the damping properties in the –40°C to +80°C temperature range. Ruijiao et al. [18] inspected a full vehicle case with SEA and examined the influence of various parameters on the results, such as that of the leakage, the loss factors and the acoustic materials. Consequenty, all of these parameters directly affected the simulation results. Yanninan et al. [19] investigated a Fiber Reinforced Plastics (FRP) material for yachts and accessed its loss factors by PIM and impulse response decay method (IRDM). The results showed that for FRP plates, the PIM is a better way to calculate the loss factor.
Representation of the damping effects of bitumen layers – especially those, which are not covering the full structure and their distribution is somewhat random – in Statistical Energy Analysis (SEA) methods is not trivial, since the SEA methods do not allow local representation of damping effects. Therefore, the goal of this work is to develop a methodology for the representation of the partial coverage of damping layers in SEA simulations. Specifically, the paper aims to present a method for the accurate measurement of DLF’s for structures with partial cover of bitumen layers, and then to implement these results in an SEA simulation. The work is aimed to develop the method on an academic case, i.e. on a lightly damped flat plate.
2. Measurement setup
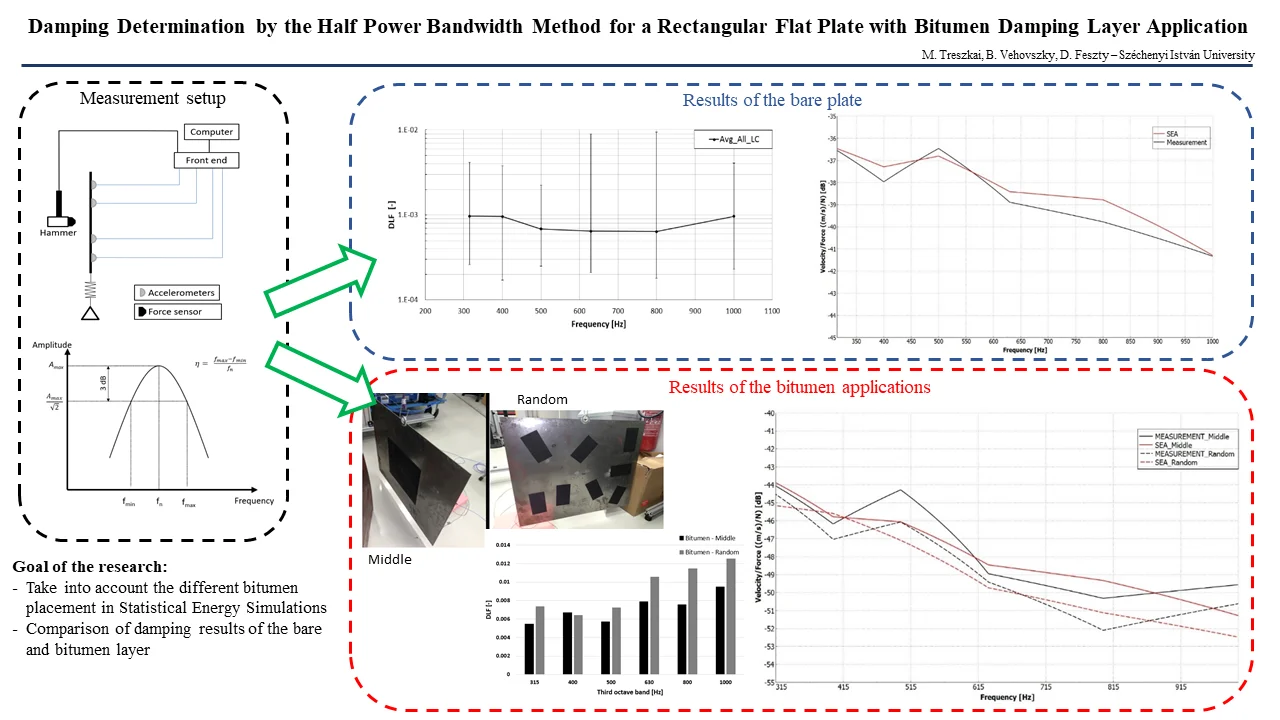
In this section, the impact measurement set-up will be introduced. The considered test case was a rectangular steel plate of 650×550×2 mm size. Theoretically, all modes should be excited to get the correct DLF of a structure, and for this reason, 16 randomly located response points were introduced and 3 load cases applied. The number of response points and load cases was adopted from a study [20], which aimed to identify the minimum number of response points and load cases, which one could consider as statistically representative for mid-frequency vibrations. In order to avoid too much added mass on the plate, only 4 accelerometers were used at any given time. Thus, one excitation point was measured four times. Hence, five channels were used, one for a force sensor and four for the accelerometers. Free-free boundary conditions were applied, and to ensure these, the plate was hanged on a bungee cord with silicone inserts. The investigated frequency range was the mid-frequency range (400 Hz-1 kHz), since it is a challenging, yet interesting range for many industrial sectors as well as since the SEA simulation method itself does not work below this range due to its very nature [1].
The source of the excitations was an impact hammer. Fig. 1 depicts the schematic diagram of the measurement setup.
Fig. 1Schematic diagram of the measurement system
Measurements were performed with the Siemens LMS measurement system. The response was measured by lightweight ICP accelerometer sensors (piezo-electric, B&K, Type 4519-003), weighing 1.5 grams each. The impact hammer was PCB Piezotronics (Model Number: 086C03), with hard rubber head.
The pre-trigger time was adjusted to ~0.02 s, and the trigger force was 20 N. The impact force spectrum was capable of up to 1.8 kHz frequency. The investigated frequency range was between 282-1122 Hz, since these are the lower and upper border of the investigated third octave bands (315-1000 Hz). The frequency resolution was 0.039 Hz during the bare plate measurement, while in the bitumen layer measurement cases it was 0.39 Hz. The damping was much higher when the damping layer was applied, thus the frequency resolution for these could be in principle higher. For a better overview of this relationship, the next section will discuss the link between the Half Power Bandwidth Method and the frequency resolution.
3. Damping determination
Statistical Energy Analysis method is based on the power balance equations between the subsystems. For one subsystem, the power injection can be expressed as Eq. (1):
where is the injected power into the subsystem, is the total energy of the subsystem, is the angular frequency, is the damping loss factor. As the equation shows, one of the most important parameters in SEA is the DLF value. There are several methods to obtain this value, such as experimental, analytical, or empirical data for simpler subsystems [1]. Three commonly used measurement process exist to determine it: the Decay Rate Method (DRM), the Half Power Bandwidth Method (HPBM), and the Power Injection Method (PIM). In this paper, the half power bandwidth method was used, due to its relative simplicity in comparison to the other two methods.
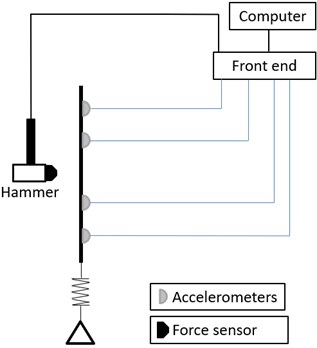
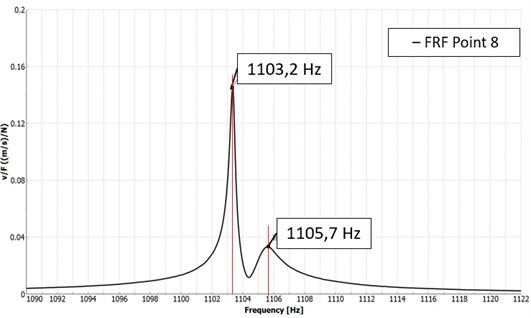
This method is based on the frequency response function (FRF) of one point, and it gives the damping value of a single mode. The method is also called 3 dB method, since the DLFs are calculated from the frequency spacing between the magnitude levels, where the magnitude levels decrease 3 dB compared to the peak level [21]. Fig. 2 shows how the damping is calculated from the FRF.
Fig. 2DLF determination from the resonance peak
As Fig. 2 illustrates, the frequency resolution has a great importance, especially for a lightly damped plate. The sampling frequency is related to the DLF. Eq. (2) gives the suggested number of sample points per channel [1]:
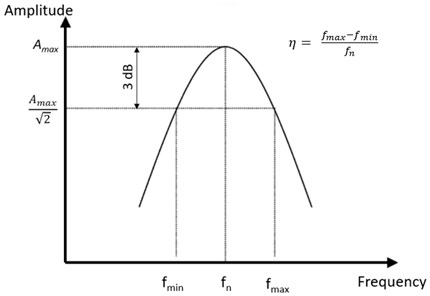
where is the number of sample points, and is the DLF value. The problem is that it is difficult to know a-priori the expected DLF value, so it might be required to perform a preliminary-measurement to check the Nyquist circle. If the frequency resolution is not satisfactory, the Nyquist-circle will be angular instead of circular. Fig. 3 represents a comparison of a fine frequency resolution of 0.039 Hz and of a coarse resolution case of 0.39 Hz.
Fig. 3Nyquist diagram for one resonance peak at 501 Hz. Green curve is the fine resolution (0.039 Hz), red curve is the coarse frequency resolution (0.39 Hz)
During the bare plate measurements, most of the DLF values were around 0.0008, which required 25,000 sample points. Therefore, in the measurements 32,000 spectral lines were used. Another limitation of the half power bandwidth method is the modal overlapping, which means that the method cannot be used if the modes are too close to each other. Eq. (3) gives the upper frequency, where the method is still useable [1]:
As Eq. (3) shows, the modal overlapping over a certain frequency makes this method unusable. This plate has some close peaks in the last third octave band (891-1122 Hz), but the method remained still valid for this plate. The highest frequency in the last band is 1122 Hz, and the averaged damping value in this band is 9.6e-4, so in this case the should be ~3.3 Hz. There were some peaks close to each other, the closest can be seen in Fig. 4. All other peaks had more distance between each other than the minimum required .
Fig. 4The closest peaks at the last third octave band. The ∆f between the neighbouring peaks is 2.5 Hz, while the ideal should be 3.2 Hz
4. Results of the bare plate
4.1. Damping loss factor
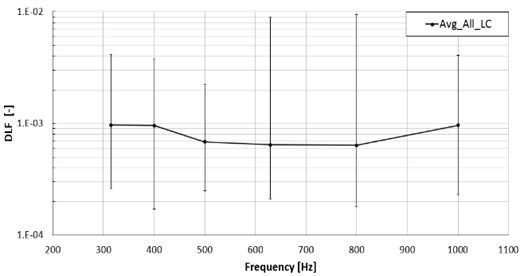
In SEA simulations, the DLF is an input parameter, which can be obtained either analytically, experimentally or from FEM simulations. In the current paper, that the DLF’s were obtained from measurements. Recall, that three different excitation points and 16 response points were used, so in total 48 FRF curves were investigated. From these curves the DLF values were calculated for each frequency band. Fig. 5 shows the average DLF values in every third octave band for the three load cases, along with deviations. As the diagram shows, the damping has a huge range where the DLF values could change e. g. at the 800 Hz band, the difference between the minimum and maximum values are almost two orders of magnitude. For this reason, the best DLF results are crucial from the accurate simulation point of view. The number of the samples are enough to characterize well the given frequency band, the 400 Hz third octave band included the smallest number of samples with 130 samples.
Fig. 5The average of DLFs and the maximum and minimum damping loss factor values. 16 response points were applied for each excitation, in all 3 impact positions
4.2. Statistical energy analysis simulation results
In essence, SEA is a high frequency method, which assumes high modal density. In this work, the mid-frequency range (355-1122 Hz) was considered for the analysis. Although, the method is generally suitable for flat plates, the particular structure examined in this paper was not the most ideal SEA subsystem, since it had quite low modal density in the mid-frequency range. In SEA, the main result is the average velocity of the subsystem, which was calculated from the kinetic energy of the subsystem in the following way [22]:
where is the kinetic energy, is the mass of the subsystem, and is the spatially averaged squared vibration velocity of the subsystem.
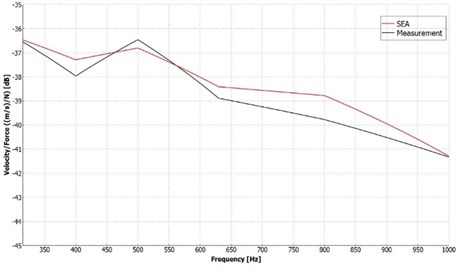
During the simulation, 1 N point force was applied as the excitation. Every important parameter was the same as on the real structure, such as the sizes, the mass as well as the material. The simulation was run with the mean values of the DLFs from HPBM. The measurement curve was obtained from the RMS average of all the response curves, and their third octave band averages were taken. The SEA simulation velocity results were compared to the measurement velocity results. Fig. 6 shows the simulation results compared to the experiment.
As can be seen, the results showed good agreement with the experiment. The maximum difference was around 1.3 dB at 630 Hz.
Fig. 6Results of the bare plate. Comparison of the velocity/force results for the simulation and measurement
5. Results for the bitumen damping layer application
5.1. Damping loss factor
In NVH, the noise level reduction is a key factor. One of the best ways to reduce the vibrational energy is to employ damping treatments on the component. The previous example was a bare plate with only slight damping, which can be enhanced by viscoelastic layers. In this section, a plate with damped layer will be investigated.
Free layer damping treatments effectively reduce the bending motions of the structure, since higher strain levels can be reached [1]. Fig. 7 shows a simple free layer damping treatment on a bare plate.
As Fig. 7 shows, the damping layer is placed away from the neutral axis of the base plate. For this reason, the higher strain level effectively reduces the bending motion of the plate and as a consequence the damping values will be higher. Eq. (5) represents the effective damping value of the free layer damping treatments for bending motion, when the stiffness of the damping layer is smaller, compared to the base plate () [1]:
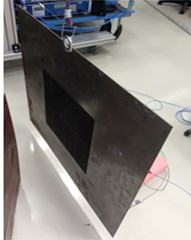
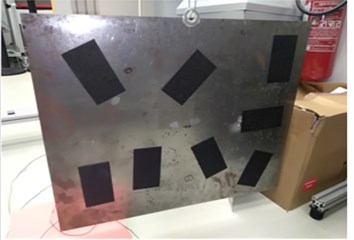
where is the damping loss factor of the base plate, is the damping loss factor of the damping material, , are the bending radius of gyration of the cross-section of the base plate and of the damping material, respectively. The value represents the distance between the neutral axis of the base plate and between the damping material. Since the bare plate results were promising, a bitumen damping layer was applied on the plate in order to investigate its effect. Note that the damping layer added extra weight, stiffness and damping to the original structure. The coverage of the bitumen layer was around 20 % when related to the full area of the plate. Two different applications were used: a) the bitumen layer was at the middle of the plate, b) the bitumen sheets were randomly around the plate. Both of them used the same amount of damping layer, and the added weight was 214 grams, that is 3.8 % of the bare plate weight. Fig. 8 shows the two bitumen layer application cases.
Fig. 7Free-layer damping treatments
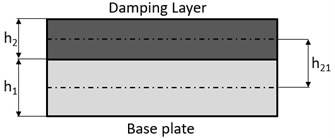
Fig. 8Two different damping layer applications: a) middle of the plate, b) random distribution around the plate
a)
b)
The measurement procedure was the same as the bare plate case, so three excitation points were applied, and 16 response points were used per each excitation. Fig. 9 represents the results of the DLF values at the two bitumen layer application cases.
Fig. 9DLF values of the two different bitumen layer application cases
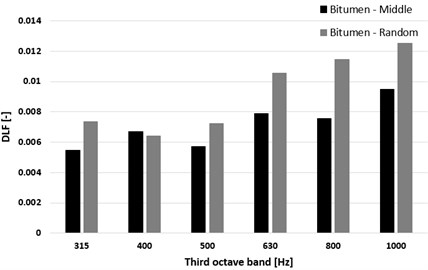
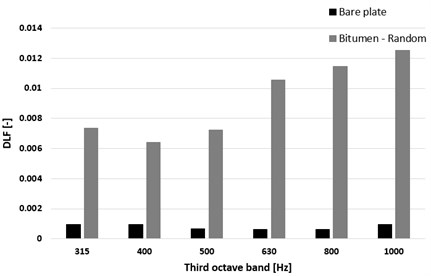
As the results show, at higher frequencies the randomly located bitumen sheets have higher impact on the DLF values. For a comparison, Fig. 10 illustrates the differences between the bare plate and the bitumen damped plate.
As the results show, at higher frequencies the differences were increased, with the maximum differences being one order of magnitude higher with damping layers than for the bare plate.
Fig. 10The DLF values of the bare plate and the plate with the bitumen layer application when the random distribution was applied
5.2. Statistical energy analysis simulation of damping layer plate
Since SEA simulations average the results in space and in frequency, thus the method is unable to take into consideration the location of the bitumen sheets. The goal of the random location was to investigate in the simulation software, how does the location can be taken into account, since in the software the only adjustable parameter is the coverage of the bitumen layer. Therefore, two cases were considered, both with 20 % coverage but with different distribution of the bitumen sheets. As a consequence, the damping values were changed, so every simulation parameter was the same in both cases, the only thing that was modified was the DLFs (see Fig. 9).
In the simulation software, the added damping layer was specified as a Noise Control Treatment, with the correct DLF values and coverage of the plate. The same weight was applied in the simulation as the actual weight of the investigated damped plate. Fig. 11 represents the comparison results of the simulation and the measurement for the case that the bitumen sheets were placed at the middle of the plate. Fig. 12, on the other hand, show the same comparison for the case when the bitumen sheets were randomly placed over the plate.
Fig. 11Simulation and measurement comparison for the case, when the bitumen sheets were placed at the middle of the plate. The Velocity/Force results were compared
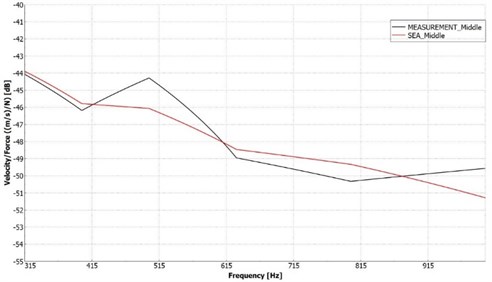
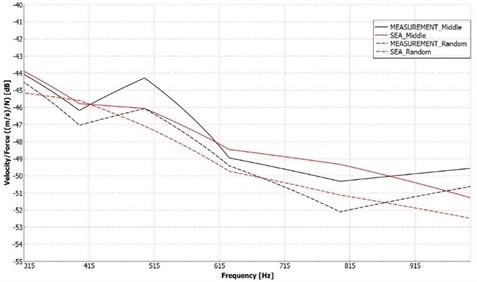
As the results show, both simulations were in good agreement with the experimental results. The maximum deviation was around 1.8 dB in both cases. For a better visualization of the differences, the two cases are illustrated jointly in Fig. 13. Thus, one can state, that the simulations represent the experiments quite well, as can be seen in Fig. 13. The middle location of the bitumen layers resulted in higher response in both the experiment and the simulation.
Fig. 12Simulation and measurement comparison for the case, when the bitumen sheets were randomly placed over the plate. The Velocity/Force results were compared
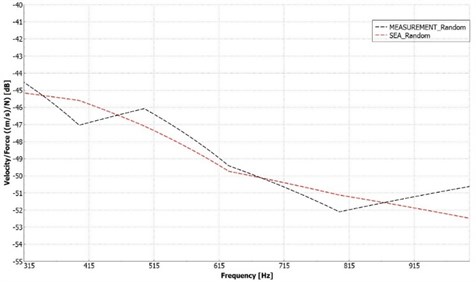
Fig. 13Comparison of the centrally and randomly placed bitumen sheets configurations. The solid curves correspond to the central bitumen location results, while the dashed lines to the randomly located bitumen sheets results. The Velocity/Force results were compared
6. Conclusions
The determination of the DLFs with half power bandwidth method have some limitations, which should be taken into account (e.g. coherences, closeness of the peaks). As the results showed, the DLF determination in the bare and the two damped cases was successful, as the comparison of the simulations and experiments showed. The three excitation points and the 48 response points gave enough samples in order to get a statistically representative value for the damping value in every third octave band. The comparison processes were the same, when a damped layer was used on the plate. The damping layers were highly influenced by the DLF values around one order of magnitude, despite their weights were only 3.8 % of the base steel plate. The results suggested that the random location of damping layers can be a better solution, since it generated lower response. This trend could be clearly observed also in the simulation results. The half-power bandwidth method was capable to determine the DLF results in the bitumen cases too and helped for a better description of the structure in different bitumen application cases.
References
-
Lyon R. H., Dejong R. G. Theory and Application of Statistical Energy Analysis, Butterworth-Heinemann, USA, 1995, p. 153-166.
-
Petrik J., Fiedler R., Lepsík P. Loss factor estimation of the plywood materials. Vibroengineering Procedia, Vol. 7, 2016, p. 42-47.
-
Iwaniec M. Damping loss factor estimation in plates. Molecular and Quantum Acoustics, Vol. 24, 2003, p. 61-68.
-
Mandale M. B., Bangarubabu P., Sawant S. M. Damping loss factor estimation by experimental method for plate with conventional and composite materials. International Journal on Design and Manufacturing Technologies, Vol. 9, Issue 2, 2015, p. 6-11.
-
Jadhav A. A., Desai S. R. Estimation of damping loss factor (DLF) for automotive glass. Journal of Basic and Applied Engineering Research, Vol. 2, Issue 6, 2015, p. 435-438.
-
Bustamante M., Gerges S., Vergara E. F., Arenas J. P. High damping characteristics of an elastomer particle damper. International Journal of Acoustics and Vibration, Vol. 21, Issue 1, 2016, p. 112-121, http://doi.org/ijav.2016.21.1401.
-
Cherif R., Chazot J.-D., Atalla N. Damping loss factor estimation of two-dimensional orthotropic structures from a displacement field measurement. Journal of Sound Vibration, Vol. 356, 2015, p. 61-71, http://dx.doi.org/10.1016/j.jsv.2015.06.042.
-
Seçgin A. Numerical determination of statistical energy analysis parameters of directly coupled composite plates using a modal-based approach. Journal of Sound and Vibration, Vol. 332, 2013, p. 361-377, https://doi.org/10.1016/j.jsv.2012.08.020.
-
Seçgin A., Güler S., Kara M. Determinations of in-situ energy loss factors of point-connected composite plates. Composites Part B: Engineering, Vol. 87, 2016, p. 27-32, https://doi.org/10.1016/j.compositesb.2015.09.019.
-
Seçgin A., Kara M., Ozankan A. A modal impedance-based statistical energy analysis for vibro-acoustic analysis of complex systems having structural uncertainty. Proceedings of the Institution of Mechanical Engineers, Part C: Journal of Mechanical Engineering Science, Vol. 233, Issue 6, 2019, p. 1972-1989, https://doi.org/10.1177/0954406218780894.
-
Wodtke H. W., Lamancusa J. S. Sound power minimization of circular plates through damping layer placement. Journal of Sound and Vibration, Vol. 215, 1998, p. 1145-1163, https://doi.org/10.1006/jsvi.1998.1660.
-
Ege K., Roozen N. B., Leclére Q., Rinaldi R. G. Assessment of the apparent bending stiffness and damping of multilayered plates; modelling and experiment, Journal of Sound and Vibration, Vol. 426, 2018, p. 129-149, https://doi.org/10.1016/j.jsv.2018.04.013.
-
Arenas J. P., Hornig K. H. Sound power radiated from rectangular plates with unconstrained damping layers. Proceedings of the 9th International Conference on Computational Structures Technology, Stirlingshire, Scotland, 2008, https://doi.org/10.4203/ccp.88.83.
-
Beldar P. R., Kushare D. V. Analytical, experimental and numerical analysis of passive damping treatment of butyl rubber. International Research Journal of Engineering and Technology (IRJET), Vol. 3, Issue 5, 2016, p. 15-20.
-
Fan R., Meng G., Yang J., He C. Experimental study of the effect of viscoelastic damping materials on noise and vibration reduction within railway vehicles, Journal of Sound and Vibration, Vol. 319, Issues 1-2, 2009, p. 58-76, https://doi.org/10.1016/j.jsv.2008.03.071.
-
Sanliturk K. Y. Modelling and validation of a multilayered composite finite element with damping capability. Proceedings of the 11th International Congress on Sound and Vibration, St. Petersburg, Russia, 2004, p. 2303-2310.
-
Cherkasov V. D., Yurkin Y. V., Avdonin V. V. Damping properties of sandwich beams with viscoelastic layer. IOP Conference Series: Materials Science and Engineering, Vol. 262, 2017, p. 012024, https://doi.org/10.1088/1757-899X/262/1/012024.
-
Cai R., Li P., Lin Y., Qiu B., Chen S. High frequency noise model based on statistical energy method parameter sensitivity analysis. Vibroengineering Procedia, Vol. 36, 2021, p. 72-77, https://doi.org/10.21595/vp.2021.21870.
-
Cai Y., Yu H., Liang B., Song Y., Yan J. Estimation of statistical energy analysis loss factor for fiber reinforced plastics plate of yachts. Journal of Vibroengineering, Vol. 18, Issue 4, 2016, p. 2088-2101, https://doi.org/10.21595/jve.2016.16862
-
Sipos D., Feszty D. Development of a procedure for the validation of statistical energy analysis simulations. Acta Technica Jaurinensis, Vol. 12, Issue 4, 2019, p. 335-346, https://doi.org/10.14513/actatechjaur.v12.n4.512
-
Siemens LMS Help guide, 2019.
-
VA One Users’ Guide. MECAS ESI Group, 2018.
Cited by
About this article

This work was supported by the Hungarian Academy of Sciences and Audi Hungaria Zrt. through the MTA-SZE Lendület Vehicle Acoustics Research Group.
