Abstract
Cantilever structure, which needs high-frequency rotating motion, is widely used in the field of chip manufacturing. The motion stability of high-frequency rotation motion of cantilever structure directly affects the production efficiency. The traditional dynamic analysis method is no longer applicable to analyze the vibration of cantilever structure under high-frequency rotating motion. It is also urgent to control the high-frequency rotation motion of cantilever mechanism. In this paper, experiments are designed to collect strain signals of chip sorter’s cantilever under high-frequency operation, and modal parameters are extracted from time domain signals by symbolic regression algorithm. The results of modal parameter identification at high-frequency are selected as the samples, and the Gaussian process regression model of machine learning algorithm is used to train the samples. The prediction results can be used as the basis of structural stability research and vibration suppression.
1. Introduction
High-frequency rotating cantilever structure is widely used in the field of chip manufacturing. The motion stability of the rotating cantilever structure directly affects the production efficiency of the chip [1, 2]. However, there are few researches on the vibration analysis of the cantilever rotating structure, and few of them can be used in the industrial production site [3-5]. The research on the vibration characteristics of the cantilever rotating structure at high-frequency needs to increase the time and energy input of scientific researchers. With the development of intelligent era and mass mode of big data, it is urgent to adapt to the high-frequency rotation motion of cantilever mechanism controlled by big data [6].
In this paper, modal analysis method is used to study the vibration stability of cantilever mechanism under high-frequency rotation [7, 8]. At present, the research on the vibration of cantilever mechanism adopts the traditional vibration analysis technology [9], but also stays in the traditional theoretical research stage. Some rules are found, but the laws are closely related to the specific structure types. Therefore, it is important to obtain a general intelligent vibration analysis method of cantilever mechanism adapting to big data mode. At the same time, the current research on the cantilever structure only stays in the static or quasi-static conditions, and the research on the vibration characteristics of the cantilever structure under the high-speed operation condition is very few, and the research on the cantilever motion with emergency stop and commutation motion is not available.
In order to analyze the vibration characteristics of the cantilever structure of the chip sorter under high-frequency operation, the modal analysis technology is adopted in this paper. However, in order to adapt to the industrial production in the big data mode, the intelligent algorithm is added to update the traditional algorithm. In order to solve the problem of obtaining dynamic adaptive modal parameters, evolutionary computation is an advanced intelligent and dynamic adaptive technology [10]. It can search multiple solutions in the solution space implicitly and in parallel, and use the difference between different solutions to set the penalty function and obtain the best solution. Evolutionary computation refers to the behavior of biological groups, and uses the development mode of survival and reproduction among populations to carry out population evolution. For example, the application of backtracking search algorithm (BSA) [11] in economic dispatch, and artificial cooperative search algorithm [12] for finding the optimal solution of complex optimization problems, and particle swarm optimization (PSO) [13] simulated ti67/Nb adhesion strength, and hardness to predict output performance and rainfall optimization algorithm (RFO) [14] is used to obtain the optimal solution of numerical optimization problems. Particle swarm optimization PI (PSO PI) [15] is used to control the rotating d-q current and drive the induction motor. PSO has the same performance as genetic algorithm, but it is faster and simpler.
Most importantly, regression analysis and the most popular evolutionary computation methods are based on the assumption that the form of function used is set [16]. The disadvantage of these programs is that they consume a lot of computing time. In addition, the function form of the model is selected according to experience, and the natural law may not be able to reflect it well. This means that the complex model function expression is selected for the complex vibration system, but the law implied in the experimental data is very simple, or simple model function expression is selected according to the complex law implied in the experimental data of complex vibration system. But the problem is that it is difficult to determine the number of enough single pulse excitation, and it is difficult to solve the problem of obtaining dynamic adaptive modal parameters. Therefore, it would be advantageous to have an algorithmic approach to determine the best correlation for experimental data without assuming its functional form. The problem is how to analyze the correlation automatically based on the measured data.
At present, due to the emergence of data mining, this problem can be well solved with the help of the current computer technology [17]. Without any physical knowledge, the data mining algorithm finds the Newton's law, geometry and momentum conservation laws of the reaction system hidden in the data. We always analyze problems in the way that we decompose complex problems into a series of simple problems, so as to slowly excavate the inherent laws hidden in nature [18]. In the traditional parametric regression analysis, the function model between free variables and coefficients should be assumed in advance to solve the system parameters, and the optimal coefficient of the equation can be obtained by minimizing the error between the estimated value and the experimental value. The difference is that symbolic regression (also known as function identification) does not need to assume the function model in advance. It can obtain the functional relationship between variables by minimizing the error between the predicted value and the experimental value [19], and automatically search out mathematical laws and function models from the data set. In addition, parametric regression will have pseudo linearity, continuity and other conditions [20], while symbolic regression does not. The other advantages of symbolic regression are: (1) depending on the large-scale population number and setting reasonable mutation and crossover probability parameters in the algorithm, the algorithm is not easy to enter the local optimum; (2) the population operation is carried out by using the operator to improve the execution strength of the algorithm; (3) the individuals with hierarchical structure of binary tree can adapt to the nonlinear requirements very well. Therefore, as a good dynamic adaptive algorithm, symbolic regression only mines function expression rules from response data, and then obtains dynamic adaptive modal parameters.
At present, there is no research and patent on the application of symbolic regression in modal analysis, but the application scope of symbolic regression method has developed in recent years. In 2009, Michael Schmidt explained the theoretical usage of symbolic regression by mining the classical physical laws implied in model experimental data [18]. In 2016, Wu laitong used symbolic regression and genetic programming algorithm to mine the variation rules of model parameters of underwater vehicles [21]. Yu Peng applied symbolic regression genetic programming algorithm to the field of power quality analysis, which can reduce the loss of time information and improve work efficiency [22]. The main applications of symbolic regression are genetic programming [23], gene expression programming [24] and stepwise regression algorithm for randomly generating candidate factor sets [25]. Among these algorithms, the most developed one is genetic programming. Genetic programming is a generalized hierarchical computer program that can adaptively deal with linear or nonlinear problems [26, 27].
In this paper, a dynamic self-adaptive evolutionary calculation method called genetic programming is used, which is also an extension of symbolic regression [28]. The dynamic self-adaptation method searches the optimal parameter expression rules of the target model from simple model to complex model by evolution. The hidden rules in the data can be mined out, and finally the modal parameters can be identified to reflect the vibration characteristics of cantilever structure under high-frequency operation.
2. Identification of main vibration frequency characteristics of chip sorter under high rotation
2.1. Experimental arrangement
Because the period, high-frequency, emergency stop and commutation excitation and pulse excitation of the cantilever structure of the chip sorter are very similar under the operating conditions, this paper makes the assumption that the high-frequency, emergency stop and commutation excitation in this period are pulse excitation. The response is the superposition of enough times of intermittent single pulse excitation. The shape of cantilever structure will change under different rotation frequency due to the different structure shape under dynamic and static conditions. The strain signals of the chip sorter with cantilever mechanism at high-frequency were collected.
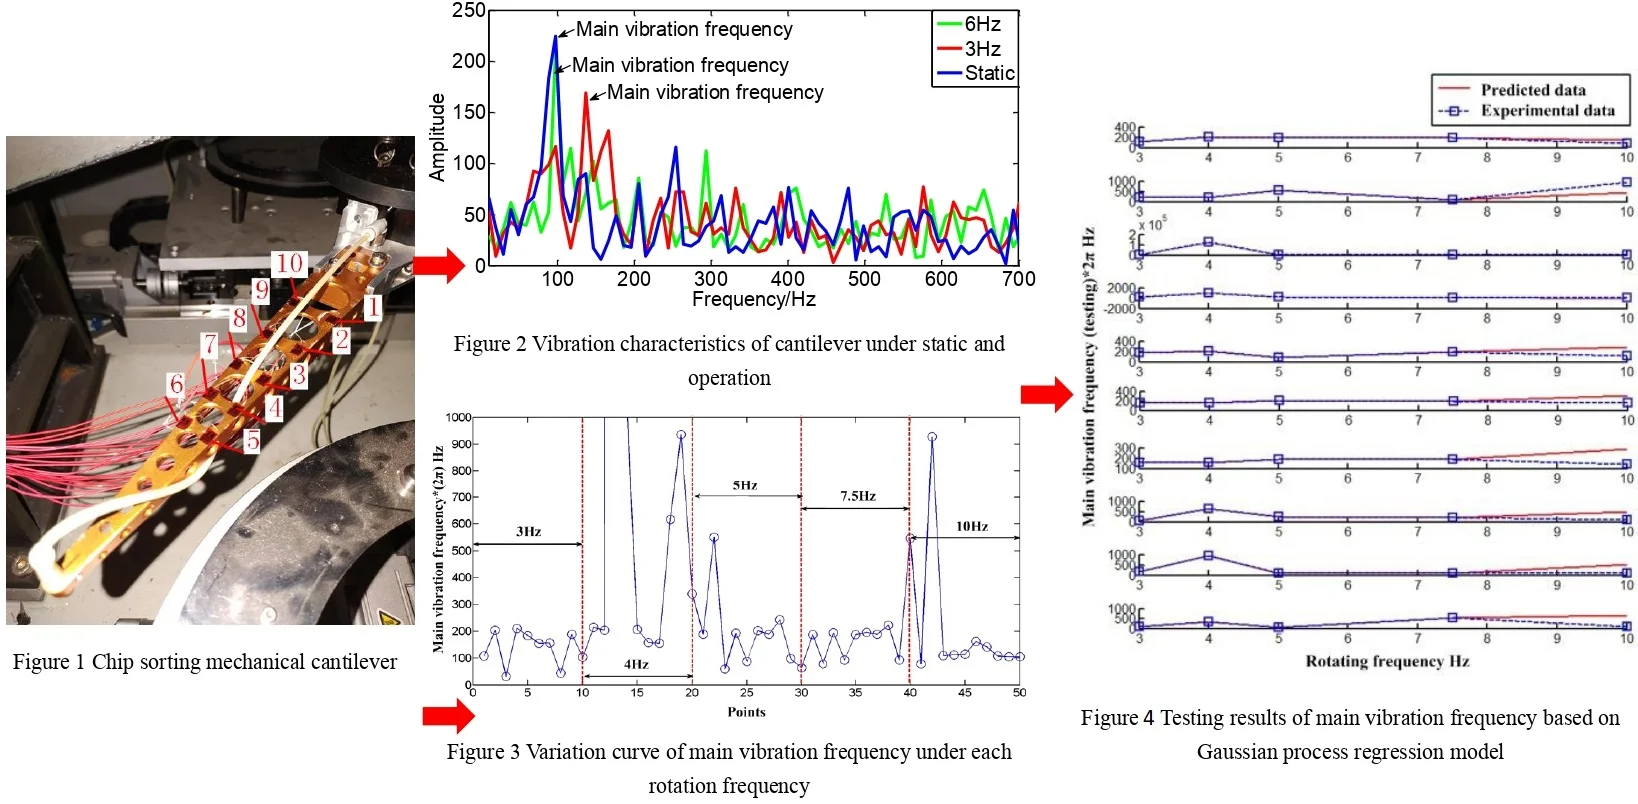
The experiment is carried out on the cantilever of the chip sorter, as shown in Fig. 1. 10 points are arranged equidistant on the cantilever, and a strain gauge (point 1-10) is attached to each point. At the same time, the data acquisition device is connected to collect the strain data under different rotation frequencies. Before the experiment, three groups of experiments were conducted, including static, 3 Hz and 6 Hz, to pre-inspect the difference between static and dynamic conditions. It can be seen from Fig. 2 that the main vibration frequency of the cantilever under the static striking condition and the other two groups of operating conditions has changed. Obviously, the main vibration frequency of the system is increased under the rotating frequency of 6 Hz, compared with the static condition.
Fig. 1Cantilever experimental device
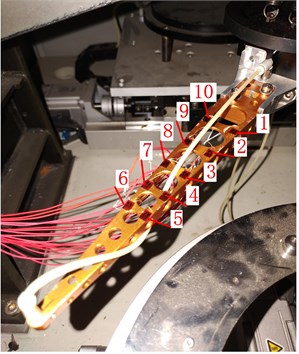
Fig. 2Vibration characteristics of cantilever under static and high-frequency operation
In the formal experiment, five groups of operating conditions were set up, including 3 Hz, 4 Hz, 5 Hz, 7.5 Hz and 10 Hz. Considering the problem of adaptive modal parameter identification under periodic shock excitation, a symbolic regression method is proposed. Data mining based on symbolic regression method can deal with the zero drift, trend term, high-frequency periodic noise and other interferences in the strain signal, and extract the modal parameters dynamically and adaptively. In order to analyze the vibration characteristics of the cantilever under operating conditions, the modal parameters are extracted from the time domain signal by using the symbolic regression algorithm. The process of experimental data processing is divided into three parts: data preprocessing, data import symbolic regression algorithm and modal parameter extraction of result model.
2.2. Identification of main vibration frequency characteristics based on strain response
As a data mining method, symbolic regression can obtain modal parameters only by mining the function expression rules of single point response data. It can deal with the interference of zero drift, trend term and high-frequency periodic noise in the strain signal, and extract the modal parameters dynamically and adaptively. The modal parameters are extracted from the time domain signals by using the symbolic regression algorithm.
This section analyzes the vibration characteristics of the cantilever under operating conditions. First, the experimental data is preprocessed to remove noise and other interference. The preprocessing includes smoothing and regularization. Considering that the data is affected by the noise in different degrees, the corresponding smoothness coefficient has been adjusted. Then import the preprocessed strain data into the symbolic regression for modal parameter identification. Considering the selectivity of the model and the current hardware conditions, only the model corresponding to the theory is extracted. Tables 1-5 are the modal frequency identification results, which correspond to the rotation frequencies of 3 Hz, 4 Hz, 5 Hz, 7.5 Hz, and 10 Hz, respectively.
Table 1Recognition results by symbolic regression (3 Hz)
Frequency / Hz | Function identification results | Smoothness |
209.1, 107.7 | 50 % | |
204.0 | 50 % | |
31.9 | 50 % | |
210.8 | 30 % | |
184.0 | 50 % | |
155.0 | 50 % | |
156.2 | 50 % | |
43.6 | 50 % | |
188.3 | 50 % | |
104.0 | 50 % |
Table 2Recognition results by symbolic regression (4 Hz)
Frequency / Hz | Function identification results | Smoothness |
214.0 | 50 % | |
203.7 | 40 % | |
124591.5 | 30 % | |
1060.0 | 50 % | |
206.1 | 30 % | |
157.5, 531.9 | 30 % | |
155.0 | 30 % | |
615.7 | 30 % | |
936.5 | 30 % | |
57.7, 339.0 | 30 % |
Table 3Recognition results by symbolic regression (5 Hz)
Frequency / Hz | Function identification results | Smoothness |
188.6, 459.3 | 50 % | |
550.2 | 30 % | |
60.0, 184.2 | 30 % | |
192.2 | 30 % | |
87.6 | 17 % | |
201.6 | 50 % | |
188.6 | 50 % | |
242.5 | 50 % | |
98.3, 199.7 | 50 % | |
64.2 | 50 % |
Table 4Recognition results by symbolic regression (7.5 Hz)
Frequency / Hz | Function identification results | Smoothness |
187.7, 295.7, 95.3 | 50 % | |
78.2 | 50 % | |
194.0 | 50 % | |
93.4 | 50 % | |
186.8 | 50 % | |
109.5, 195.8 | 50 % | |
188.6 | 50 % | |
222.4 | 50 % | |
93.8, 205.0 | 50 % | |
546.7 | 30 % |
Table 5Recognition results by symbolic regression (10 Hz)
Frequency / Hz | Function identification results | Smoothness |
78.1 | 40 % | |
928.2 | 30 % | |
63849.4, 110.1 | 30 % | |
112.7 | 30 % | |
114.6 | 30 % | |
162.5 | 40 % | |
141.5 | 40 % | |
107.7 | 40 % | |
105.9 | 30 % | |
104.8, 257.2 | 40 % |
In the process of model search, there is over fitting problem in the model. For multiple models, the model is selected according to the structure of expression (2.16), and the model with high identification degree is selected. For example, in the result of function identification of Point 4 at 3 Hz, the 243.3 is a constant trend term that should be removed, and the frequency of –305.1 is too low, which belongs to the constant trend term, should be removed. The first term 1.5 is the characteristic term of modal frequency, and the identified main frequency is 33.5 Hz. In the result of function identification of Point 10 at 3 Hz, the 0.3 is that the trend of constant term should be removed. Considering that the frequencies of 104.0 Hz and 118.3 Hz are very similar, the fundamental frequency of the first, third and fourth terms is 104.0/(2) Hz, and the characteristic frequency of this recognition is 104.0/(2) Hz.
The results show that the new experimental modal analysis method based on sign regression can deal with the interference of zero drift, trend term, high-frequency periodic noise and other interference in the strain signal and extract the modal parameters. This provides a guarantee for the later application of the Gaussian process regression model to the establishment of the model and the prediction of vibration characteristics at higher frequencies.
2.3. Variation of main vibration frequency of each part of chip sorter
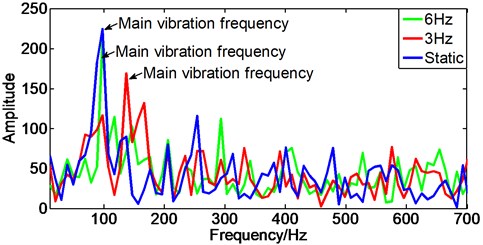
Fig. 3 presents the variation curve of main vibration frequency under each rotation frequency (3 Hz, 4 Hz, 5 Hz, 7.5 Hz and 10 Hz). Under the conditions of each rotation frequency, the main vibration frequency of each point on the cantilever basically stays at 15.9 Hz-31.8 Hz. When the rotation frequency is 3 Hz, the main vibration frequency stays at 15.9Hz-31.8 Hz; when the rotation frequency is 4 Hz, the main vibration frequency is higher and fluctuates greatly; when the rotation frequency is 5 Hz, the main vibration frequency stays at 15.9 Hz-79.5 Hz; when the rotation frequency is 7.5 Hz, the main vibration frequency stays at 15.9 Hz-31.8 Hz; when the rotation frequency is 10 Hz, the main vibration frequency is about 15.9 Hz. On the whole, from 4 Hz to 10 Hz, the frequency decreases and the range of variation decreases. Therefore, the prediction of the later frequency band shows that it tends to a constant of 15.91 Hz.
Fig. 3Variation curve of main vibration frequency under each rotation frequency (Point 1-10, Rotating frequency 3 Hz, 4 Hz, 5 Hz, 7.5 Hz and 10 Hz)
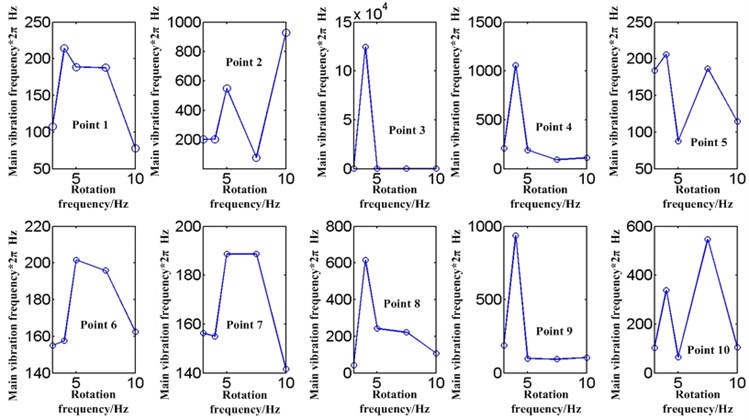
From each point of view, as shown in Fig. 4, the main frequency of each point 1-10 decreases after 4H z to 10 Hz. Point 2 has a special case at 10Hz, which can be ignored in general. Point 1, 3, 4, 5, 6, 8, 9 have strong volatility weakening and tend to constant. The trend of point 7 and 10 is weak.
Generally speaking, compared with the low-frequency, the volatility of the main vibration frequency tends to weaken and tends to be constant with the increase of the rotating frequency of the cantilever. This law can be used to predict the vibration characteristics and suppress the vibration of the cantilever under high-frequency rotation.
Fig. 4Variation curve of main vibration frequency of each point (Point 1-10, Rotating frequency 3 Hz, 4 Hz, 5 Hz, 7.5 Hz and 10 Hz)
3. Prediction model for vibration characteristics of chip sorter’s cantilever
In this study, the actual situation is that the frequency distribution of the main vibration has volatility. Commonly used machine learning algorithms include artificial neural networks, support vector regression, hidden Markov models and other machine learning techniques to predict. According to the situation in this paper, Gaussian process and Bayesian model can be used to solve parameter prediction under the condition of considering average and variance. First, the strain signal of the cantilever mechanism chip sorting machine under high-frequency is collected, and the modal parameters are extracted from the time domain signal using the symbol regression algorithm. Then select the modal parameter recognition results under high-frequency as the samples, considering the volatility of the recognition results, and then use the machine learning algorithm Gaussian process regression model training samples to establish the prediction of the vibration characteristics of the cantilever under high-frequency. The advantage of this model is that the natural frequency is set as a random variable and obeys the Gaussian distribution, which can handle the volatility of the natural frequency well.
The Gaussian process regression model and the regression equation are as follows [29]:
where the average is usually considered the new output , the variance corresponds to the new input , the original output data and input data are and respectively, the kernel functions and are standard exponential covariance functions and function matrices.
The modal parameters are extracted from the time-domain strain signals by using the identification algorithm. In this chapter, the main vibration frequencies are selected as the characteristic parameters of vibration analysis. The identified modal parameters under high-frequency are selected as samples. Considering the volatility of the recognition results, machine learning algorithms and Gaussian process regression model training samples are used to establish a prediction model of the vibration characteristics of the cantilever. This prediction model sets the natural frequency as random variable and obeys Gaussian distribution, which can deal with the volatility of natural frequency well. The prediction results can be used as the basis for identifying modal parameters and predicting vibration characteristics of chip sorter’s cantilever under high-frequency rotation.
Fig. 5Training results of main vibration frequency based on Gaussian process regression model (Points 1-10 from top to bottom)
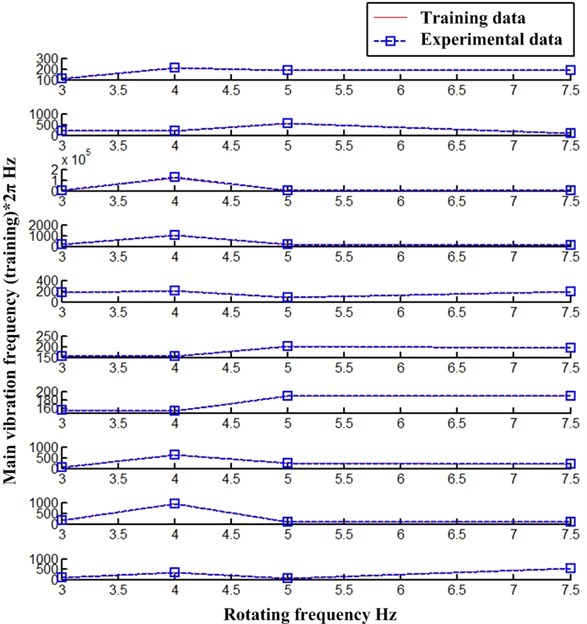
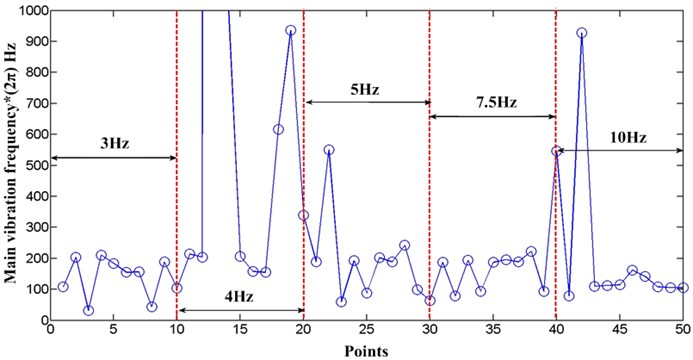
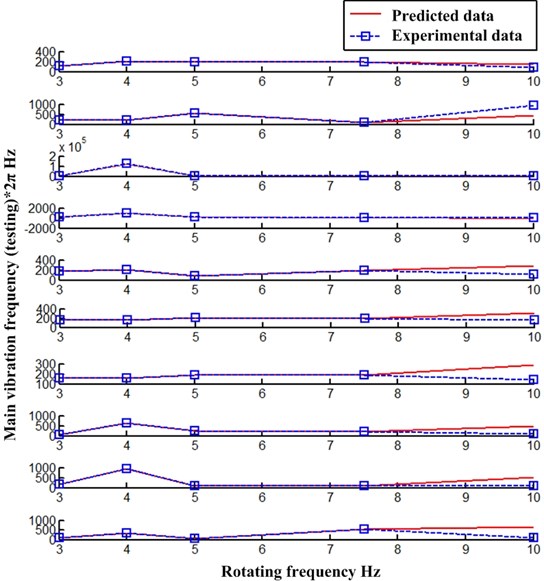
At the same time, Gaussian process has a good application prospect for volatility trajectory prediction. As shown in Fig. 5 and Fig. 6. Fig. 5 presents the main vibration frequency results of each point trained by Gaussian process regression model (Points 1-10 from top to bottom), and the training results show that the model has good fitting data. Fig. 6 presents the prediction results of main vibration frequency by Gaussian process regression model (Points 1-10 from top to bottom). It shows that the prediction results of main vibration frequency at 10 Hz by the model have deviation, but the main vibration frequency data of point 1-4 and point 6 are correct. It is believed that good prediction results can be obtained in the case of large data and model optimization.
The main vibration frequency of each point on the cantilever can represent the vibration characteristics. It is found that the high rotation frequency of the main vibration of each component tends to be unified. The variation law of the main vibration frequency and rotation frequency has certain engineering application value for the high rotation frequency vibration analysis of the cantilever of the chip sorter. The training and testing model is used to predict the change law of vibration characteristics at higher frequency, and the purpose is to effectively control the vibration of the cantilever at high-frequency.
Fig. 6Testing results of main vibration frequency based on Gaussian process regression model (Points 1-10 from top to bottom)
4. Conclusions
In this paper, the identification technology of modal parameters is applied to the vibration analysis of chip sorter. As a data mining method, the symbolic regression is used to obtain the modal parameters by mining the function expression rules of single point’s response, which can well deal with the interference of zero drift, trend term and high-frequency periodic noise in the strain signal and extract the modal parameters. In addition, the Gaussian process regression model is used to predict the vibration characteristics at higher frequencies. The natural frequency is set as a random variable and obeys the Gaussian distribution, which can well deal with the fluctuation of natural frequency. The experiment is carried out on the chip sorter’s rotating arm, and the strain time-domain signal is collected. The main vibration frequency of each point on the cantilever is extracted by using identification method as the characterization of dynamics. The prediction model based on Gaussian process regression is used to train and test the data, and the training results show that the accuracy of the model is very high. The test results show that the model is useful for the prediction of the main vibration frequency under high rotation. The variation law of higher frequency vibration characteristics predicted by the model can be used as the basis for vibration characteristic prediction and vibration suppression of rotating arm under high rotation according to the actual engineering situation.
References
-
H. H. Yoo and S. H. Shin, “Vibration analysis of rotating cantilever beams,” Journal of Sound and Vibration, Vol. 212, No. 5, pp. 807–828, May 1998, https://doi.org/10.1006/jsvi.1997.1469
-
J. Chung and H. H. Yoo, “Dynamic analysis of a rotating cantilever beam by using the finite element method,” Journal of Sound and Vibration, Vol. 249, No. 1, pp. 147–164, Jan. 2002, https://doi.org/10.1006/jsvi.2001.3856
-
M. Yaylı, “Stability analysis of gradient elastic microbeams with arbitrary boundary conditions,” Journal of Mechanical Science and Technology, Vol. 29, No. 8, pp. 3373–3380, Aug. 2015, https://doi.org/10.1007/s12206-015-0735-4
-
C.-C. Hong, “Free vibration frequency of thick FGM circular cylindrical shells with simply homogeneous equation by using TSDT,” Advances in Technology Innovation, Vol. 5, No. 2, pp. 84–97, Apr. 2020, https://doi.org/10.46604/aiti.2020.4380
-
M. Özgür Yayli, “An efficient solution method for the longitudinal vibration of nanorods with arbitrary boundary conditions via a hardening nonlocal approach,” Journal of Vibration and Control, Vol. 24, No. 11, pp. 2230–2246, Jun. 2018, https://doi.org/10.1177/1077546316684042
-
X. Dawei and A. Lei, “Exploration on big data oriented data analyzing and processing technology,” International Journal of Computer Science Issues, Vol. 10, No. 1, pp. 13–18, 2013.
-
R. Brincker and C. Ventura, Introduction to Operational Modal Analysis. John Wiley & Sons, 2015.
-
P. Avitabile, “Experimental modal analysis,” Sound and Vibration, Vol. 35, No. 1, pp. 20–31, 2001.
-
C. Mei, “Free vibration analysis of classical single-story multi-bay planar frames,” Journal of Vibration and Control, Vol. 19, No. 13, pp. 2022–2035, Oct. 2013, https://doi.org/10.1177/1077546312455081
-
V. A. W. J. Marchau, W. E. Walker, and J.-W. G. M. van der Pas, “Dynamic adaptive planning (DAP): the case of intelligent speed adaptation,” in Decision Making under Deep Uncertainty, Cham: Springer International Publishing, 2019, pp. 165–186, https://doi.org/10.1007/978-3-030-05252-2_8
-
M. Modiri-Delshad, S. H. Aghay Kaboli, E. Taslimi-Renani, and N. A. Rahim, “Backtracking search algorithm for solving economic dispatch problems with valve-point effects and multiple fuel options,” Energy, Vol. 116, pp. 637–649, Dec. 2016, https://doi.org/10.1016/j.energy.2016.09.140
-
S. H. A. Kaboli, J. Selvaraj, and N. A. Rahim, “Long-term electric energy consumption forecasting via artificial cooperative search algorithm,” Energy, Vol. 115, pp. 857–871, Nov. 2016, https://doi.org/10.1016/j.energy.2016.09.015
-
A. R. Rafieerad et al., “Toward improved mechanical, tribological, corrosion and in-vitro bioactivity properties of mixed oxide nanotubes on Ti-6Al-7Nb implant using multi-objective PSO,” Journal of the Mechanical Behavior of Biomedical Materials, Vol. 69, pp. 1–18, May 2017, https://doi.org/10.1016/j.jmbbm.2016.11.019
-
S. H. Aghay Kaboli, J. Selvaraj, and N. A. Rahim, “Rain-fall optimization algorithm: A population based algorithm for solving constrained optimization problems,” Journal of Computational Science, Vol. 19, pp. 31–42, Mar. 2017, https://doi.org/10.1016/j.jocs.2016.12.010
-
S. S. Sebtahmadi, H. B. Azad, S. H. A. Kaboli, M. D. Islam, and S. Mekhilef, “A PSO-DQ current control scheme for performance enhancement of Z-source matrix converter to drive IM fed by abnormal voltage,” IEEE Transactions on Power Electronics, Vol. 33, No. 2, pp. 1666–1681, Feb. 2018, https://doi.org/10.1109/tpel.2017.2679118
-
L. D. Schroeder, D. L. Sjoquist, and P. E. Stephan, Understanding Regression Analysis: An Introductory Guide. 2455 Teller Road, Thousand Oaks California 91320: SAGE Publications, Inc, 2017, https://doi.org/10.4135/9781506361628
-
C. Sammut and G. I. Webb, Encyclopedia of Machine Learning and Data Mining. Springer, 2017.
-
M. Schmidt and H. Lipson, “Distilling free-form natural laws from experimental data,” Science, Vol. 324, No. 5923, pp. 81–85, Apr. 2009, https://doi.org/10.1126/science.1165893
-
S.-M. Udrescu and M. Tegmark, “AI Feynman: A physics-inspired method for symbolic regression,” Science Advances, Vol. 6, No. 16, p. eaay2631, Apr. 2020, https://doi.org/10.1126/sciadv.aay2631
-
F. Ding, F. Wang, L. Xu, T. Hayat, and A. Alsaedi, “Parameter estimation for pseudo‐linear systems using the auxiliary model and the decomposition technique,” IET Control Theory and Applications, Vol. 11, No. 3, pp. 390–400, Feb. 2017, https://doi.org/10.1049/iet-cta.2016.0491
-
N.-L. Wu, X.-Y. Wang, T. Ge, C. Wu, and R. Yang, “Parametric identification and structure searching for underwater vehicle model using symbolic regression,” Journal of Marine Science and Technology, Vol. 22, No. 1, pp. 51–60, Mar. 2017, https://doi.org/10.1007/s00773-016-0396-8
-
Y. Peng, “New application of symbolic regression method based on genetic programming in power quality analysis,” Electronic Design Engineering, Vol. 7, 2013.
-
J. R. Koza and R. Poli, “Genetic Programming,” in Search Methodologies, Boston, MA: Springer US, 2005, pp. 127–164, https://doi.org/10.1007/0-387-28356-0_5
-
C. Ferreira, “Gene expression programming in problem solving,” in Soft Computing and Industry, Vol. 13, London: Springer London, 2002, pp. 635–653, https://doi.org/10.1007/978-1-4471-0123-9_54
-
M. Templ, A. Kowarik, and P. Filzmoser, “Iterative stepwise regression imputation using standard and robust methods,” Computational Statistics and Data Analysis, Vol. 55, No. 10, pp. 2793–2806, Oct. 2011, https://doi.org/10.1016/j.csda.2011.04.012
-
X. Jiang, F. Jiang, and B. Zhang, “Operational modal analysis of a nonlinear oscillation system under a harmonic excitation,” Proceedings of the Institution of Mechanical Engineers, Part C: Journal of Mechanical Engineering Science, p. 095440622097755, Dec. 2020, https://doi.org/10.1177/0954406220977550
-
Z. Abdolahzare and S. A. Mehdizadeh, “Nonlinear mathematical modeling of seed spacing uniformity of a pneumatic planter using genetic programming and image processing,” Neural Computing and Applications, Vol. 29, No. 2, pp. 363–375, Jan. 2018, https://doi.org/10.1007/s00521-016-2450-1
-
X. Jiang and F. Jiang, “Operational modal analysis using symbolic regression for a nonlinear vibration system,” Journal of Low Frequency Noise, Vibration and Active Control, Vol. 40, No. 1, pp. 120–134, Mar. 2021, https://doi.org/10.1177/1461348420905172
-
C. K. I. Williams and C. E. Rasmussen, Gaussian Processes for Machine Learning. Cambridge: MIT Press, 2006.
About this article

The research is supported by the Natural Science Foundation of Hubei Province, China (Grant No. 2020CFB180), and supported by “The Fundamental Research Funds for the Central Universities”, Zhongnan University of Economics and Law (Grant No. 2722021BZ036, No. 2722020SQY16), and supported by the Teaching Research Project of Zhongnan University of Economics and Law (Grant No. YB202065). The authors are grateful to other participants of the project for their cooperation.
