Abstract
This paper presents the replication of accelerations in a vehicle excited from single obstacle crossings. The accelerations should be replicated at multiple comfort-relevant excitation points in a comfort-simulator. For the vertical accelerations at the seat rails and the foot rests, research on the positions and the number of shakers is conducted. The implementation of an electrodynamic shaker for each controlled measurement point turns out to be mandatory. By positioning them at the left and right seat rails, errors can be minimized due to similarities in the transmission behavior. The longitudinal excitations of the seat back by means of shakers are performed very precisely. The direct coupling by a construction on the headrest allows fast exchange of the vehicle seats. The combination of all acceleration replications simultaneously can be performed satisfactorily comparing them with in-vehicle field measurements. The noise-based excitation signal for system identification turns out to be a significant parameter.
Highlights
- Very precise replication of vibrations from real single-obstacle crossings
- Possibility for selective control of specific reference points
- Extension of the reproducible frequency range
1. Introduction
Road surfaces have a high influence on driving behavior, driving comfort and also on stress of certain vehicle components and thus highly impacts the automotive industry. According to [1], the road surface can be classified according to its wavelength and therefore categorized into unevenness (wavelength range: 50 m – 0.5 m), mega texture (wavelength range: 0.5 m – 50 mm), macro texture (wavelength range: 50 mm – 0.5 mm) and micro texture (wavelength range < 0.5 mm). For vertical dynamics and thus predominantly for ride comfort, the range of unevenness and a part of the megatexture range are decisive [2]. In combination with the vehicle characteristics, these excitations result in noise and vibration. The road roughness in the macro texture area matter in particular for the acoustical influence of comfort. The effects on humans are essential in the evaluation of vibrations. For example, the frequency characteristics of vibrations are rated based on human perception. Vibrations in the range of 20 Hz 100 Hz are called harshness, which is defined as the threshold between purely tactile vibration (20 Hz) and purely audible vibration (100 Hz) [3]. Of further significance are: location and direction of excitation, amplitudes, and kind of vibration. One target of research is the investigation of correlations between subjective perception and the objective criteria. ISO 2631 [4] gives a method for evaluating vibration using frequency-dependent weighting functions and derives effects on health, comfort, and kinetosis. Whole-body vibrations for seated, standing, and recumbent humans at the corresponding interface between vibrating surface and human are considered. Further research examines additional influencing factors, such as the influence of steering wheel vibration [5] or additional translational and rotational degrees of freedom at the seat back, foot rests and seats [6]. The evaluation of the vibration comfort by lifting and pitching motions [7] or the evaluation in case of pulsed interference [8] are well-known evaluation methods. In comparison of these methods, the standardized approaches are more suitable for the evaluation of comfort [9]. The changed framework conditions resulting from autonomous driving open up further fields of research. For example, [10] extends the standardized method according to ISO 2631 to include head movements, thus improving the objectification of ride comfort. The development of these methods is usually done by empirical investigations due to the subjectivity of the perception of comfort. The respective data can be obtained by real test drives, which represents a comprehensive realistic approach. However, this decisive advantage is contrasted by a number of disadvantages. For example, varying vehicle characteristics is very time- or resource-consuming, and thus very expensive. Even on test tracks, it is difficult to conduct a test several times in an exactly reproducible form, so that the results always include stochastic variations. The use of driving simulators reproduces nature by a more or less simplified model. The disadvantages of real driving just mentioned are accordingly advantages of simulator use. In addition, many simulators can also be used to replicate simulated signals, e.g. from multi body simulations, so that the evaluation methods can already be tested during the development process [11]. Depending on the objective of the investigations, numerous simulators are available. Starting from the simple seat on a vibration table [12] up to the hybrid system National Advanced Driving Simulator (NADS) of the National Highway Traffic Safety Administration (NHTSA) [13] various options exist. Most simulators focus on replicating stochastic accelerations, which are also most common in nature due to roadway roughness. Investigations regarding the influence of transient oscillations on human perception have come into focus in the past decade. For instance, Knauer [14] achieved fundamental insights into the masking effect of single obstacle excitations, which are applied in further research [15], [16]. The major restrictions on the scope of the experiments of Knauer were the frequency range limitation (0 Hz40 Hz) and the missing option to independently control specific contact points between vehicle and human. Our simulator presented here should overcome the shortcomings reported in Knauer [14]. At essential excitation points according to the evaluation methods mentioned before, the comfort-relevant accelerations should be simulated as exactly and independently as possible. In this paper, a crossing of a negative step (cf. Fig. 1(a)) with a height of 20 mm is simulated. Furthermore, it should be possible to simulate measurement data from different vehicles without a large loss of time successively, even if the measurement vehicles differ from the simulator vehicle. A trimmed body initially serves as the simulator vehicle.
The procedure for replicating the acceleration signals is visualized in Fig. 1 and is described in [17]. The real crossings of single obstacles (Fig. 1(a)) can also be replaced by simulations. The coordinate system describes the directions of acceleration in subsequent sections ( – vertical, – longitudinal and – lateral accelerations). The system behavior of the simulator is determined by excitation of electrodynamic shakers by means of suitable test signals (Fig. 1(b)). These shakers are directly coupled to the body-in-white. In the long term, the flexibility allows the combination with a driving simulator based on a hexapod system with extensive visualization. The use of a whole vehicle cabin adds visual and haptic influences, which are important for the overall perception of comfort [18]. The evaluation of the recorded signal data set and generation of the drive signals are shown in Fig. 1(c). The method is based on the direct calculation of the inverse transfer function using block-oriented nonlinear system identification. This method has been demonstrated using a single input – single output (SISO) approach, but will not be further discussed in this paper. Excitation of the body-in-white with these drive signals is intended to reproduce almost identical accelerations at the reference points as measured in the test vehicle (Fig. 1(d)).
Fig. 1Scheme for replicating single obstacle crossings on a simulator [17]
![Scheme for replicating single obstacle crossings on a simulator [17]](https://static-01.extrica.com/articles/22930/22930-img1.jpg)
a) Acceleration measurement at the reference positions, e.g. ●, during the single-obstacle crossing (e.g. negative edge) in the real vehicle
![Scheme for replicating single obstacle crossings on a simulator [17]](https://static-01.extrica.com/articles/22930/22930-img2.jpg)
b) Shaker excitation ▲ of the body in white (with seat) in the simulator with a suitable test signal and recording of the system response at the reference positions
![Scheme for replicating single obstacle crossings on a simulator [17]](https://static-01.extrica.com/articles/22930/22930-img3.jpg)
c) Offline approximation of the inverse transfer function
![Scheme for replicating single obstacle crossings on a simulator [17]](https://static-01.extrica.com/articles/22930/22930-img4.jpg)
d) Excitation of the corresponding shaker with the determined drive signal
2. Test bench setup
The test rig consists of a body-in-white, connected to the base plate at the front axle by a spring/damper system. The rear axle is mounted by springs, secured by tension belts. In the vehicle cab only the standard driver’s seat is installed. The vibrations are generated by inertial shakers. In contrast to hydraulic systems, which are predominantly used for high amplitudes in the low frequency range, the field of application of electrodynamic shakers is from 2 Hz to at least 1000 Hz. Thus, electrodynamic shakers can cover a large part of the comfort-relevant frequency range if sufficiently dimensioned. The acceleration that can be generated is dependent on both structural parameters and frequency [19]. The corresponding required displacement can be calculated by double time integration. The choice of electrodynamic shakers thus determines the lower limit of the simulated frequency range. The upper limit is defined by the human perception threshold and is set to 80 Hz like in standardized [4], [20] and non-standardized [5], [6], [7] evaluation methods. Four TV51140-IN inertial shakers from TIRA GmbH are currently implemented. Their points of excitation into the body is marked by the tips of the green triangles in Fig. 2(b). The yellow triangle represents another shaker position, which will be explained in a later section. The most important technical data are documented in Table 1. As can be seen in Fig. 2(a), the shakers are connected on the bottom side of the body-in-white. The excitation of the seat back can be seen in Fig. 2(a) and will be presented in detail later. The amplification of the excitation signals is ensured by BAA 1000 amplifiers by TIRA GmbH. The standard amplification factor is controlled by a manual potentiometer. Currently, a number of six triaxial, piezoelectric acceleration sensors are installed at the seat rail (front-left, front-right, rear-left) and at the footrest (left, right) and at the backrest (middle). Some of them are represented by circles in Fig. 2(b). The essential technical data of the acceleration sensors 356A17 by PCB Synotech are documented in Table 2.
Fig. 2Test bench setup
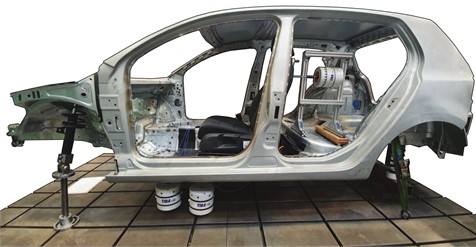
a) Setup of the ride comfort simulator
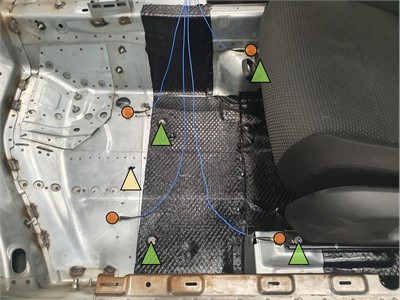
b) Schematic configuration of the electrodynamic shakers and accelerometers in the driver´s footwell
Table 1Technical data of the TV51140-IN electrodynamic shakers [21]
Key data | TV51140-IN |
Nominal force sinePk / noiseRMS | 400 N / 311 N |
Frequency range | 2 Hz – 2,000 Hz |
Maximum displacement peak-peak | 9 mm |
Table 2Technical data of the PCB-356A17 triaxial accelerometer [22]
Key data | PCB-356A17 |
Measurement range | ±98 m/s2 pk |
Sensitivity | 51 mV/(m/s2) |
Frequency range (±5 %) | 0.5 … 3,000 Hz |
Resonance frequency | ≥ 14,000 Hz |
3. Valuation methods
The suitability of the methods for evaluating the quality of replications depends on the characteristics of the investigated vibrations. The current paper focuses on small stochastic oscillations, which are superimposed by transient oscillations. The evaluation of purely stochastic vibrations is usually done by transformation into the frequency domain and comparison of frequency spectra. The application of Fourier transformation to the superimposed acceleration signals is only suitable to a limited extent, since the specific time information, e.g. front and rear axle events, are lost. For the evaluation of the superimposed acceleration signals, methods will be used which consider the transient vibration characteristics with more importance.
An investigation of the time domain is one approach. In this case, the waveforms of the target signal are compared with the replication waveforms . Hereinafter, the normalized mean squared error (NMSE) is applied, which uses the instantaneous acceleration values of the two signals and the mean value of the target signal . By applying the equation:
a benchmark for the evaluation of the replication performance is obtained. If is close to one, both signals are nearly concurrent, so that a high quality of replication can be assumed. Signals with slightly different frequencies or phase shifts and delays are poorly correlated with respect to Eq. (1).
In order to evaluate the transient single excitations in more detail, fundamental characteristics of these oscillations shall be considered. In [23] physical parameters were investigated which are suitable for the characterization of transient signals. The main parameters in [23] are visualized in Fig. 3. A parameter with a high correlation to the subjective ratings is the peak-to-peak parameter. It will be used as a criterion for assessing the shock intensity of the transient vibration. The other essential characteristic of transient vibration is the shock duration. Due to the partially superimposed vibrations from front and rear axle excitation, this parameter can only be determined approximately. In order to ensure a comparable setting for original and replicated signal, the specifications of [24] are referred to. This determination is based on the wheel carrier accelerations, which represent the initial time of shock. Based on this trigger value, fixed time durations are defined for the front axle and rear axle vibration. Thus, a sufficiently large time interval is considered to cover the complete oscillation process, especially for the rear axle. Since the fixed shock duration can thus not serve as a comparison criterion, another characteristic according to [23] shall be used instead. The area under the acceleration curve during the entire vibration process is applied as a reference value. Weighting the acceleration curve with the respective surface area illustrates the errors in the transient response better than the pure acceleration curve. Therefore, based on this weighted acceleration process, the is calculated.
Fig. 3Parameters of transient oscillation from [23]
![Parameters of transient oscillation from [23]](https://static-01.extrica.com/articles/22930/22930-img7.jpg)
The impact of deviations between replication an target signal on human perception can only be considered by taking the frequency domain into account as well, so that replication errors can be evaluated in this regard. Therefore, ISO 2631 [4] provides a method considering the frequency dependent effects on the perception and the acceleration amplitudes. The signal under examination is weighted by means of frequency dependent factors as part of this method. These factors differ for various excitation points (e.g. seat or foot rest) and also for the direction of impact (vertical, longitudinal, lateral acceleration). For this weighted acceleration , the fourth power is calculated and the integral is determined over the measurement period . According to:
the fourth power vibration dose value (VDV) is obtained by the fourth root of the integral value. Instead of the second power, the fourth power is used in accordance with [4] for shock-containing signals in order to weight these influences more significantly. Small differences in the VDV of replication and target signal thus indicate similar influences on human comfort perception.
To investigate the reasons of deviations, it is often necessary to consider the time-frequency domain. The wavelet transformation is a standard procedure for this calculation. Fischer-von Rönn [24] provides the methodology for evaluation of single obstacle crossings. Acceleration measurements at different positions are used to determine prediction models, which provide objective comfort ratings correlating to subjective ones. In the current paper continuous wavelet transforms were used to visualize errors in the time-frequency domain and to draw conclusions. The representation is done by wavelet tableaus, which plot the magnitudes of the complex wavelet coefficients versus time and pseudo-frequency. The wavelet coefficients of the acceleration signals were all normalized to a uniform value, so that comparability is given. Since this transformation always requires a trade-off between high time resolution and high frequency resolution, scaling is a decisive setting. The pseudo frequency range is the result of the scaling and is set up to 40 Hz in this paper. To provide a well-arranged illustration, the range 40 Hz 80 Hz is not depicted, because the vibration components in this frequency band are relatively small and can therefore hardly be detected optically, but the frequency range from 40 Hz to 80 Hz is considered in the performance evaluations.
4. Extension of the seat rail excitation to a MIMO system
The general requirements for the evaluation of mechanical vibrations and shocks on humans are defined in ISO 2631. Different cases have to be classified. Since this simulator is designed to simulate comfort-relevant vibrations, the subareas of health risk, perception threshold and motion sickness are neglected. In this paper, only the influence on the seated person is considered. Accordingly, different interfaces between human and the source of vibrations must be taken into account.
The extension to a MIMO system requires on one hand more than one shaker. On the other hand, the comfort simulator should (in the next development step) be part of a driving simulator including a motion system. The motion system limits the pay-load, and therefore, the number of shakers has to be restricted. The evaluation of the correlation between the measured accelerations at the seat rail front left () and back left () respectively front right () show that the correlation is clearly different compared to 0.75. This means that the signals at the front left and back left seat rails are more similar than the signals at the front left and front right seat rails. Fig. 4 represents the transfer functions from the shaker front left to the three measurement points. Here it becomes obvious that the transfer behavior from the front left shaker to the front left and back left sensors are similar in the frequency range 10 Hz 30 Hz. The similarities between shaker front left and shaker front right are only evident in narrow frequency bands, e.g. 20 Hz 24 Hz and 32 Hz 38 Hz. As the number of shakers has to be restricted (due to payload), a second shaker is placed near the front right seat rail and not near the back left seat rail.
The results again refer to the simulation of a single obstacle crossing of a negative step with a height of 20 mm. The replications at the seat rail front left (Fig. 5(a)) and front right (Fig. 5(b)) show that the quality of the replication is quite good. All acceleration signals were filtered in the frequency range 13 Hz 80 Hz. The lower frequency limit had to be raised from 10 Hz, as it was still chosen for the SISO replication, because in some replications the displacement limit of the electrodynamic shakers was reached. Therefore, the simulated lower frequency limit was set to 13 Hz for all signals in this paper. Both, the shock intensity of the two axis excitations and the oscillation are successfully reproduced on both sides.
Fig. 4Frequency response functions of different transfer paths
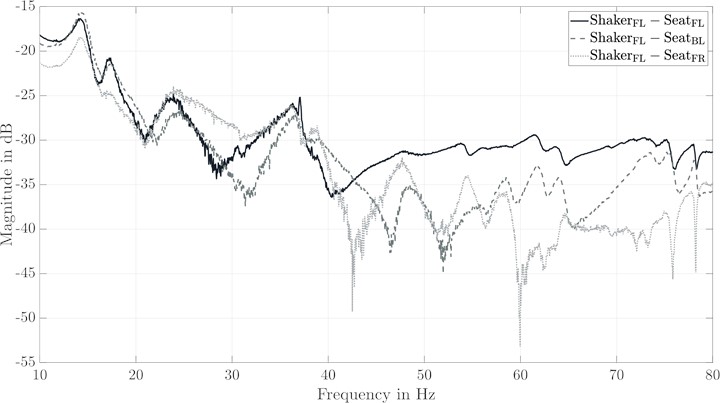
Fig. 5Comparison of the replications at the controlled seat rail measurement points
a) Acceleration of original and replication signal at seat rail front left
b) Acceleration of original and replication signal at seat rail front right
At the seat rail back left (Fig. 6), the replication is significantly worse. This was to be expected, because no shaker was implemented at this position. The shock intensities on the front and rear axles have been reproduced surprisingly well. The transient response is less damped and thus causes the deviations from the original.
Considering the fourth power vibration dose value according to ISO 2631, like it is shown in Table 3, these deviations are less relevant in terms of comfort. The delay between the original and the replication does not cause an error term due to the integral over the entire duration.
Fig. 6Acceleration of original and replication signal at seat rail back left
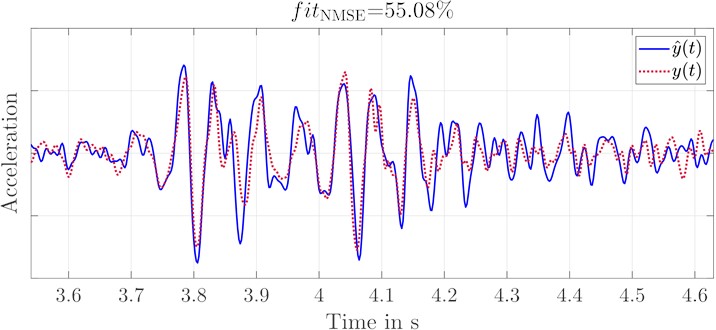
Table 3Comparison of the VDV at the seat rail measurement points
Sensor position | Fourth power vibration dose value | ||
Original in m/s1.75 | Replication in m/s1.75 | ||
Front left | 0.6118 | 0.5359 | 88 % |
Front right | 0.7492 | 0.6494 | 87 % |
Back left | 0.5449 | 0.6432 | 82 % |
5. Extension of the system by foot rest excitation
The foot rest is another point of contact between the seated person and the vibration source. For human comfort perception, only the vertical vibrations are significant at this position for purely stochastic roadway excitations. The longitudinal and lateral accelerations are negligible [25]. Research on the detailed influence of the footrest vibrations in the case of shock-induced accelerations covers only vertical vibrations [8]. Therefore, the information gained by stochastic excitations is used and only vertical foot rest accelerations are simulated. The positions of the foot contact are dependent on the person and the vehicle, because a vehicle with automatic gearbox expects a different positioning of the left foot than a vehicle with manual gearbox. In this paper, a distinction is made between the left and right foot contact in order to be able to reproduce details. For the correlation determination, random acceleration measurements from rides of different roadway conditions (with and without single obstacle crossing) were analyzed. The correlation of the acceleration signals can be calculated to 0.73 on average. However, the correlation is quite dependent on the kind of the examined signal. In this case, the purely stochastic signals have a correlation of 0.63 and the single obstacle crossings 0.84. To keep the amount of shakers low, as described in the previous section, only one shaker is implemented in the first step. This shaker is implemented approximately in the center, as far as the structure of the body-in-white allows, between the two sensors. This position is shown by a yellow triangle in Fig. 2(b). The transfer function from this shaker to the two sensors on the left and right can be seen in Fig. 7.
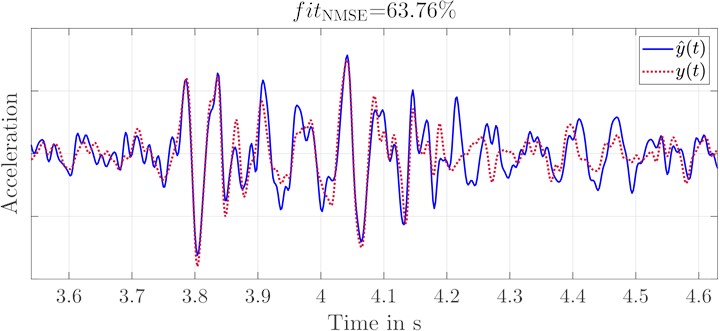
The deviations of the transfer behavior to the left and right sensor are clearly visible for the entire frequency range, with the exception of small ranges. The consequence of these differences is that the replications at two positions cannot be replicated by a single shaker (cf. Fig. 8). The deviations in shock intensity and transient response are clearly recognizable and also quantified by .
Fig. 7Frequency response functions of different transfer paths
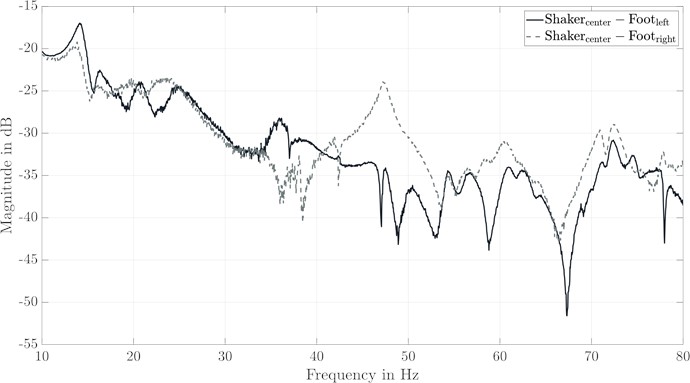
Fig. 8Comparison of the replications with a single shaker
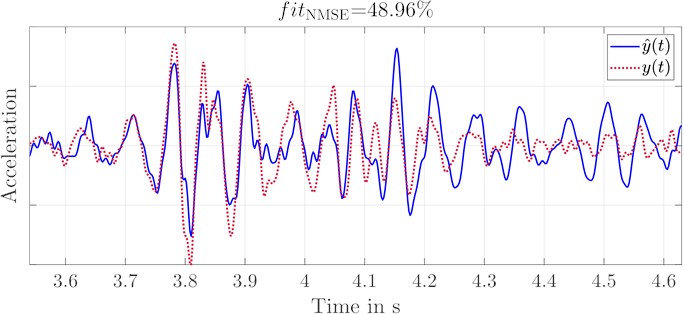
a) Acceleration of original and replication signal at foot rest left with a single shaker
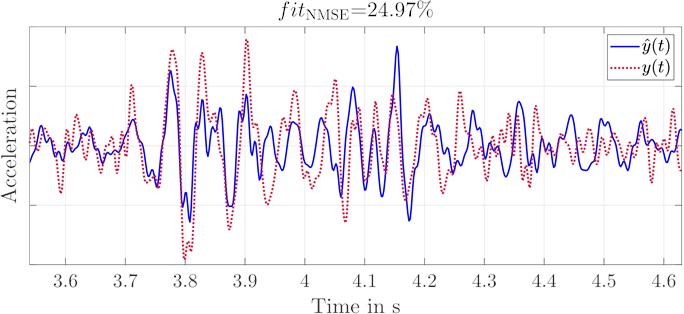
b) Acceleration of original and replication signal at foot rest right with a single shaker
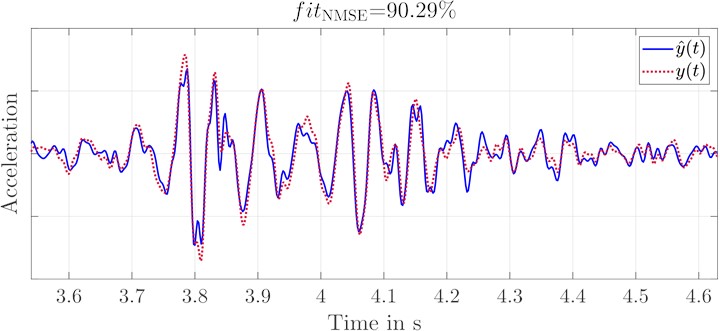
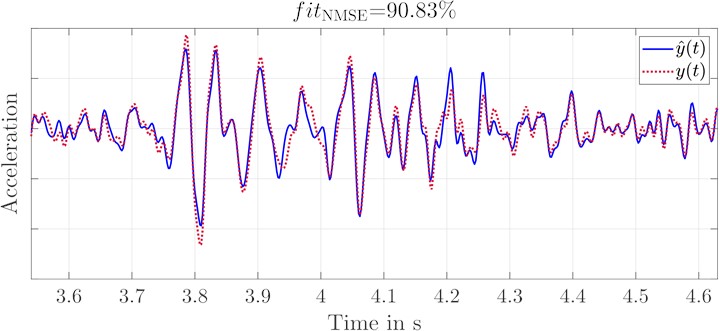
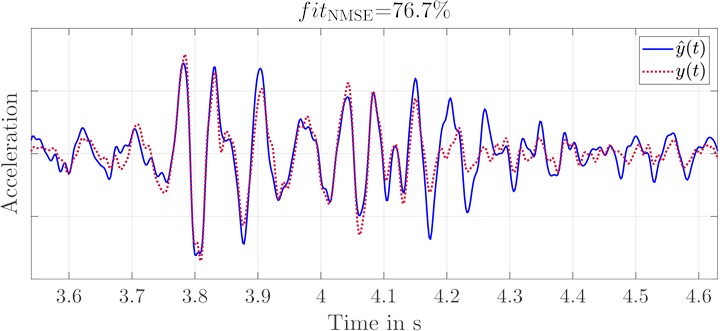
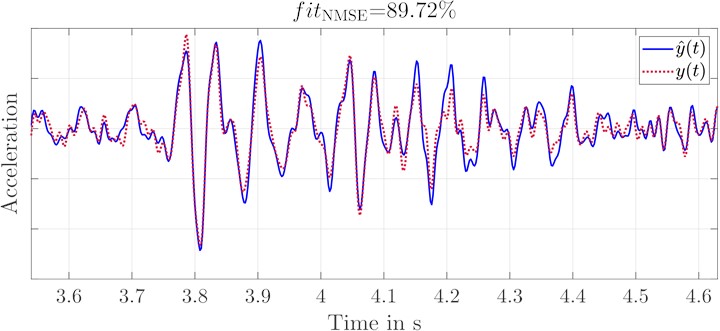
As a consequence of this insufficient replication, two shakers will be implemented on the left and right side instead of the one shaker in the center. This adjustment is again very successful and achieves very good replications, as can be seen in Fig. 9.
Fig. 9Comparison of the replications with two shakers
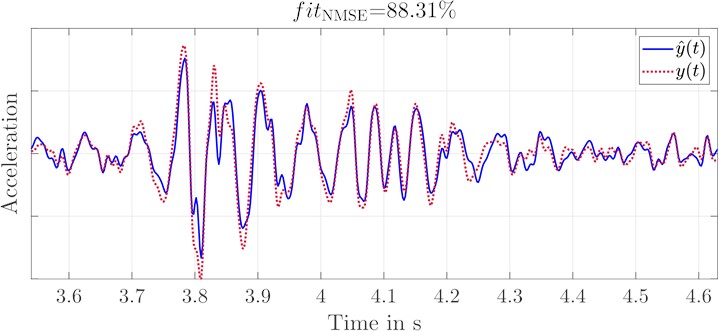
a) Acceleration of original and replication signal at foot rest left with two shakers
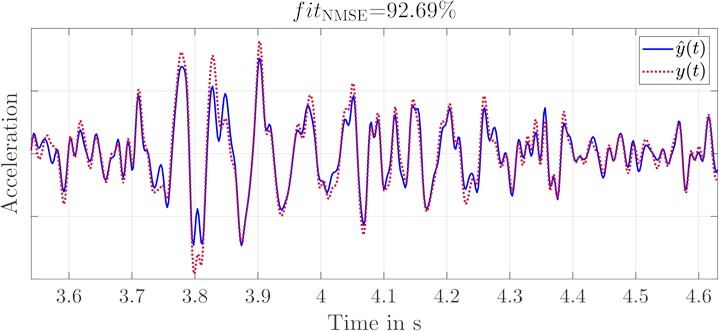
b) Acceleration of original and replication signal at foot rest right with two shakers
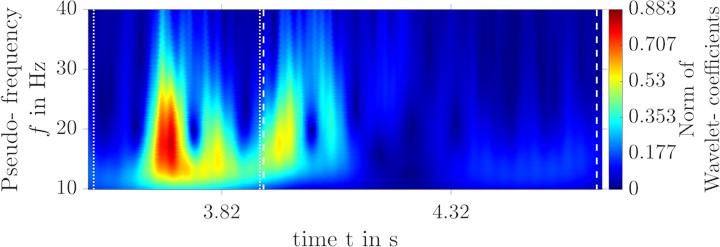
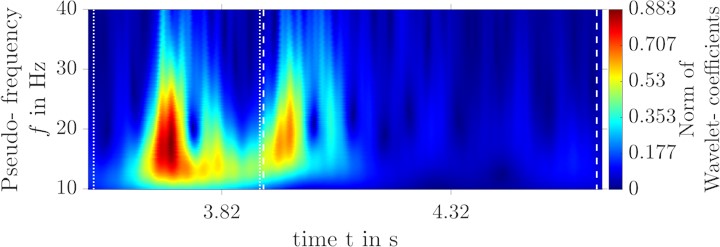
Deviations can only be seen in the shock intensity of the front axle replication. In Fig. 10, the wavelet transform of the replication is compared to that of the original signal. The two vertical dotted lines mark the section of the front axle excitation, the dashed lines the section of the rear axle excitation. From a purely qualitative point of view, a successful replication for both axle crossings can be seen for both sides. The erroneous replication of the shock intensity of the front axle excitation in Fig. 9 can be narrowed down to the frequency range 13 Hz 25 Hz by using the wavelet transformation in Fig. 10. The mentioned frequency range is quite strongly represented in the front axle acceleration.
Table 4Comparison of the VDV at the foot rest measurement points
Sensor position | Fourth power vibration dose value | ||
Original in m/s1.75 | Replication in m/s1.75 | ||
Foot left | 0.6968 | 0.5380 | 77 % |
Foot right | 0.7524 | 0.6227 | 83 % |
In Table 4 the values of VDV are given. Since the low frequency ranges have to be rated higher for human comfort perception, these deviations have a significant impact on the quality of the replications according to ISO 2631. A possible explanation for the erroneous replication is that the noise-based excitation signal for the nonlinear system identification did not achieve the necessary amplitudes in the corresponding frequency range. This influence was taken into account in the further sections.
Fig. 10Wavelet transform of the original and replication signals using two shakers
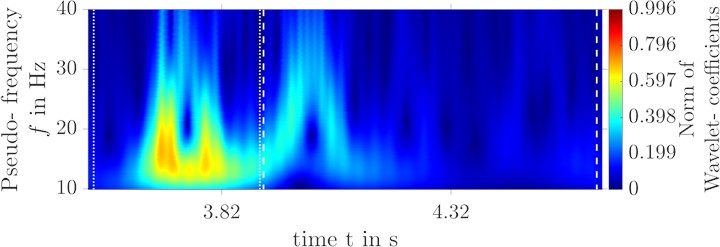
a) Wavelet transform of the replication at foot rest left
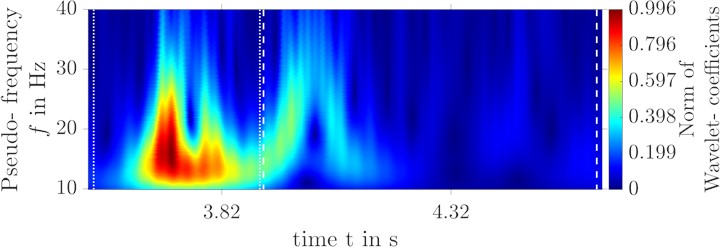
b) Wavelet transform of the original signal at foot rest left
c) Wavelet transform of the replication at foot rest right
d) Wavelet transform of the original signal at foot rest right
6. Extension of the system by seat back excitation in longitudinal direction
Even if the majority of roadway-excited vibrations are perceived as vertical vibrations, longitudinal vibrations must not be completely disregarded. The ISO 2631 [4] evaluates the longitudinal vibrations also as a function of frequency separately for each excitation point. As already mentioned, the longitudinal vibrations at the footrest have only a minor influence on the human perception of comfort. Of even less importance for comfort are the longitudinal vibrations at the seat surface. The vibrations of the seat back have the largest impact in the longitudinal direction. With 20.5 % these vibrations (under stochastic excitation) have the second largest influence on the total perception of comfort [25]. Therefore, it is very surprising that seat back excitation is applied in comfort simulator design so rarely. Longitudinal dynamic excitation is not possible for every kind of simulator, e.g. simulator based on a 4-poster system. Flat belt test rigs make replication of longitudinal vibrations very feasible, as Berberich [26] shows. In his work, he replicates the accelerations at the seat rail in the vertical and longitudinal directions. The evaluation of the frequency spectrum shows very good replications of the longitudinal vibrations in the range 0.7 Hz 25 Hz. The remaining replicated range up to 40 Hz again shows significant deviations. No evaluation of the time or time-frequency domain is conducted, so that no assessment of the replication of transient signals can be made. According to Knauer [14], the replications of longitudinal vibrations of the seat back can also be done on the flat-belt test rig. However, in his work he focuses on the objectification of vibration comfort and not on the accurate replication of acceleration signals. As disadvantages of his test rig he mentions the too small frequency range ( 40 Hz) and the very long iteration times for adapting the drive signals, which thus caused significant limitations for his studies. As a third limitation, he mentions the missing possibility for selective control of certain excitation points. The approach in this paper could thus eliminate such limitations by using an electrodynamic shaker, which can easily cover the higher frequency range. This shaker is coupled directly to the seat back so that a short and simple transmission path minimizes errors. Furthermore, the excitation of a single reference point can be done separately, even if mutual interference cannot be completely eliminated. In order to enable a large field of investigations, a quick exchange of vehicle seats should be feasible. The connection is shown in Fig. 11.
Fig. 11Connection of the shaker to the seat backrest
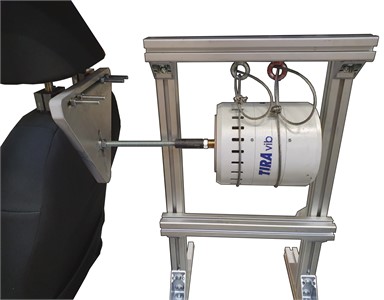
The neck rest mounting serves as the joint to the shaker. The triangular plate is pressed as tightly as possible against the seat by a screw fitting so that the connection has as little play as possible. A spacer rod is screwed to the plate in a slotted hole and connected to the shaker. This allows a height offset, especially for adjusting the seat tilt. The TV 51112 electrodynamic shaker used has a mass of 13 kg. Because the spacer rod and the construction would be too stressed by the acting moment, the dead weight must be held by another construction. This construction has to be adapted to the corresponding simulator body. In this case, the construction is placed on the back seat of the body-in-white. However, mounting it via the roof of the body would also be an option, so that the cables would be even longer, resulting in a more undisturbed oscillation. In the following, a relative coordinate system to the seat back is defined as the longitudinal direction, which was also done that way when data was recorded [24]. The accelerometer is attached centrally on the upper part of the seat frame, approximately at shoulder height.
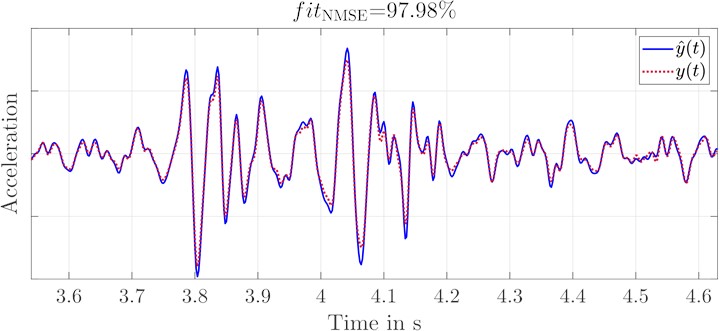
The result of the exemplary replication of the negative edge can be seen in Fig. 12. The frequency range of the replication here was again set to 13 Hz 80 Hz for uniformity. Since the oscillations are significantly less damped, replications of the signal for 10 Hz can be performed easily and with the same replication quality. The replication is almost identical to the original signal. The design for fast coupling of the shaker to the seat has no negative effect in the simulated frequency range.
Fig. 12Acceleration of original and replication signal at back rest for a SISO approach (without the other four shakers)
7. Combination of seat rail, foot rest and back rest excitation
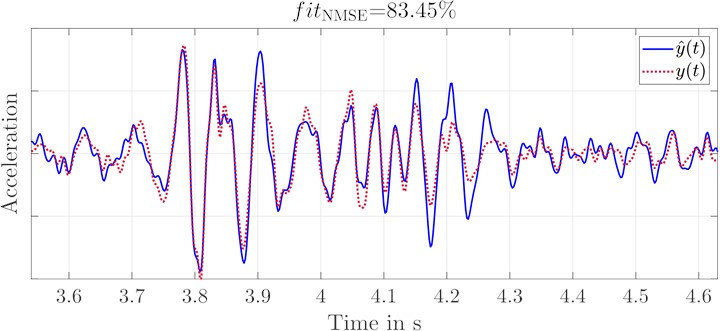
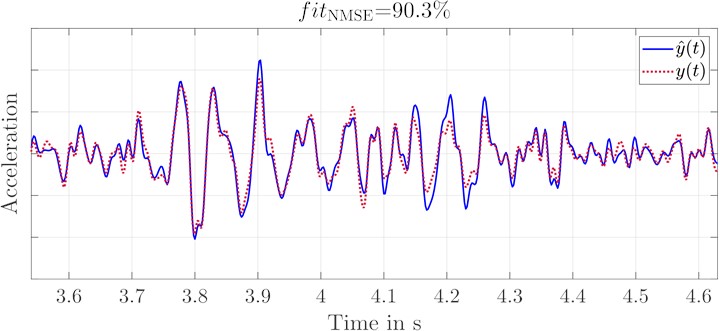
In the previous sections it was shown that the various accelerations at the contact points between the human and the vehicle can be replicated very well. Considered separately, both the MIMO replications at the seat rail and the foot rests and the SISO replication at the backrest of the seat in the longitudinal direction performed very well. Due to the mutual influence, the separate drive signals cannot simply be combined. Simultaneous excitation with noise-based test signals of all shakers and recording of the corresponding responses at the measurement points is therefore necessary for a full MIMO system identification process. The choice of excitation signals will not be considered in this paper due to the complexity of the subject area. The results of replication at all five measurement points simultaneously can be seen in Fig. 13. The replication of the longitudinal seat back acceleration shows the largest errors, although it achieved the best results with single excitation. Because the seat back is directly coupled with the sitting surface respectively with the seat rail, the longitudinal vibration is obviously also influenced by the vertical excitation. This influence is relevant for the excitation of the system identification as well as for the replication itself. If the error occurs in the replication directly, then running the identification algorithm multiple times with the same identification data set would show a greater change in the error. However, the tests made cannot confirm this and consistently show similar errors in the replication of the seat back acceleration. Therefore, it is assumed that the error is caused by the excitation for system identification.
Another experiment confirms this assumption. For this purpose, the noise-based excitation signal with the previous gain was excited at the seat rails and the foot rests. For the seat back excitation, the amplification of the noise-based signal was increased. The transfer functions were determined using the corresponding measurement data sets, resulting in the exemplary inverse transfer functions:
for the increment levels. These are thereby characterized by . Afterwards, the determined inverse transfer functions are tested with the measurement data set itself and a validation data set. For instance, the simulated signals for result in:
Finally, the simulated signal is compared with the actual signal , respectively with . The validation dataset corresponds to the configuration that the gain at the seat back is equal to , as it was executed in the isolated approach. This ensures that the validation data set represents a suitable configuration. The quality of the simulated replications is shown in Table 5.
Fig. 13Comparison of the combined replication
a) Acceleration of original and replication signal at food rest left
b) Acceleration of original and replication signal at food rest right
c) Acceleration of original and replication signal at seat rail left
d) Acceleration of original and replication signal at seat rail right
e) Acceleration of original and replication signal at back rest
With increased gain of the seat back excitation compared to the excitation of the other measurement points, the replication quality of the measurement data set increases. With increased amplification of the seat back excitation compared to the other points, the replication quality of the measurement data set increases as well. This is because of the signal-to-noise ratio (SNR). Considering the frequency range of the replications, so they are most erroneous for 30 Hz 50 Hz. With increasing gain, this error decreases continuously. If the magnitudes of the transfer functions for the remaining excitation points are summed and compared with the magnitude of the seatback shaker, this effect becomes apparent. The accelerations of the remaining excitation points together have a higher influence on the accelerations at the seat back, in this frequency range, than this excitation itself. This results in a poor SNR, which is linked to erroneous replications. There is no improvement in scaling the gain of the excitation signal at the seat back too high, as the replications of the validation data set show. The quality initially increases with increasing amplification, but then drops again significantly. This leads to the conclusion that the adjustment of the excitation signals has a high influence on the quality of the replications and therefore it has to be considered in more detail.
Table 5Effect of the signal-to-noise ratio of the noise-based excitation signal on the simulated replication quality
measurement data set | validation data set | |
0.5 | 0.5 | |
0.76 | 0.92 | |
0.87 | 0.97 | |
0.92 | 0.94 | |
0.95 | 0.87 | |
0.97 | 0.78 | |
0.98 | 0.7 |
Table 6Evaluation according to the parameters for transient oscillation
Front axle | Rear axle | Front axle | Rear axle | Front axle | Rear axle | |
95 % | 55 % | 95 % | 77 % | 93 % | 70 % | |
93 % | 86 % | 97 % | 89 % | 94 % | 85 % | |
95 % | 99 % | 95 % | 66 % | 80 % | 59 % | |
93 % | 94 % | 90 % | 66 % | 88 % | 64 % | |
99 % | 93 % | 94 % | 79 % | 93 % | 81 % | |
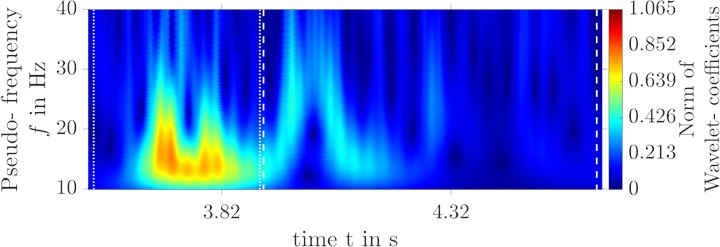
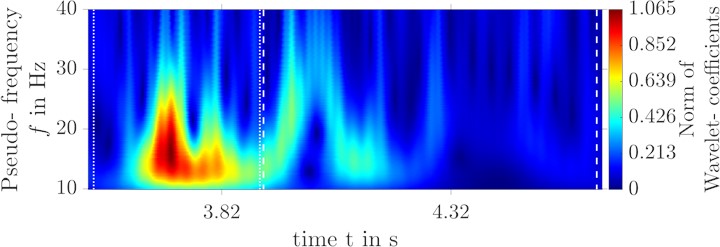
The differences in the replication qualities between the left and right sides are also quite obvious. By applying the evaluation criteria for transient oscillations (Table 6) this error shall be quantified. It becomes apparent that the maximum amplitude difference, the peak- to-peak value, at the front axle is replicated quite well for all signals. The result is similar for the rear axle except for the left foot rest. The area under the acceleration curve for the rear axle also shows that the error at the seat rail left is higher than at the right side. The surface areas for the accelerations of the footrests differ to a comparable level. The transient response is disturbed at both left measurement points, so that significant peaks occur in the acceleration of the rear axle. The acceleration curve weighted with the surface area summarizes these errors very well, so that it becomes obvious that the left side achieves similarly good replications of the front axle, but the replication of the rear axle is significantly worse. Once again, this can be remedied by adjusting the noise-based excitation signals for system identification. A reduction of the amplitudes of all noise-based excitation signals by 10 % improves the replication from the seat rail left by 19 % in the weighted NMSE value of the rear axle. Exemplary this shall be considered in the time-frequency domain in Fig. 14. The replication of the single obstacle is again very well reproduced in terms of quality. But also quantitatively it were strongly improved, so that only small differences are detectable.
Fig. 14Wavelet transform of the original and replication signals at the seat rail left with adapted gain of noise- based excitation signal
a) Wavelet transform of the replication at seat rail left
b) Wavelet transform of the original signal at seat rail left
8. Conclusions
In this paper, the existing comfort simulator, based on a body-in-white and electrodynamic shakers, is tested for multiple-input multiple-output (MIMO) capability. The simulator will be applied in the replication of accelerations from single obstacle crossings. The electrodynamic shakers are installed in the immediate vicinity of the main transfer points: seat rail, footrest and seat back. Therefore, the vehicle-specific transfer paths in the simulator vehicle have less influence on the simulation quality than, for instance, with excitation via the wheels. An exact replication of the vertical vibrations at the seat cannot be achieved with a single shaker. The result of the correlation analysis shows that in addition to the shaker on the front left seat rail, a second one should be installed on the front right seat rail. The error on the seat rail at the rear is existent, but acceptable from a comfort-relevant point of view. Due to the relatively low complexity of the bottom plate, the replication of the accelerations at the foot rests was initially tested with one shaker. The achieved simulation quality is not satisfactory, so that a second shaker has to be implemented as well. This adjustment improves the simulation result significantly. Errors affect the shock intensity of the front axle excitations in particular. The integration of the seat back excitation is a decisive difference to many other comfort simulators, which provides a high degree of flexibility. The simple change of the driver's seat is ensured by a shaker connection to the headrest. Excellent results are achieved considering pure SISO cases. When combining all shakers simultaneously, the seat back replication achieves the worst results, caused by incorrect transient response. Differences in the reproduction quality between the left and right side become obvious. The errors can be explained by the setting of the noise-based excitation signals. Overall, high replication qualities are achieved at the mentioned excitation points, which is also evidenced by the comfort evaluation for shock-containing signals according to ISO 2631. By extending the described method for reproducing single-obstacle crosssings to MIMO systems, comfort-relevant oscillations can be reproduced much more realistically and accurately at multiple excitation points. Due to the in principle independent control of separate areas, various research fields of comfort evaluation will become accessible or can be investigated in even more detail. In further research, the transferability of these results to a driving simulator with a different body and connection to a hexapod system will be investigated.
References
-
“ISO 13473-1:2019-characterization of pavement texture by use of surface profiles-part 1: Determination of mean profile depth,” International Organization for Standardization, 2019.
-
K. Löhe, FAU Studien aus der Elektrotechnik(12). (in German), FAU University Press, 2018, https://doi.org/10.25593/978-3-96147-102-7
-
Bernd Heißing and Metin Ersoy, Chassis Handbook: Fundamentals, Driving Dynamics, Components, Mechatronics, Perspectives. Wiesbaden: Vieweg+Teubner, 2011, https://doi.org/10.1007/978-3-8348-9789-3
-
“ISO 2631-1:1997 – mechanical vibration and shock – evaluation of human exposure to whole-body vibration: Part 1: General requirements,” International Organization for Standardization, 1997.
-
I. Rericha, “Methods for objective evaluation of ride comfort,” (in German), Automobil-Industrie, Vol. 86, No. 2, pp. 175–182, 1986.
-
Burkhard Klingner, “Effect of engine mounting on vibration comfort and noise excitation in motor vehicles,” (in German), Ph.D. thesis, Technische Universität Braunschweig, 1996.
-
Dieter Hennecke, For the evaluation of the vibration comfort of passenger cars under instationary excitations, volume Nr. 237 of Fortschritt-Berichte / VDI Reihe 12. (in German), Verkehrstechnik, Fahrzeugtechnik, 1995.
-
Stojan Cucuz, “Vibration perception of car passengers: Effect of stochastic unevenness and single obstacles of the real roadway,” (in German), Ph.D. thesis, Technische Universität Braunschweig, 1992.
-
E. Enders, G. Burkhard, F. Fent, M. Lienkamp, and D. Schramm, “Objectification methods for ride comfort,” Forschung im Ingenieurwesen, Vol. 83, No. 4, pp. 885–898, Dec. 2019, https://doi.org/10.1007/s10010-019-00361-6
-
G. Burkhard, T. Berger, E. Enders, and D. Schramm, “An extended model of the ISO-2631 standard to objectify the ride comfort in autonomous driving,” Work, Vol. 68, No. s1, pp. S37–S45, Jan. 2021, https://doi.org/10.3233/wor-208004
-
N. Mohajer, H. Abdi, K. Nelson, and S. Nahavandi, “Vehicle motion simulators, a key step towards road vehicle dynamics improvement,” Vehicle System Dynamics, Vol. 53, No. 8, pp. 1204–1226, Aug. 2015, https://doi.org/10.1080/00423114.2015.1039551
-
Michael A. Bellmann, “Perception of whole-body vibrations: from basic experiments to effects of seat and steering-wheel vibrations on the passenger’s comfort inside vehicles,” Ph.D. thesis, Universität Oldenburg, 2002.
-
L. D. Chen, Yiannis Papelis, Ginger Watson, and Dario Solis, “NADS at the university of Iowa: a tool for driving safety research,” in Proceedings of the 1st Human-Centered Transportation Simulation Conference, 2001.
-
P. Knauer, “Quantification of vibrational comfort during instationary excitation by road surfaces,” (in German), Ph.D. thesis, Technische Universität München, 2010.
-
K. Riedl, S. Schaer, J. Kreibich, M. Lienkamp, S. Cannon, and C. Schimmel, “Ride comfort evaluation of predictive ride height and damper control adaptation on single obstacles,” in Internationales Stuttgarter Symposium, pp. 223–235, 2020, https://doi.org/10.1007/978-3-658-29943-9_20
-
N. Bulthaupt and F. Gauterin, “Time and magnitude dependent masking effects of vehicle’s 2 Hz shock type vibrations on the perception of vehicle’s 4.5 Hz longitudinal shock type vibrations for seated human subjects,” International Journal of Vehicle Noise and Vibration, Vol. 15, No. 4, p. 256, 2019, https://doi.org/10.1504/ijvnv.2019.107903
-
K. Reichel and M. Meywerk, “Acceleration signal simulation induced by single obstacle crossings by means of nonlinear, block-oriented models for an automotive comfort simulator,” Proceedings of the Institution of Mechanical Engineers, Part D: Journal of Automobile Engineering, pp. 1-14, Sep. 2022, https://doi.org/10.1177/09544070221124716
-
F. M. Reich, P. J. T. Venhovens, J. H. Bernasch, and J. P. Löwenau, “Optimized Haptical, Acoustical and visual tuning with different vehicle dynamic models for the BMW driving simulator,” Vehicle System Dynamics, Vol. 29, No. sup1, pp. 648–654, Jan. 1998, https://doi.org/10.1080/00423119808969592
-
G. Lang and D. Snyder, “Understanding the physics of electrodynamic shaker performance,” Sound and Vibration, pp. 24–33, 2001.
-
“BS 6841:1987-Guide to Measurement and evaluation of human exposure to wholebody mechanical vibration and repeated shock,” British Standards Institution, 1987.
-
Inertial vibration test system TV51140-IN, TIRA GmbH, (accessed 05 April 2022), https://www.tira-gmbh.de/fileadmin/inhalte/download/schwingprueftechnik/schwingpruefanlagen/inertial/EN/data_sheet_system_tv_51140-IN_eng_V07.pdf
-
Triaxial ICP accelerometer 356A17, PCB Synotech, (accessed 05 April 2022), https://www.synotech.de/produkte_skript/downloads/specs/356A17_specs.pdf
-
Klaus-Peter Fülbier and Jan Welm Biermann, “System approach for the investigation and evaluation of the vibration comfort of motor vehicles when passing single obstacles,” (in German), Ph.D. thesis, Rheinisch-Westfälischen Technischen Hochschule Aachen, 2001.
-
N. Fischer-Von Rönn and M. Meywerk, “Predicting the ride comfort of passenger cars for single-obstacle crossings through an innovative feature extraction method consisting of non-linear geometric approximations of wavelet-transformed acceleration data and airborne sound,” Proceedings of the Institution of Mechanical Engineers, Part D: Journal of Automobile Engineering, Vol. 228, No. 4, pp. 357–369, Mar. 2014, https://doi.org/10.1177/0954407013508277
-
M. Mitschke and B. Klingner, “Schwingungskomfort im Kraftfahrzeug,” (in German), ATZ – Automobiltechnische Zeitschrift, Vol. 100, No. 1, pp. 18–24, Jan. 1998, https://doi.org/10.1007/bf03221476
-
Thomas Berberich, “Subjective riding comfort evaluation in a simulator,” (in German), Ph.D. thesis, Technische Universität München, 2016.
About this article

The authors have not disclosed any funding.
The datasets generated during and/or analyzed during the current study are available from the corresponding author on reasonable request.
The authors declare that they have no conflict of interest.
