Abstract
In order to ensure the safety of utility tunnel, the response of each measuring point of the utility tunnel at different speeds is analyzed under the condition that half of the vehicle body is within the boundary of the utility tunnel. The influence of different speeds on the structure of the utility tunnel under the same working condition is discussed, and the dynamic stress variation law of the utility tunnel under actual traffic load is analyzed. The results show that the influence of vehicle speed on the left wall and axillary of the longitudinal utility tunnel is greater than that of the cross-section. The peak values of transverse tensile stress and compressive stress of the right side wall are the largest. The peak transverse stress of the left wall is only 1/3 of that of the right wall. The peak value of the longitudinal compressive stress of the left wall is the largest. The peak value of longitudinal tensile stress of roof is the largest. In the design and construction, the weak position should be reinforced.
Highlights
- Sinusoidal equivalent load is used in the numerical simulation of pipe gallery structure
- The transverse stress has little effect on the change of vehicle speed
- The law of stress change of pipe gallery under different speed is obtained
1. Introduction
With the city's high demand for basic resources such as electricity, communication, water supply and gas, the construction and development of utility tunnel is imminent. Utility tunnel avoid unnecessary waste of resources caused by repeated excavation of road surface, prolong road service life, and ensure smooth traffic and relative harmony of urban landscape. Therefore, it is important to study the dynamic stress of utility tunnel under traffic load for the development of utility tunnel.
At present, many scholars both here and abroad have explored the interaction between load and road surface, load and pipeline through theoretical analysis and finite element numerical simulation. Zhimin Wang [1] summarized the research status of simplified traffic load and static and dynamic response of buried pipeline. The finite element model was fitted and validated by theoretical analysis, numerical simulation and example verification combined with field test. The research shows that the adverse effects of dynamic traffic load on buried pipelines are mainly reflected in vertical vibration of pipelines and permanent settlement under repeated loads. Tong Guo et al. [2] obtained the probability distribution function of multi-peak vehicle load through the actual measurement and statistical analysis of the vehicle running conditions on Beijing-Shanghai Expressway. Finally, the 0.95th percentile of the maximum distribution of various vehicle loads in the subsequent service period is taken as the evaluation load for the residual reliability study of the bridge. Wanshui Han et al. [3] analyzed the bridge dynamic response and bridge safety caused by heavy vehicle crossing bridge and obtained the traffic load characteristics of heavy vehicle. Xiaogang Wu [4] established the stress model of the foundation beam structure of the pipeline under long-term uniform traffic load and analyzed the mechanical characteristics of the pipeline under static load. On the basis of the corresponding model, an analytical solution is proposed for the vibration response results of soil mass. Xun Li [5] calculated and analyzed the mechanical properties of buried pipelines under traffic loads. The pipe diameter has great influence on the vertical displacement of the pipeline. Fei Tian et al. [6] verified the law of vehicle traffic load transfer under the road by using finite element simulation software. The results show that it is a more reasonable simulation method to simulate traffic load by using sinusoidal formula with parameters. Xinliang Li et al. [7] applied linear elasticity theory to study the mechanical response characteristics of pipeline structure under traffic load. The comparison between theoretical calculation method and test results shows that it is reasonable to use static calculation method to analyze the stress problem of buried pipeline under vehicle load. Bin Zhang et al. [8] established a three-dimensional finite element model through solid engineering and analyzed the mechanical and deformation characteristics of the double-compartment utility tunnel in soft soil foundation under vehicle load. The analysis shows that the horizontal displacement of the pipe gallery is positive for the bottom plate and negative for the top plate, regardless of the location of the partition wall or the side walls on both sides, but the horizontal displacement of the partition wall and the side walls on both sides varies with the height and has different zero value points. Yong Quan [9] established a simplified model based on the influence of vehicle load on the stress and deformation of the utility tunnel structure and used the model to analyze the internal force and deformation law of the utility tunnel structure under vehicle load. Yi Huang [10] studied the structural stress and component displacement characteristics of heavy vehicle loads passing through the utility tunnel structure vertically under two-dimensional working conditions.
Because the vehicle load mainly acts on the road surface and bridge structure, most of the research results both here and abroad mainly focus on the influence of vehicle load on road and bridge structure, but few on the impact of traffic load on the utility tunnel. The existing research on utility tunnel is mainly based on finite element numerical simulation. There is a certain gap between its model assumptions, simulation results and the actual engineering situation.
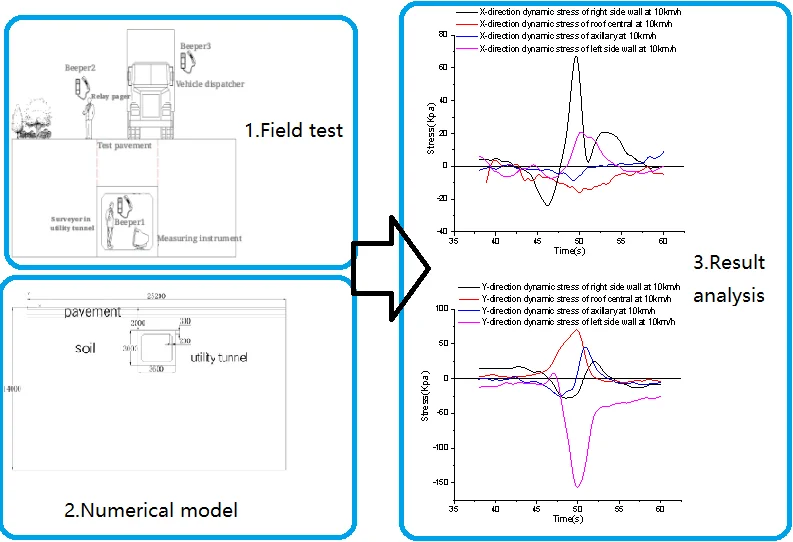
Therefore, this paper tests the response of each measuring point of the utility tunnel at different speeds, and analyses the dynamic stress variation law and the roof acceleration response characteristics of different parts of the utility tunnel, in order to provide reference value for the study of the effect of vehicle load on the underground structure such as the utility tunnel.
2. Experimental design
2.1. Model scheme
The site of this utility tunnel test is located in Jishou City, Hunan Province. The standard cross-sectional dimension of the utility tunnel project is 3.6 m×3.0 m, and the net dimension is 3.0 m×2.4 m. The standard prefabricated section of utility tunnel adopts C40 aggregate graded waterproof concrete with impermeability grade P6, cushion concrete C20, thickness 200 mm; steel bar HPB300, HRB400; anchorage length of steel bar: HPB300 grade steel 30d, HRB400 grade steel 40d; steel bar protective layer thickness: the thickness of water-facing protective layer is 50 mm, the rest is 30 mm; under the C20 plain concrete cushion of utility tunnel floor, 200 mm high is recommended for foundation pit excavation. The height of 200 mm is used for error adjustment space. After the foundation and foundation pit pass the acceptance test, good gradation gravel paving is used to compact the foundation to adjust the flatness of the gallery floor.
2.2. Test plan
In order to study the deformation of the utility tunnel in different directions, the cross-section direction of the utility tunnel is and the longitudinal direction of the utility tunnel is . The experimental schematic diagram is shown in Fig. 1.
Aiming at the condition that half of the vehicle body is within the utility tunnel limit, the response of each measuring point of the utility tunnel at different speeds is analyzed to understand the influence of different speeds on the structure of the utility tunnel under the same working condition, and to explore the deformation characteristics of the utility tunnel under the actual traffic load.
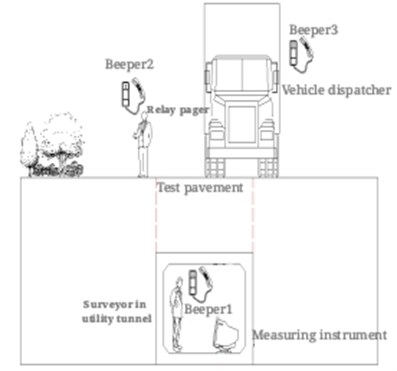
Because the utility tunnel is below the ground, the commonly used mobile communication function cannot be used in the utility tunnel. Real-time walkie-talkie paging is needed to complete the coordination of vehicle scheduling and data acquisition in the utility tunnel. According to the driving condition of the vehicle, half of the body of the vehicle is located within the boundary of the utility tunnel, as shown in Fig. 2.
In order to observe the deformation of the utility tunnel structure, the measuring points of the cross section of the utility tunnel are shown in Fig. 1. Point 1-4 in the figure is the stress measuring point, each measuring point has two directions of stress components, namely: the cross-section stress component of the utility tunnel, recorded in the direction; the longitudinal stress component of the utility tunnel, recorded in the direction. Point No. 5 is the roof acceleration measuring point, which is used to observe the vertical vibration of the roof of the pipe gallery. Point No. 6 is the data acquisition system.
Fig. 1Measurement of pipe cross section
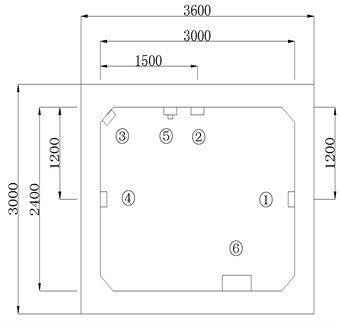
Fig. 2The half body within the boundary of structure
3. Finite element model
By using ABAQUS software to establish a two-dimensional model, the plane layout of pavement, subgrade soil, utility tunnel cross section and other structures is shown in Fig. 3. In order to eliminate the influence of boundary effect, solid model with length × width of 25.2 m×14.0 m is adopted for road and soil foundation. According to the size of the solid project 1:1, the concrete structure model of utility tunnel is established. The utility tunnel structure is two meters away from the road surface. The road structure is divided into surface layer, base layer, subbase layer and soil base layer. The specific calculation parameters are shown in Table 1.
Table 1The structure parameters of asphalt road
Material | Thickness (m) | Elastic modulus (MPa) | Poisson’s ratio | Density (kg/m3) |
Surface course | 0.2 | 1200 | 0.3 | 2400 |
Base layer | 0.4 | 1800 | 0.25 | 2200 |
Subbase layer | 0.2 | 400 | 0.35 | 1800 |
Soil base layer | 1.2 | 50 | 0.3 | 1900 |
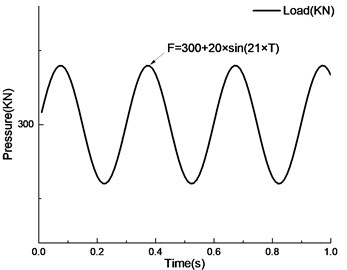
In order to simplify the calculation, the rear wheel load on one side of the vehicle body is taken as the research object. According to the load simulation methods commonly used in traffic load, the simplified sinusoidal load is used as the model to simulate the change of load during vehicle driving. The expression is: . In the formula, is the static load of the rear wheel, is the vibration amplitude of the load, is the circular frequency of the vibration, is the time. According to the results of traffic load related research and the actual situation, 300 kN, 20 kN, 21 rad/s are taken. The vehicle load time history curve is shown in Fig. 4.
Fig. 3The cross section of FEM model
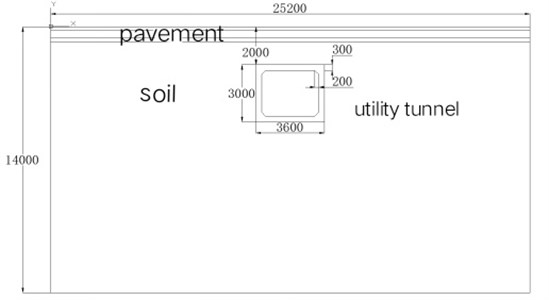
Fig. 4The time-history curve of numerical simulation load
The road surface layer, soil body and pipe gallery structure adopt universal contact for component assembly. The simplified sine function is used to simulate the vibration effect of the vehicle under moving load. Through the software subroutine DLOAD module, the load is imported into the external compilation environment for calculation. Finally, the calculation results are generated in the program post-processing module.
4. Analysis of calculation results
4.1. Analysis of simulation results
By extracting the stress time-history curves of the numerical simulation results of the left and right side walls in the model, the differences between the simulation results and the measured results in different parts are compared.
Compared with the numerical simulation and measured stress curves of the left and right side walls, the change trends of the two are basically the same. In the peak duration, the numerical simulation duration is shorter than the actual measurement. By observing the numerical simulation stress curve of the right side wall, it can be seen that the maximum peak value of the numerical simulation curve is about 208.2 kPa and the peak duration is about 2.8 seconds. The numerical simulation stress peak is 20 kPa larger than the measured data, and the peak deviation is about 10 %. Because the simulated vehicle load is sinusoidal equivalent load, there is still some error with the actual vehicle effect. Compared with the stress peaks of the numerical simulation and measured curves of the left wall, the former is larger than the latter. Due to the complex constraints of the actual left wall, the stress is smaller than the numerical simulation results.
According to the comparative analysis results of numerical simulation and measured curves of two different parts, ABAQUS software is adopted to carry out the numerical simulation of the utility tunnel structure, which can better reflect the actual stress situation of the structure, but it still needs to be improved in terms of vehicle load vibration form and structure boundary treatment.
Fig. 5Contrastive analysis of numerical simulation and measured curve
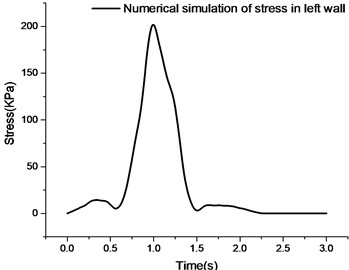
a) Numerical simulation of left side wall
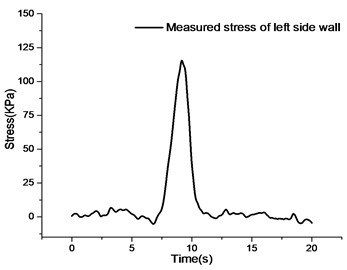
b) Measured value of left side wall
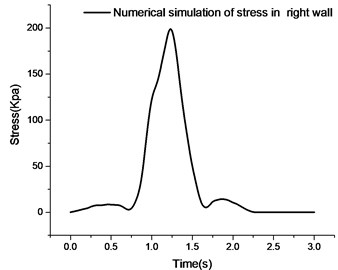
c) Numerical simulation of right side wall
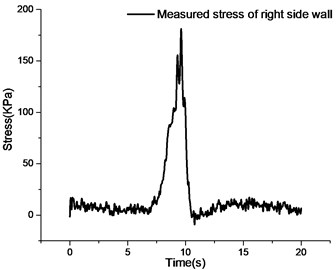
d) Measured value of right side wall
4.2. Stress analysis of left side wall
As shown in Fig. 6, the stress curve of left wall at 10 km/h shows little change in the -direction, while the -direction compressive stress curve is more obvious, and the peak time of the -direction and -direction stress is basically the same.When the vehicle leaves the test section of the utility tunnel, the -direction stress curve returns to zero, and the -direction stress has residual stress.
Observing the stress curves of the left wall at different speed, the fluctuation amplitude of the -direction stress curves at different speed is smaller, that is, the variation of the peak value of the -direction tensile stress at different speed is smaller, and the main stress is tensile stress. With the increase of vehicle speed, the -direction stress peak of the left wall changes gradually from wide and flat to narrow and steep. The results show that with the increase of vehicle speed, the stress acting time of the left wall changes, but the peak stress does not change much.
Observing the -direction stress curve of the left wall at different speed, the fluctuation amplitude of the -direction stress curve of the left wall is larger. When the vehicle approaches the test section of the utility tunnel, the -direction of the left wall will produce a tensile strain at different speeds.With the increase of vehicle speed, the action time becomes shorter due to the faster vehicle speed, and the value of -direction tensile stress decreases gradually. The peak compressive stress of the vehicle passing through the test section decreases gradually with the acceleration of the vehicle speed, which indicates that the faster the vehicle speed, the shorter the compressive strain acting on the -direction of the left wall. From the peak value of compressive stress in direction, the change is obvious.
Fig. 6The stress curve of right wall under different speed
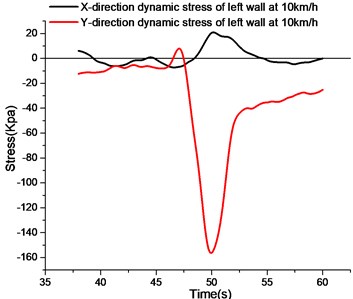
a) Stress curve of left side wall at 10 km/h
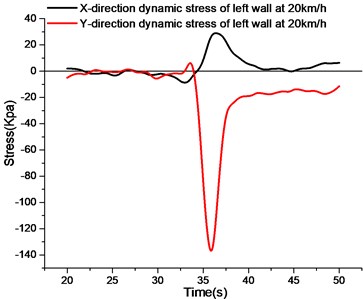
b) Stress curve of left side wall at 20 km/h
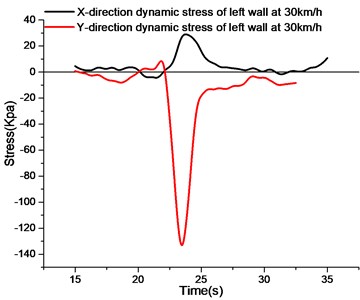
c) Stress curve of left side wall at 30 km/h
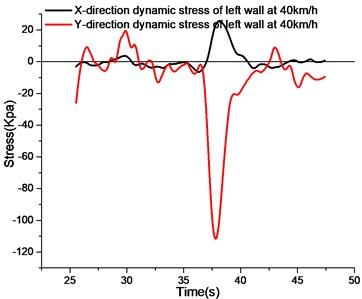
d) Stress curve of left side wall at 40 km/h
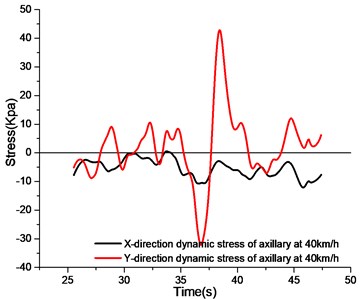
4.3. Stress analysis of axillary position
As shown in Fig. 7, by observing the stress curve at the axillary position of 10 km/h, it can be obtained that the axillary -direction bears compressive stress first, and then transforms into tension. The -direction stress is first compressed and then tensioned, reaching the maximum compressive stress in 48 seconds, and then the tensile stress increases rapidly, reaching the peak value in 51 seconds. Because the axillary part of the utility tunnel is close to the vehicle load, and mainly bears the load transmitted from the roof in the structural stress, the axillary part transfers the load to the side wall and the following parts, so the axillary force has a very important role in the structural stress analysis.
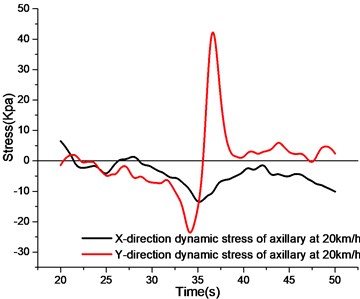
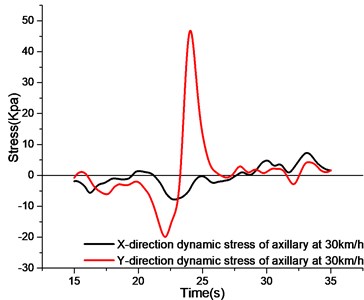
By observing the axillary stress curves at different speeds, the axillary -direction stress curves show a relatively smooth performance at 10 km/h speed. When the test section is passed, the axillary -direction is mainly compressive stress. When the vehicle speed increases to 20 km/h and 30 km/h, the -direction stress curve before the test section oscillates obviously, and the peak value of 20 km/h is larger. When the velocity increases to 40 km/h, the oscillation of -direction stress curve intensifies, but the peak value of compressive stress remains basically unchanged.
The -direction stress at the axillary is larger than the -direction stress at the same speed. Similar to the -direction, when the vehicle speed increases and the vehicle does not travel to the test section, the -direction stress curve will oscillate more intensely with the increase of the speed. When the vehicle travels to the utility tunnel section, the -direction stress curves at different speeds are first compressed and then tensioned.
Fig. 7The stress curve of haunch under different speed
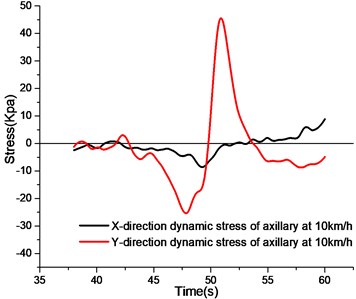
a) Stress curve of axillary at 10 km/h
b) Stress curve of axillary at 20 km/h
c) Stress curve of axillary at 30 km/h
d) Stress curve of axillary at 40 km/h
4.4. Stress analysis of roof center
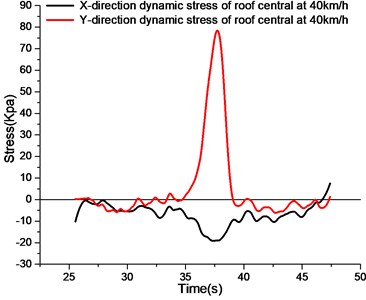
As shown in Fig. 8, the stress curve of the roof at 10 km/h is observed. In the figure, compression is the dominant direction in direction, while tension is the dominant direction in direction.
Observing the stress curve of the roof at different speeds, the central -direction stress of the roof is compressed at different speeds, and the -direction stress is smaller.Because the direction is cross-sectional and the span is much smaller than the -direction, the -direction strain is smaller than the -direction strain. The -direction curves at different speed were observed, and the -direction curves at different speed were subjected to tensile stress.Because the right wheel of the vehicle is rolled over the roof of the utility tunnel, the roof bears the impact load of the upper wheel. Therefore, longitudinal roof of the pipe gallery is compressed and the inside of the roof is tension stress. Studying the variation of the -direction stress peak in the center of the roof at different speeds, the -direction tensile stress peak at 10 km/h to 40 km/h has little difference. It can be seen that under the condition that the utility tunnel is subjected to half of the body load, the peak value of the -direction tensile stress of the roof is basically the same under the vehicle load at different speeds, and the speed has little influence on the peak value.
Fig. 8The stress curve of roof under different speed
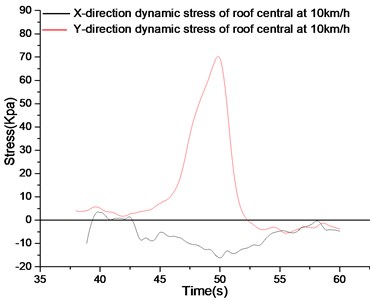
a) Stress curve of roof central at 10 km/h
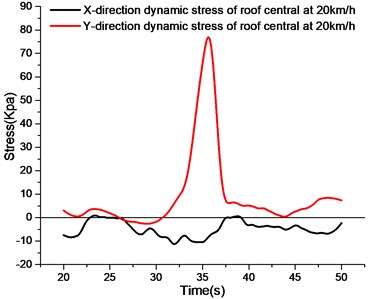
b) Stress curve of roof central at 20 km/h
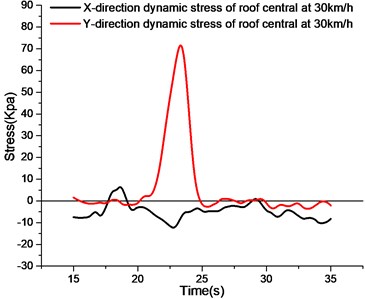
c) Stress curve of roof central at 30 km/h
d) Stress curve of roof central at 40 km/h
4.5. Stress analysis of right side wall
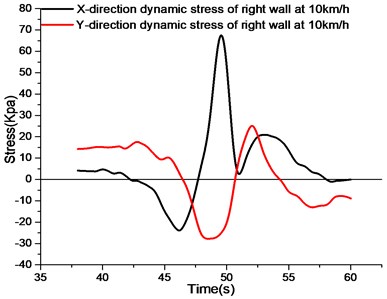
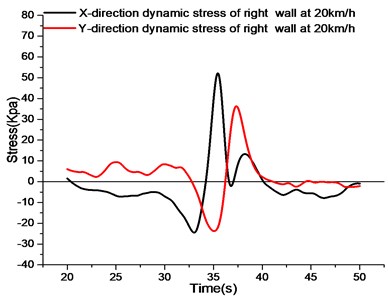
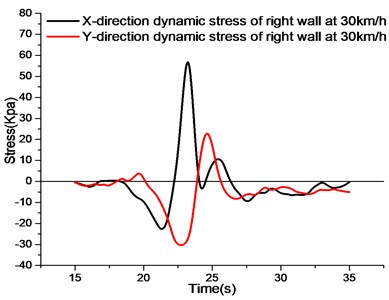
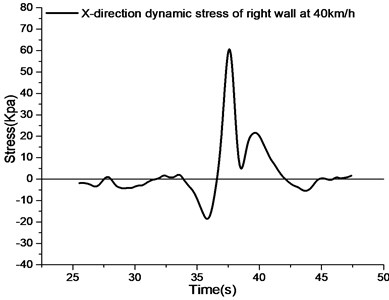
As shown in Fig. 9, the stress curve of the right wall at 10 km/h is observed. The -direction stress of the right wall first bears compressive stress, then tensile stress, and there are two stress peaks in the tensile stress section. The Y-direction curve has a peak compressive stress and a peak tensile stress, respectively. Before the vehicle arrives at the test section, the and stresses are basically unchanged. When the load approaches the test section, the stress curve in direction changes first than that in direction. When the -direction reaches the peak value of compressive stress, the compressive stress value of the -direction curve is still increasing. The -direction stress curve changes from the peak value of compressive stress to the peak value of tensile stress after 3.3 seconds, while the -direction stress curve reaches the peak value of compressive stress. Then the and curves fall back to zero at the same time and change into tensile stress at the same time. This may be the effect of the rear axle leaving the test section, but the specific mechanism needs further confirmation.
Comparing the -direction stress curves at different speeds, the peak values of compressive stress from 10 km/h to 40 km/h decrease continuously. The results show that the peak -direction compressive stress of the right side wall decreases with the increase of vehicle speed when the vehicle body half-load acts on the utility tunnel with the increase of vehicle speed. When the vehicle speed is between 10 km/h and 20 km/h, the compressive stress on the right side wall is larger. When the -direction reaches the peak value of compressive stress, the -direction stress rapidly changes from compressive stress to tensile stress as the vehicle drives further. It is observed that the time required for the right side wall to change from compressive stress peak to tensile stress peak at different speeds is a time-linearly decreasing section from 10 km/h to 30 km/h, while the stress growth time of the right side wall is gradually stable from 30 km/h to 40 km/h due to the fast speed of the vehicle. Observing the peak value of the first tensile stress in direction at different speeds, the peak value of other speeds tends to be the same except for 10 km/h, which is due to the low speed of the vehicle and the long passing time. At each velocity, the -direction stress curve falls back from the peak value of the first tensile stress to the peak value of the second tensile stress. The peak value of the -direction second tensile stress of the right side wall is between 18 % and 35 % of the peak value of the first tensile stress.
Observing the -direction stress curves at different velocities, the -direction stress of the right wall at different velocities in the figure is first compressive stress, then tensile stress. The influence of different velocities on the -direction compressive stress of the right wall is small, and the time needed to change the peak value of compressive stress to the peak value of tensile stress decreases with the increase of velocity. Comparing with the peak values of tensile and compressive stresses in direction, the peak values of compressive stresses are lower in the middle and higher at both ends, while the peak values of tensile stresses are higher in the middle and lower at both ends. In terms of stress variation at the same speed, the maximum value is at 20 km/h, and the smallest value is at 10 km/h. Therefore, 20 km/h speed has a great influence on the -direction stress of the right wall.
Fig. 9The stress curve of right wall on the condition two of different speed
a) Stress curve of right side wall at 10 km/h
b) Stress curve of right side wall at 20 km/h
c) Stress curve of right side wall at 30 km/h
d) Stress curve of right side wall at 40 km/h
4.6. -directional stress analysis at different measuring points
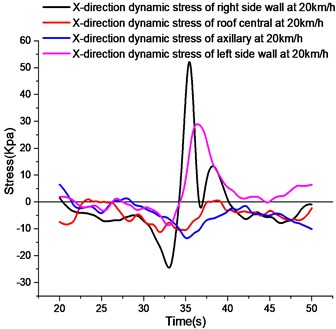
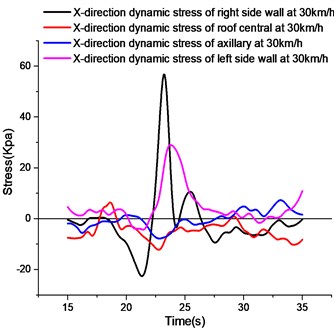
As shown in Fig. 10, the -direction dynamic strain curves of the left wall, the axillary part, the roof and the right wall of the test section are shown in the figure. It can be seen from the figure that the peak values of tensile stress and compressive stress of the right wall are the largest among the four measuring points. Since half of the wheel acts on the corridor structure and the other half acts on the left side of the road wall, the load on the left side of the wheel is transferred to the left side of the soil, which produces a greater active earth pressure on the left side of the corridor wall. When the wheel load on the right side is transferred to the roof of the utility tunnel, the roof will bend downward, the left and right side walls will bend inward, and the inside of the left and right side walls will be pulled. The left side wall acts on the left soil body with a greater active earth pressure, while the right side wall acts on the right soil body without additional load, only the inherent lateral earth pressure, so the -direction deformation of the left side wall is smaller than that of the right side wall.
Fig. 10The stress curve of X direction on the condition two of different point
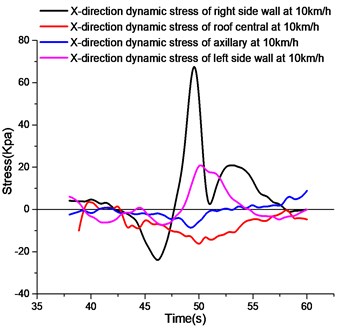
a)-directional stress curves at different measuring points at 10 km/h
b)-directional stress curves at different measuring points at 20 km/h
c)-directional stress curves at different measuring points at 30 km/h
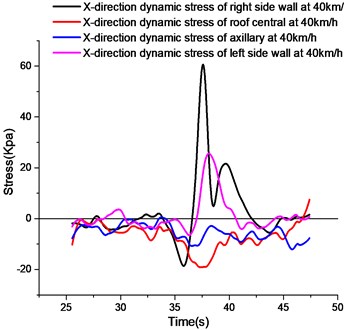
d)-directional stress curves at different measuring points at 40 km/h
4.7. -directional stress analysis at different measuring points
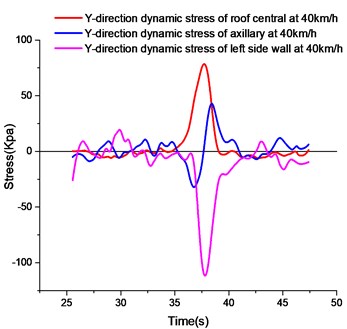
As shown in Fig. 11, the stress curves in the direction at different measuring points are observed. The peak value of the -direction compressive stress of the left wall in the figure is the maximum value of the -direction stress. The -direction stress of the axillary and the right wall is smaller, and the left wall is deformed by the earth pressure directly in the axial direction. Vehicle wheels run on the roof, the lower edge of the roof is pulled, and the tension stress is large.
To sum up, when half of the vehicle body acts on the pipe gallery structure, the peak values of -direction tensile stress and -direction compressive stress of the right side wall are the largest. Due to the large soil constraints behind the left wall, the -direction stress peak value of the left wall is 1/3 of that of the right wall. The peak value of compressive stress in direction is the largest in the left wall, and the peak value of tensile stress in direction is the largest in the roof.
Fig. 11The stress curve of Y direction on the condition two of different point
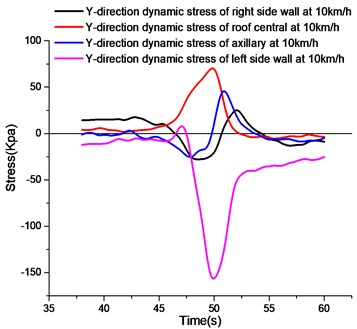
a)-direction stress curves at different measuring points at 10 km/h
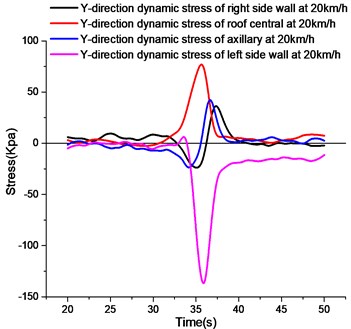
b)-direction stress curves at different measuring points at 20 km/h
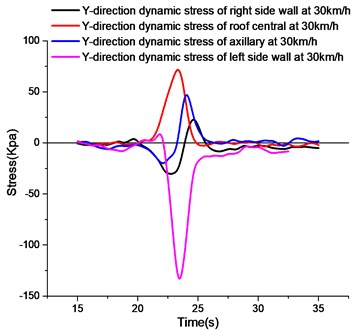
c)-direction stress curves at different measuring points at 30 km/h
d)-direction stress curves at different measuring points at 40 km/h
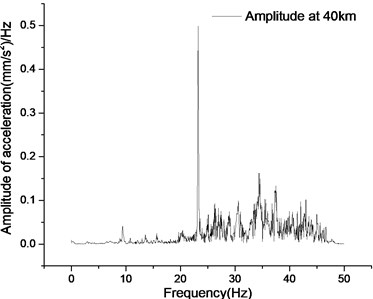
4.8. Analysis of acceleration frequency domain curve
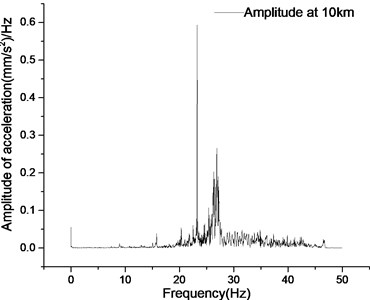
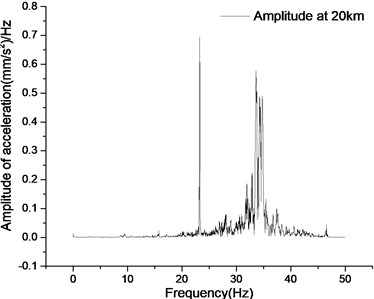
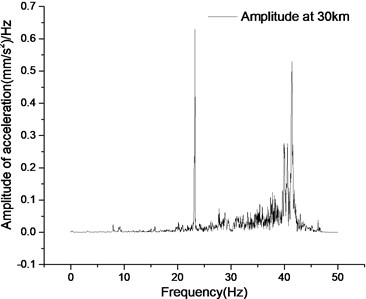
The main frequency of vibration and its corresponding acceleration amplitude in Fig. 12 are summarized in Table 2.
According to the statistics in Table 2, the responses of different speeds at the first dominant frequency are basically the same, and the corresponding acceleration amplitude changes from increasing to decreasing. The response amplitude at the second dominant frequency gradually decreases with the increase of the test speed. The acceleration amplitude at the third dominant frequency shows an upward trend. Synchronously observing the changes of the first to third dominant frequencies , it is believed that the first dominant frequency is still the main vibration frequency of the vehicle acting on the utility tunnel. With the increase of vehicle test speed, the vibration energy of the utility tunnel at the first dominant frequency decreases, and the vibration of the second and third dominant frequencies is strengthened. When the vehicle speed reaches 40 km/h, the second dominant frequency vibration decreases while the third dominant frequency vibration continues to increase. Therefore, it can be considered that with the increase of vehicle speed, besides maintaining the main first dominant frequency vibration, the vibration of the utility tunnel gradually transits to a higher dominant frequency.
Fig. 12The acceleration Fourier transform in the condition two of different speed
a) Acceleration frequency domain curve at 10 km/h
b) Acceleration frequency domain curve at 20 km/h
c) Acceleration frequency domain curve at 30 km/h
d) Acceleration frequency domain curve at 40 km/h
Table 2The frequency and amplitude in the condition two of different speed
Test speed | First dominant frequency / (amplitude) | Second dominant frequency / (amplitude) | Third dominant frequency / (amplitude) |
Unit | (Hz)/(mm/s2) | (Hz)/(mm/s2) | (Hz)/(mm/s2) |
10 km/h | 23.225/(0.594) | – | 46.617/(0.022) |
20 km/h | 23.258/(0.695) | 34.788/(0.490) | 46.551/(0.045) |
30 km/h | 23.259/(0.630) | 39.920/(0.277) | 46.317/(0.038) |
40 km/h | 23.238/(0.499) | 37.481/(0.134) | 46.626/(0.040) |
5. Conclusions
Through on-site testing of the responses of each measuring point of the utility tunnel at different vehicle speeds when half of the vehicle body acts on the utility tunnel, combined with numerical simulation calculation, the following conclusions are obtained:
1) The numerical simulation of utility tunnel with sinusoidal equivalent load can better reflect the actual stress situation of the structure, but it still needs to be improved in terms of vehicle load vibration form and structure boundary treatment.
2) The transversal stress of the left wall mainly bears tensile stress and the longitudinal stress mainly bears compressive stress. The transversal stress has little effect with the change of vehicle speed, while the longitudinal stress gradually decreases with the increase of vehicle speed. Vehicle speed has greater influence on the longitudinal direction of the utility tunnel than on the transverse direction.
3) The transversal stress value of the axillary part of utility tunnel is smaller and the longitudinal stress fluctuation is larger. With the increase of vehicle speed, the stress curve fluctuates more violently.
4) The longitudinal compressive stress of the roof along the utility tunnel is larger under the action of vehicle with different speeds. The growth rate of the stress curve increases with the increase of vehicle speed. The peak tension stress of roof is basically the same. It shows that speed has little effect on the peak value.
5) The transversal and longitudinal stress changes of the right side wall are obvious, and the peak value of the transversal stress is larger than the peak value of the longitudinal stress. The transversal stress curve has one compressive stress peak and two tensile stress peaks. The longitudinal stress curve has one peak value of tensile stress and one peak value of compressive stress. The peak value of transversal compressive stress of the right side wall decreases with the increase of vehicle speed. The first tensile stress peak value in the transversal stress curve is larger at 10 km/h. The change of longitudinal stress curve with vehicle speed only has great influence on the stress growth rate, but has little influence on the stress peak value.
6) At different vehicle speeds, the peak values of transversal tensile stress and compressive stress of the right side wall are the largest. The peak values of transversal stress of the left wall is 1/3 of that of the right wall. The peak value of longitudinal compressive stress of the left wall is the largest. The peak value of longitudinal tensile stress of roof is the largest. In the design and construction, weak positions should be reinforced.
References
-
Wang Zhimin Study on Mechanical Properties of Buried Pipelines under Traffic Loads. Zhejiang University, 2006.
-
Guo Tong, Li Aiqun, Zhao Daliang Probability model of multi-peak distribution of vehicle load for reliability evaluation of highway bridges. Journal of Southeast University (Natural Science Edition), Vol. 5, 2008, p. 763-766.
-
Han Wanshui, Yan Junyuan, Wu Jun, Li Yanwei, Yang Fei Traffic load characteristics and dynamic bridge crossing analysis of heavy vehicles based on long-term monitoring. China Journal of Highway, Vol. 27, Issue 2, 2014, p. 54-61.
-
Wu Xiaogang Research on the Stress Analysis Model of Pipeline in Soft Soil Foundation under Traffic Load. Zhejiang University, 2004.
-
Li Xun Analysis of Mechanical Properties of Buried Pipelines under Traffic Load. Zhejiang University, 2004.
-
Tian Fei, Chu Jinjing Traffic load characteristics and simulation methods. Journal of Water Conservancy and Construction Engineering, Vol. 12, Issue 4, 2014, p. 66-71+161.
-
Li Xinliang, Li Suzhen, Shen Yonggang Stress analysis and field test of buried pipelines under traffic loads. Journal of Zhejiang University (Engineering Edition), Vol. 48, Issue 11, 2014, p. 1976-1982.
-
Zhang Bin, Wang Hanfei, Huang Yunfeng Stress characteristics analysis of double-compartment rectangular pipe gallery on soft soil foundation under vehicle load. Journal of Dongguan Institute of Technology, Vol. 24, Issue 5, 2017, p. 50-54.
-
Quan Yong Response Analysis of Underground Comprehensive Pipeline Gallery of Branch Line in Old Urban Area under Vehicle Load. Xi’an University of Science and Technology, 2017.
-
Huang Yi Simulating study on stress and deformation of underground comprehensive pipeline gallery under overweight load. Shanxi Architecture, Vol. 44, Issue 12, 2018, p. 43-45.
About this article

