Abstract
This study advances the analysis of rectangular plates under transverse loading by employing a third-order shear deformation theory and a direct energy method. To address limitations of prior models, exact displacement fields were derived from a general variation of total potential energy, yielding closed-form expressions for deflection and transverse shear in the and directions via variational calculus. Subsequently, new formulas for critical lateral loads – applicable before excessive deflection or elastic yield – were developed. Numerical evaluations were conducted for aspect ratios 1 2, spans of 1000, 3000, and 5000 mm, and thicknesses 5, 10, 12.5, and 15 mm. The results show that increasing thickness markedly enhances load capacity and safety margins, while larger aspect ratios and longer spans reduce stability. For example, a 15 mm plate with a 1000 mm span attains elastic-limit loads 74.7 N/mm at aspect ratio 1, decreasing to ~29.2 N/mm at aspect ratio 2, with yield loads 77.8 N/mm. In contrast, a 5 mm plate under the same spans has values lowering from ~2.77 N/mm to ~1.08 N/mm as aspect ratio increases, while remains in the range 8.39-12.53 N/mm. These trends indicate that thicker plates withstand higher elastic and plastic limits, expanding safe operating margins, whereas slender (high aspect ratio) configurations exhibit reduced capacity and greater susceptibility to instability. Under large-span/large-deflection conditions, negative or near-zero capacity values reveal potential instability modes such as buckling in slender plates. In sum, the proposed model enhances design effectiveness by integrating geometric, material, and reinforcement considerations to ensure safety and serviceability without relying on post hoc deflection or shear assessments. The framework provides reliable, accurate predictions of flexural and shear responses, supporting efficient, safe, and cost-effective structural design.
Highlights
- Developed a refined analytical model for rectangular plates under transverse loading using a third-order shear deformation theory combined with a direct energy (variational) method.
- Derived exact displacement fields from a general variation of the total potential energy, producing closed-form expressions for deflection and transverse shear in both x and y directions.
- Established new closed-form formulas for critical lateral loads valid up to elastic limit and prior to excessive deflection or yield.
- Performed numerical studies for aspect ratios 1 ≤ b/a ≤ 2, spans L = 1000, 3000, 5000 mm, and thicknesses t = 5, 10, 12.5, 15 mm.
- Identified instability risks for slender, long-span plates: near-zero or negative capacity under large-span/large-deflection conditions indicating buckling-prone behavior.
1. Introduction
Plate structures are widely used in fields such as aerospace, aeronautics, automotive engineering, and structural engineering. In structural applications, they serve various functions, including bridge decks, retaining walls for water management, panels for building slabs, and components of ship hulls and spacecraft [1]. As the application of isotropic plate materials increases, it becomes clear that there is a need for more advanced methods of load analysis. The transverse shear stresses and strains that occur due to increased applied loads significantly influence the bending behavior of these materials. When the load exceeds the critical level, lateral deflections can increase to the point of causing failure through mechanisms such as material yielding [2]. To effectively analyze bending under applied loads, it is crucial to determine and assess the critical load that renders the plate structure unstable according to equilibrium conditions.
Due to its limitations, particularly in neglecting transverse shear effects, classical plate theory (CPT) has proven inadequate for analyzing isotropic plates subjected to significant shear stresses [3, 4]. Consequently, the development of shear deformation theory has become essential. Numerous researchers have proposed various shear deformation theories, such as Trigonometric Shear Deformation Theory (TSDT), Higher-Order Shear Deformation Theory (HSDT), and Exponential Shear Deformation Theory (ESDT), which provide more accurate solutions that account for shear deformation effects when predicting the bending and free vibration behavior of thick isotropic plates under uniformly distributed lateral loads [4-11]. For instance, Chen et al. [12] conducted a bending analysis of thick plates with all edges clamped (CCCC) at the supports, utilizing governing equations derived from Mindlin’s plate theory. Their analysis incorporated a shear correction factor associated with the First Order Shear Deformation Theory (FSDT), based on the assumption that the line perpendicular to the mid-plane remains straight post-deformation.
First Order Shear Deformation Theory (FSDT) is widely regarded as an advancement over Classical Plate Theory (CPT), as it incorporates the effects of transverse shear deformation in plate analysis. However, the FSDT has limitations, notably the requirement for a shear correction factor [13-15]. These shortcomings of both CPT and FSDT have prompted the development of second-order and higher-order shear deformation theories (HSDT). HSDTs provide more accurate analytical results while also addressing transverse shear deformation without the need for shear correction factors [16-19]. For instance, the authors of [20, 21] proposed a shear deformation theory that eliminates the necessity of a shear correction factor and applied it to clamped-clamped-clamped-supported (CCCS) and 3-D plate theory for 3-D rectangular plates analysis. They utilized a polynomial displacement function in deriving the governing differential equations. In contrast, other researchers [10, 22, 23] employed Trigonometric Shear Deformation Theory (TSDT), which also incorporates shear deformation effects in their analysis. While their results were satisfactory compared to other studies, their work did not address the analysis of critical loads that may cause structural deflection or cracking. The findings from these theories indicate slight deviations in predicting the response of lateral loads on structures. This is expected, as none utilized an exact displacement function derived directly from the governing equations; instead, they relied on assumed deflection functions, which may not produce reliable results.
The author in [19] introduces a third-order shear deformation model for thick plate bending, carefully derived from fundamental elasticity principles. This approach provides a more precise representation of shear effects compared to lower-order models, thereby minimizing shear locking and enhancing accuracy in thick plate analyses. It utilizes polynomial displacement functions that inherently meet boundary conditions and formulates the governing equations explicitly. The author in [24] highlighted the benefits of employing assumed polynomial displacement functions over trigonometric, hyperbolic, and exponential shape functions in plate analysis, noting that the latter can be difficult to implement under certain complex boundary conditions. Similarly, in [25], polynomial shear deformation theory was used to analyze rectangular plates, deriving expressions for displacement and moments to predict the bending response of all-sided simply supported (SSSS) rectangular plates. Conversely, another study [26] provided solutions for critical loads for plates with two adjacent edges clamped (CSCS) and those with one edge clamped and the third edge free, with the remaining edges simply supported (SCFS), utilizing a third-order shear deformation theory. However, these studies [24-26] did not examine the effects of loads causing deflection in plates with a simply supported rectangular plates. The predictions from these theories showed inaccuracies in response to lateral loads, as they overlooked the influence of shear stresses that can lead to cracking in the plates.
There are other mathematical tools used to analyze critical loads in rectangular plates, highlighting their strengths, limitations, and relation to a more integrated, first-principles approach.
The authors in [27-29] uses the HAS-Sumudu framework, which blends the Sumudu transform with the Homotopy Analysis Method (HAM) to tackle fractional-order PDEs, stochastic Davey-Stewartson equations driven by multiplicative noise, and oscillation problems for fourth-order neutral differential equations. This hybrid approach yields semi-analytic, convergent series that can adapt to nonlocal and stochastic influences. It is demonstrated on three fronts: fractional-order PDEs with accuracy against exact solutions, SDSEs where mappings generate families of solutions (rational, elliptic, hyperbolic, trigonometric) with MATLAB simulations showing how multiplicative noise affects stability and symmetry, and Riccati-based oscillation criteria for high-order neutral equations. The core tools are the Sumudu transform (for fractional derivatives), HAM (for convergent series without small parameters), mapping techniques (for closed-form-like representations), and Riccati substitution (for oscillation analysis). The strengths lie in flexibility to address nonlocal dynamics and stochastic forcing, and in producing analytic or semi-analytic expressions that enable rapid evaluation and qualitative insight into stability and symmetry. Limitations include the need to carefully control series convergence, problem-dependent quantitative accuracy, stylized treatment of stochastic terms, and interpretations that depend on statistical assumptions and sampling.
The present work unlike the past adopts a traditional, engineering-oriented approach: a third-order shear deformation theory (ToSDT) paired with a direct energy method. Here, the total potential energy is variationally formulated to derive exact displacement and shear fields within ToSDT. Variational calculus yields deflection and shear in both and directions, and explicit formulas for critical loads – elastic () and yield () limits that indicate the onset of excessive deflection or material yielding. Together, the present work and HAS-Sumudu approaches [27-29] represent complementary ends of the spectrum: HAS-Sumudu offers flexible, semi-analytic insight into fractional and stochastic dynamics, while present study provides rigorous, design-oriented predictions anchored in a specific plate theory. Each has a distinct role in critical-load analysis, with the former illuminating nonlocal and noisy influences and the latter delivering explicit, practically usable stability thresholds.
This research distinguishes itself by deriving an exact polynomial displacement function through a comprehensive variation of the total potential energy, avoiding reliance on assumed displacement functions. This methodology allows precise calculation of the critical lateral load necessary to predict the flexural behavior of all edges simply supported isotropic rectangular plates – achieving a goal not met by prior studies. The work involves a static bending analysis of an isotropic rectangular plate subjected to uniformly distribute transverse loads, using exact polynomial displacement functions in conjunction with an advanced shear deformation theory that extends traditional higher-order shear deformation concepts. The refined shear deformation theories – with derived polynomial from equilibrium equation in this work proven to give accurate result in the thick rectangular plate’s analysis. Thus, taking care of shear effects and complex loading problems associated to classical plate theories. Focused on a rectangular plate with all edges simply supported, the study evaluates the effects of deflection and shear stress on the overall structural response. Through this innovative approach, the research provides valuable insights into the bending behavior and limit state analysis of rectangular plates, addressing gaps identified in earlier investigations.
2. The core novelties of the study and implications
The core novelty lies in deriving exact displacement fields from a total potential energy variation, yielding closed-form, variationally accurate expressions for deflection and transverse shear. This energy-based framework anchors the analysis in first principles, rather than relying on conventional assumed displacement shapes. By incorporating a third-order shear deformation theory within an exact-field approach, the work advances beyond classical plate theories and better captures higher-order shear effects, especially in thicker plates. A key practical contribution is the development of explicit elastic and plastic (yield) limit-load formulas that apply before large deflections occur. These pre-deflection, pre-yield criteria provide actionable design guidance, enabling engineers to define safe operating envelopes without waiting for post-buckling or post-yield behavior. The study also identifies clear trends: increasing thickness substantially enhances load capacity and safety margins, while larger aspect ratios and longer spans tend to reduce stability. These insights offer intuitive guidance for design choices that balance rigidity, strength, and stability.
In slender, long-span configurations under sizable deflections, the method exposes potential instability modes such as buckling, indicated by negative or near-zero capacities. This sensitivity underscores the method’s relevance for robust design, not just prediction of small-deflection responses. The integration of third-order shear deformation theory with a direct energy method represents a noteworthy synthesis, providing a cohesive path from fundamental formulation to practical design criteria – a combination not common in prior rectangular-plate studies.
Key highlights include:
– First-principles displacement fields derived from general total-energy variation, enabling analytical, closed-form expressions for deflection and transverse shear in the principal directions via variational calculus.
– Proactive design criteria: pre-deflection, pre-yield critical-load formulas that align with safe operating envelopes and design codes.
– Clear, evidence-based trends – thicker plates increase capacity while larger aspect ratios and spans reduce stability – informing engineering practice.
The work also promotes a design paradigm shift: a single, coherent model that integrates geometry, material properties, and reinforcement. This holistic framework supports safer, more serviceable, and cost-effective structures without reliance on extensive post hoc checks. Ultimately, the approach is poised to enhance scholarly citations through its rigorous theory, explicit closed-form solutions, and broadly applicable preemptive load formulas that can inform engineering practice and standards discussions. The work pivots plate analysis by deriving exact polynomial displacement functions directly from the total potential energy variation, rather than relying on assumed displacement shapes. Grounded in first principles, the resulting deflections and transverse shear in the x and y directions are obtained from variational calculus, with explicit displacement fields yielding closed-form expressions that are exact within the chosen polynomial framework.
Building on the exact-field approach, the study implements a direct energy-based third-order shear deformation theory for isotropic rectangular plates. This integration captures higher-order shear effects more accurately than classical theories, especially in thicker plates, while remaining consistent with the first-principles framework. A key outcome is analytical, closed-form expressions for transverse deflections and shear stresses in both directions, enabling rapid evaluation of structural response without heavy numerical solvers. These formulas facilitate straightforward sensitivity analyses and design checks. The work introduces elastic and plastic (yield) limit-load formulas applicable before large deflections or yielding occur. These criteria provide actionable design guidance for safe serviceability and robust capacity, particularly for slender configurations where instability risk is highest. The framework aims to impact multiple engineering fields – aerospace, automotive, civil, marine, and structural – by delivering exact-field derivations, TO-SDT, and closed-form results that inform design of plates in bridges, slabs, decks, hulls, and spacecraft components, enhancing safety and efficiency in industry.
3. Kinematics and stress-strain relationship
The refined plate theory (RPT) in-plane displacements, u and v as presented on Fig. 1 are defined mathematically as:
Fig. 1Deformation of an elementary section of a plate
Using the basic thick plate assumption that, the classical in-plane displacements includes in-plane displacement in the direction of coordinates () and in-plane displacement in the direction of coordinates () as shown in Eq. (1) and (2) (see the author in [23]):
Given that the shear deformation profile of plate section is [24]:
Let: – deflection of the plate, and – shear deformation slope in and axis respectively or .
From assumptions herein, the strain normal to axis is zero. This left us with only five engineering strain components , , , and
Similarly reasoning in direction, we shall obtain:
While the five stress components are:
Similarly:
Rearranging Eqs. (13-15) gives:
4. Formulation of energy equation
Total potential energy is the summation of strain energy, and external work, that’s:
The strain energy:
While the external work as:
Substituting Eqs. (23) and (24) into Eq. (22) and simplify to get the total potential energy equation as:
Given that:
where , , and – shape function, length, breath and thickness of the plate, the span-depth aspect ratio, coordinates and and the span-span aspect ratio, as:
5. Governing energy equation
The general variation was performed by minimizing Eq. (25) w.r.t deflection ( to get three simultaneous governing equations, which when solved gave the exact deflection function in Eq. (30) as:
Thus, the exact deflection at all edges simply supported plate in the polynomial displacement is given as:
where and .
The values herein are given as: 0.2361904761, 0.2359183673, 0.2361904761, 0.0239002267, 0.0239002267, 0.04.
The direct governing equation is obtained by minimizing Eq. (25) w.r.t. , and (the coefficient of deflection, shear deformation in and axis) respectively:
where:
According to authors in [30]:
By solving Eq. (33), we have:
That is:
where:
Where ,
Let:
But:
6. Formulation of the critical lateral imposed load in the rectangular plate
Structural safety is achieved when the critical imposed load of the plate is determined. To ensure that deflection does not exceed allowable limit, the critical imposed load before deflection reaches allowable limit, is obtain as follows:
Substitute Eq. (54) into Eq. (59), gives:
where, – allowable deflection.
But:
where, – allowable deflection, – self weight of the plate, – critical imposed lateral load before deflection reach elastic limit, – unit weight of the plate, – thickness of the plate.
Thus:
Thus:
where:
Also, to ensure that the critical lateral load the plate is determined before it reaches yielding; recall that:
From Eq. (23), Let:
Substituting values of , , , , and in Eqs. (15-21) into Eq. (67) gives:
where:
and – yielding point of the plate.
For a bar, let and .
Equating Eq. (67) with (69) and simplifying gives:
Equating Eq. (11) with (16) and simplifying gives:
Similarly:
Therefore, substituting Eq. (74) into (71) and simplifying gives:
By simplifying Eq. (72), the value of becomes:
Equate Eqs. (75) and (76), we get expression for as:
But:
Substituting Eqs. (63) and (77) into Eq. (78), and simplifying gives:
Let:
where – critical imposed lateral load before plate reach yield stress, – steel characteristic strength.
7. Results and discussions
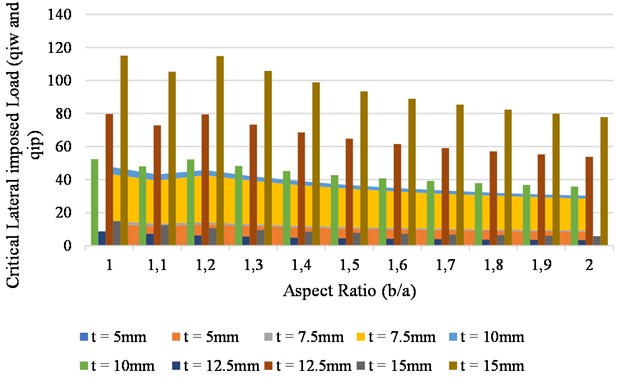
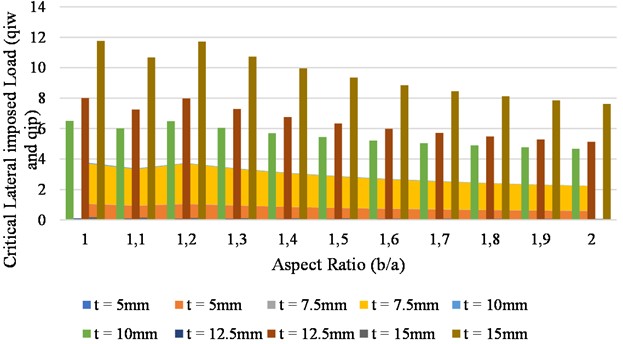
The numerical study evaluated the critical imposed load on simply supported rectangular plates subjected to a uniformly distributed transverse load. The analysis covered aspect ratios from 1 to 2 (including intermediate ratios such as 1.1, 1.2, etc.), with spans of 1000 mm, 3000 mm, and 5000 mm, and considered allowable deflections of 1 mm, 3 mm, and 5 mm. The plates had thicknesses of 5 mm, 10 mm, 12.5 mm, and 15 mm. The extensive set of results in Fig. 2 provides critical insights into the behavior of rectangular plates under lateral loads, emphasizing how thickness, aspect ratio, and load limits influence structural performance. For 5 mm thick plates, the elastic limit load () decreases from approximately 0.55 N/mm at aspect ratio 1 to 0.22 N/mm at aspect ratio 2, while the maximum permissible load before yield () drops from about 12.53 N/mm to 8.39 N/mm across the same range. This indicates a significant reduction in capacity with increased slenderness. In 7.5 mm plates, ranges from roughly 1.87 N/mm at aspect ratio 1 to 0.73 N/mm at aspect ratio 2, with varying from approximately 28.49 N/mm to 8.39 N/mm, showing improved capacity over thinner plates but still decreasing with aspect ratio.
The 10 mm tick plates demonstrate higher strength, with values from approximately 4.43 N/mm (aspect ratio 1) to 1.73 N/mm (aspect ratio 2), and values from about 52.44 N/mm to 8.39 N/mm, reflecting increased resistance due to increased thickness. For 12.5 mm plates, ranges from around 8.54 N/mm (aspect ratio 1) down to 5.84 N/mm (aspect ratio 2), with reaching up to 115.11 N/mm at aspect ratio 1, indicating substantial capacity and safety margins in thicker plates. The implication of the result is that, as plate thickness increases, the loads leading to elastic and plastic limits also rise, expanding safe operational thresholds. Conversely, higher aspect ratios reduce load capacity, highlighting the need for reinforced design in slender structures. These findings underscore the importance of considering both elastic and plastic behavior, material properties, and geometric ratios to ensure structural safety, serviceability, and compliance with standards. Managing these factors effectively supports resilient design against lateral forces while accounting for real-world imperfections, dynamic effects, and load-carrying efficiency.
Fig. 2Graph of critical lateral imposed load vs aspect ratio plate for span of 1 m at (wa= 1 mm)
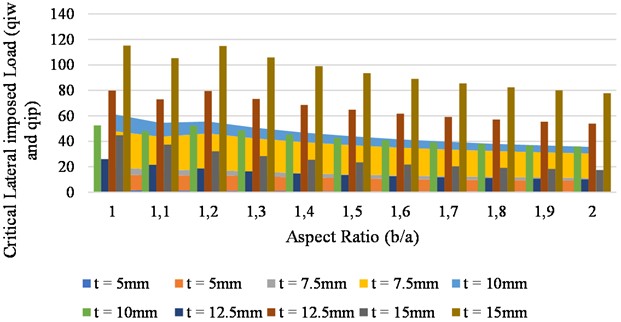
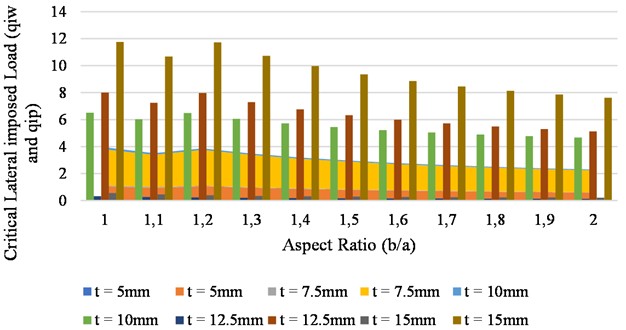
This comprehensive analysis of result demonstrates in Fig. 3 showed how the critical lateral imposed load before the plate reaches its elastic limit () and the permissible yield stress () varies with plate thickness, span, aspect ratio, and deflection criteria. For 5 mm thick plates, ranges from approximately 0.648 N/mm at aspect ratio 2 to 1.66 N/mm at aspect ratio 1, while decreases from 12.53 N/mm to 8.39 N/mm over the same aspect ratio range, indicating a considerable safety margin that contracts as the aspect ratio increases. The trend reflects that thinner plates are more vulnerable under lateral loads, requiring careful reinforcement and design considerations. In 7.5 mm thick plates, values increase with thickness but decrease with aspect ratio, ranging from about 2.19 N/mm at aspect ratio 2 to 5.6 N/mm at aspect ratio 1. For the same span and deflection, with corresponding values substantially higher, reaffirming the importance of adequate reinforcement.
The 10 mm thick plates show higher critical loads, with between approximately 5.19 N/mm at aspect ratio 2 and 13.280 N/mm at aspect ratio 1, and values around 52 N/mm – indicating improved capacity and safety margins compared to thinner plates. Similarly, for 12.5 mm and 15 mm thick plates, both and values are considerably higher across all aspect ratios. For instance, at 15 mm thickness and aspect ratio 1, reaches about 17.5 N/mm, and exceeds 115 N/mm, suggesting significant capacity for lateral loads while maintaining safety margins. These results emphasize the critical influence of material thickness, aspect ratio, and span on the structural safety and serviceability of plates. Designing for elastic limits ensures operational safety and longevity, while the higher yield stress thresholds provide a buffer against failure modes. The load-deflection relationship underscores the importance of controlling deflections within permissible limits to prevent excessive deformations. Incorporating material ductility and accounting for real-world imperfections, dynamic effects, and standards are essential for robust and safe structural design. Generally, the data guide engineers to optimize reinforcement, material selection, and geometric ratios to ensure compliance, safety, and durability under lateral loading conditions.
Fig. 3Graph of critical lateral imposed load vs aspect ratio plate for span of 1 m at (wa= 3 mm)
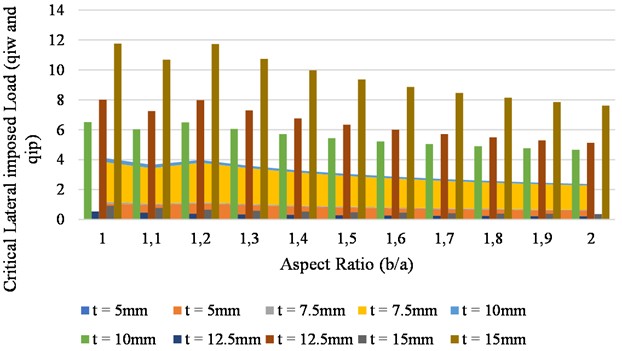
This analysis of the result in Fig. 4 reveals that increasing plate thickness from 5 mm to 15 mm substantially elevates the critical lateral loads, enhancing structural capacity and safety margins. For 5 mm thick plates with a span of 1000 mm and a permissible deflection of 5000 mm, the elastic limit load () decreases from approximately 2.77 N/mm at an aspect ratio of 1 to 1.08 N/mm at an aspect ratio of 2, while the maximum load before reaching yield () remains between 8.39 N/mm and 12.53 N/mm.
Conversely, 15 mm thick plates exhibit much higher capacities, with declining from about 74.71 N/mm at aspect ratio 1 to 29.19 N/mm at aspect ratio 2, and exceeding 77.83 N/mm across all aspect ratios. These findings indicate that thicker plates can withstand higher lateral loads before elastic and plastic limits are reached, boosting safety margins and serviceability. The decreasing trend of capacity with increasing aspect ratio highlights the importance of designing slender structures with adequate reinforcement. Moreover, understanding these relationships aids in balancing material properties, section geometry, and load conditions in compliance with standards – ensuring resilient structural performance amid real-world imperfections, dynamic effects, and load paths. Entirely, the data emphasize the need to consider both elastic and plastic behaviors to optimize safety, durability, and serviceability in structural design.
The result in Fig. 5 highlights the influence of plate thickness, span, and aspect ratio on the critical lateral load capacities before elastic and plastic limits are reached. For 5 mm thick plates spanning 3000 mm with an allowable deflection of 1000 mm, the elastic limit load () decreases from approximately 0.00645 N/mm at aspect ratio 1 to 0.00228 N/mm at aspect ratio 2, while the maximum load before yield () varies from about 1.05 N/mm to 0.59 N/mm across the same aspect ratios.
In contrast, 15 mm thick plates exhibit significantly higher capacities, with declining from approximately 0.183 N/mm at aspect ratio 1 to 0.0709 N/mm at aspect ratio 2, and ranging from about 11.76 N/mm down to 7.62 N/mm. This demonstrates that increasing thickness substantially improves load-bearing capacity and safety margins. The implication of this result is that the reduction in critical load capacities with increasing aspect ratio reflects higher slenderness, which can compromise structural safety and serviceability. Thicker plates provide greater resistance and safety margins, emphasizing the importance of appropriate material and section selection. These insights inform design decisions related to ensuring elastic stability and preventing plastic failure, considering real-world imperfections, dynamic loads, and compliance with codes. Balancing these factors ensures reliable, safe, and serviceable structures under lateral loading conditions.
Fig. 4Graph of critical lateral imposed load vs aspect ratio plate for span of 1 m at (wa= 5 mm)
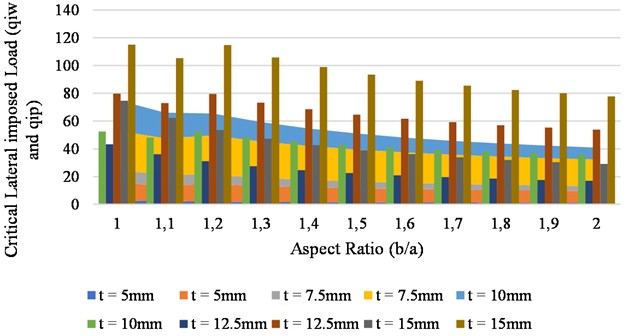
Fig. 5Graph of critical lateral imposed load vs aspect ratio plate for span of 3 m at (wa= 1 mm)
The result in Fig. 6 illustrates how plate thickness, span length, and aspect ratio influence the critical lateral loads before elastic and plastic failure under large deflections. For 5 mm thick plates with a 3000 mm span and a 3000 mm allowable deflection, the elastic limit load () decreases from approximately 0.0201 N/mm at aspect ratio 1 to 0.00762 N/mm at aspect ratio 2. Similarly, the maximum load before reaching yield () drops from about 1.05 N/mm to 0.59 N/mm over the same range, indicating reduced stiffness and capacity in slender configurations.
In comparison, 15 mm thick plates show higher capacities, with decreasing from roughly 0.552 N/mm at aspect ratio 1 to 0.215 N/mm at aspect ratio 2, and from about 11.76 N/mm to 7.62 N/mm, reflecting increased strength with thickness. The implication of this result is that, the higher thickness markedly enhances load-carrying capacity and safety margins, while increasing aspect ratio decreases these capacities, emphasizing the importance of geometric design in ensuring structural safety and serviceability. These findings underline the necessity to consider elastic and plastic behaviors, material ductility, and real-world imperfections in structural design, aligning with standards and best practices to prevent failure modes, optimize load paths, and ensure durability under large deflections and lateral forces.
Fig. 6Graph of critical lateral imposed load vs aspect ratio plate for span of 3 m at (wa= 3 mm)
This analysis of the result in Fig. 7 highlights how increasing plate thickness from 5 mm to 15 mm significantly enhances the load capacity before failure under large deflections. For a 5 mm thick plate spanning 3000 mm with a 5000 mm allowable deflection, the elastic limit lateral load () decreases from approximately 0.0338 N/mm at aspect ratio 1 to 0.01296 N/mm at aspect ratio 2, while the maximum load before reaching yield () ranges from about 1.05 N/mm to 0.59 N/mm across the same aspect ratios.
Fig. 7Graph of critical lateral imposed load vs aspect ratio plate for span of 3 m at (wa= 5 mm)
In contrast, 15 mm thick plates exhibit much higher capacities, with declining from approximately 0.921 N/mm at aspect ratio 1 to 0.359 N/mm at aspect ratio 2, and from about 11.76 N/mm down to 7.62 N/mm. The implication of this result is that, the thicker plates substantially improve structural safety and serviceability by increasing the load margins against elastic and plastic failure. The decreasing trend of capacity with higher aspect ratios underscores the need for adequate reinforcement in slender configurations. These findings reinforce the importance of considering elastic vs. plastic behavior, material ductility, real-world imperfections, and adherence to design standards to ensure resilient, safe, and durable structural performance under large deflections and lateral loads.
The result in Fig. 8 demonstrates that increasing plate thickness from 5 mm to 15 mm significantly enhances lateral load capacity under large span conditions. For 5 mm thick plates spanning 5000 mm with a 1000 mm allowable deflection, the elastic limit load () decreases from approximately 0.0005 N/mm at aspect ratio 1 to negative values at higher ratios, indicating potential instability or failure beyond certain slender configurations. The maximum load before reaching yield () diminishes from about 0.1317 N/mm at aspect ratio 1 to negative values at higher ratios, reflecting loss of structural capacity as the aspect ratio increases.
In contrast, 15 mm thick plates exhibit much higher capacities, with decreasing from approximately 0.02275 N/mm at aspect ratio 1 to 0.00819 N/mm at aspect ratio 2, and remaining substantially higher, above 77 N/mm even at increased aspect ratios. These findings indicate that thicker plates provide markedly greater resistance and safety margins under large span and deflection conditions. The implication of this result is that, the results illustrate that structural safety and serviceability are highly sensitive to plate thickness, aspect ratio, and load conditions. As aspect ratio increases, capacity reduces, emphasizing the importance of optimal geometric design. Incorporating material ductility, real-world imperfections, and adherence to design standards is essential to prevent instability and ensure resilience under large deflections and lateral forces. Overall, thicker and well-designed plates significantly enhance safety margins, reducing risk of failure in practical applications.
Fig. 8Graph of critical lateral imposed load vs aspect ratio plate for span of 5 m at (wa= 1 mm)
The result presented in Fig. 9 shows that increasing plate thickness from 5 mm to 15 mm significantly raises the critical lateral load capacities under large span and deflection conditions. For 5 mm thick plates with a 5000 mm span and a 3000 mm allowable deflection, the elastic limit load () decreases from approximately 0.00227 N/mm at aspect ratio 1 to 0.00065 N/mm at aspect ratio 2, while the maximum load before reaching yield () declines from about 0.1317 N/mm to –0.034 N/mm, indicating potential instability or the onset of failure at higher aspect ratios.
For 15 mm thick plates, ranges from roughly 0.07056 N/mm at aspect ratio 1 to 0.02687 N/mm at aspect ratio 2, and remains positive and higher, from approximately 3.50 N/mm down to 2.00 N/mm, reflecting more substantial capacity and safety margins. The implication of this result is that, the thicker plates significantly improve resistance to large deflections and enhance structural safety. The decrease in load capacity with increasing aspect ratio highlights the importance of optimal geometry. These findings emphasize the need to consider both elastic and plastic behaviors, material properties, real-world imperfections, and compliance with design standards to prevent instability and ensure durability under large span and deflection scenarios. Balanced design ensures structural stability, safety, and serviceability in practical applications.
This numerical analysis of the result in Fig. 10 indicates that increasing plate thickness from 5 mm to 15 mm markedly enhances the load-carrying capacity under large span (5000 mm) and maximal deflection (5000 mm). For 5 mm thick plates, the elastic limit load () decreases progressively from approximately 0.00404 N/mm at aspect ratio 1 to 0.00135 N/mm at aspect ratio 2, with some values approaching or falling below zero, such as –0.00022 N/mm at aspect ratio 1.7. Correspondingly, the maximum load before yield () drops from about 0.1317 N/mm to negative values at higher aspect ratios.
Fig. 9Graph of critical lateral imposed load vs aspect ratio plate for span of 5 m at (wa= 3 mm)
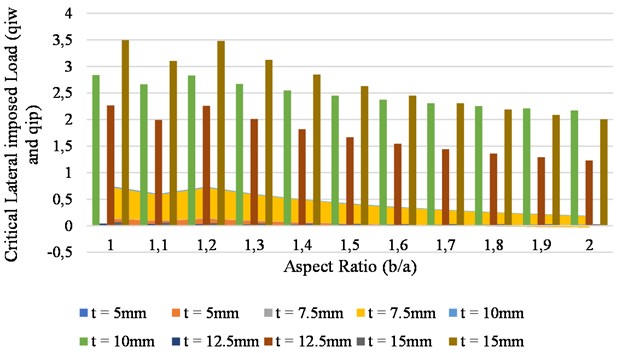
For 15 mm thick plates, remains higher, decreasing from roughly 0.1184 N/mm to 0.0455 N/mm, and remains positive, ranging from 3.50 N/mm to just over 2 N/mm across all aspect ratios. The implication of this result is that, the negative values of or suggest a state of instability or that the model predicts no real resistance beyond certain aspect ratios – essentially indicating failure modes such as buckling or post-buckling behavior where the structure no longer sustains additional load elastically or plastically. It highlights potential excessive slenderness or geometric configurations prone to instability under lateral loading, emphasizing the need for careful design, reinforcement, or geometry optimization to avoid such failure modes.
Fig. 10Graph of critical lateral imposed load vs aspect ratio plate for span of 5 m (wa= 3 mm)
Summarily, the higher thickness markedly improves the safety margins. The decreasing trend of capacity with increasing aspect ratio underscores the importance of controlling slenderness. These findings reinforce the necessity to incorporate elastic-plastic transition considerations, real-world imperfections, and standards to ensure structural safety and serviceability under extreme conditions. Negative results serve as a critical warning against overestimating load capacities in overly slender or poorly supported configurations.
The extensive data across Figs. 2 to 10 illustrate clear trends in the critical lateral imposed load () and the load capacity before yield () for various plate thicknesses, spans, aspect ratios, and deflections. In some data (e.g., in previous tables with large aspect ratios), negative or very low or suggest the possibility of instability or potential failure, especially in slender configurations or at higher spans where the model predicts no meaningful capacity before failure. These negative values highlight the importance of geometric ratios, reinforcement, and possibly incorporating buckling considerations into the design to prevent failure modes not captured by simple elastic or plastic load predictions.
In total, the data in the tables emphasize that increasing plate thickness significantly enhances load resistance; larger span and aspect ratios tend to diminish load capacity, indicating the importance of optimal geometric design. These trends align with the principles of elastic and plastic behavior, ensuring structures can safely withstand applied loads, considering real-world imperfections and standards. Negative or diminishing capacity values at high aspect ratios serve as warnings for potential instability, underscoring the need for adequate reinforcement and conservative design approaches. Comparative analysis were made between result found in Figs. 2 to 10 and following observations were made:
1) Influence of plate thickness on critical load capacities.
Increasing thickness from 5 mm to 15 mm substantially raises both and values across all aspect ratios and span scenarios. For example, at span 1000 mm, aspect ratio 1, under an allowable deflection of 5000 mm, increased from approximately 0.553 N/mm (5 mm) to 14.94 N/mm (12.5 mm), and from about 12.53 N/mm to 115.11 N/mm – over an order of magnitude higher, indicating much improved load capacity and safety margins with increased thickness. Thicker plates (15 mm) consistently exhibit substantially higher critical lateral () and yield () loads compared to 5 mm plates, across all aspect ratios and span/deflection scenarios. For span 3000 mm at 100 % deflection (Figs. 5 and 6), for 15 mm plates ranges from ~0.02275 to 0.05275 N/mm, whereas for 5 mm plates, it varies from ~0.00762 to 0.553 N/mm in different tables, reflecting the massive capacity increase with increased thickness. The implication is that the material and section design must favor increased thickness or reinforcement in cases where load capacity is critical, especially in larger span, high deflection, or slender aspect ratio structures.
A broad exploration covers aspect ratios 1–2, spans of 1000, 3000, and 5000 mm, and thicknesses 5–15 mm. The results reveal that thickness markedly increases load capacity and safety margins, while larger aspect ratios and longer spans reduce stability, offering practical guidance for balancing stiffness, strength, and stability. Concrete examples illustrate how elastic and yield limits vary with geometry and thickness. For instance, a 15 mm plate with a 1000 mm span exhibits substantially higher elastic- and yield-limit values at an aspect ratio of 1 than at 2, whereas a 5 mm plate shows smaller limits with notable but reduced variation across aspect ratios. These exemplars translate theory into tangible design margins.
2) Effect of aspect ratio on load capacity.
For each thickness, as the aspect ratio increases from 1 to 2, there is a decrease in and values, reflecting reduced stiffness and load capacity in more slender configurations. For example, in Table 1 at 5 mm thickness and span 1000 mm: drops from 0.553 N/mm (aspect ratio 1) to 0.216 N/mm (aspect ratio 2), declines from 12.53 N/mm to 8.39 N/mm over the same aspect ratios. Across all tables, increasing the aspect ratio from 1 toward 2 reduces both and values, indicating decreased stiffness and load-bearing capacity in more slender configurations. For example, in Fig. 6 (span 3000 mm, deflection 3000 mm) for 5 mm plates, decreases from ~0.0201 N/mm (aspect ratio 1) to ~0.00762 N/mm (aspect ratio 2). A similar trend exists for , declining from ~1.0503 N/mm to ~0.5901 N/mm in the same cases. The implication is that maintaining a lower aspect ratio (closer to 1) enhances load capacity and stability, emphasizing the importance of geometric optimization in design.
3) Influence of span and deflection.
When allowable deflections increase from 1000 mm to 5000 mm (Figs. 2 and 4), values rise, indicating the structure can sustain higher loads before elastic limit at larger deflections. Conversely, at span 3000 mm (Figs. 5 and 6), the and values are generally lower than at 1000 mm span, indicating increased span reduces load capacity due to increased slenderness and potential for buckling. Higher spans and larger allowable deflections (e.g., 5000 mm span vs. 3000 mm span, or doubling deflection limits) generally increase the absolute values of and , but the relative differences due to aspect ratios and thickness remain consistent. For instance, at span 3000 mm, values are greater than at span 5000 mm in the datasets, indicating stiffer responses at shorter spans. The implication is that shorter spans or stricter deflection limits will result in higher load capacities; this must inform design choices balancing safety, serviceability, and material economy.
4) Implications elastic vs. plastic capacity and behavior in structural design.
In many cases, (yield capacity) greatly exceeds (elastic limit capacity), especially for thicker plates, reflecting the structure's capacity to undergo plastic deformation before failure, thus ensuring better safety margins, consistent with design standards [31]. The (yield capacity) is consistently much higher than (elastic limit), providing a significant safety margin before reaching material yield or failure. The values of at the same aspect ratios and spans are roughly 2 to 4 orders of magnitude higher than , indicating ample plastic reserve capacity. The negative or near-zero values for (notably in some aspect ratios at high spans and large deflections) suggest the potential for instability or failure, especially in slender configurations or under extreme conditions, emphasizing careful design and reinforcement.
Thicker plates and reinforced sections are essential for safety, especially in high-span applications. As some values approach zero or become negative, the importance of considering buckling, geometric imperfections, and post-yield behavior in design is emphasized. Large disparities between and suggest that while elastic behavior governs initial design considerations, the capacity for plastic deformation provides a safety buffer, provided the structure is designed within these limits [31, 32]. The decreasing trend in load capacities with increasing aspect ratio or span indicates that dynamic loads, load redistribution, and potential buckling modes should be carefully analyzed in critical applications [33, 34]. In slender, large-span configurations under substantial deflection, the model identifies potential instability modes such as buckling, evidenced by negative or near-zero capacities. This emphasizes the method’s value for robust design, not merely deflection prediction. Integrated design framework: The approach unifies geometry, material isotropy, and reinforcement into a single predictive model for flexural and shear responses, supporting safer, more serviceable, and cost-effective structures without reliance on ad hoc corrections or exhaustive trial-and-error.
5) Comparative analysis and viability of the present model.
A thorough comparison of these datasets reveals clear patterns about the structural behavior of simply supported rectangular plates under a uniform transverse load, across varying aspect ratios, thicknesses, spans, and deflections. Table 1 shows that the present work is in close agreement with the findings of sources [35-40], especially at larger span-to-thickness ratios. The largest discrepancy occurs at the smallest ratio considered (ratio 4), at average of average 6.2 %, while the gap narrows at higher ratios (2.5 % at ratio 10 and ~1.4 % at ratios 100 and above). This indicates the present model more accurately represents 2D or quasi-2D behavior than 3D-affected responses, particularly where 3D effects are strongest.
The results show that increasing thickness markedly boosts load capacity and safety margins, while larger aspect ratios and longer spans reduce stability. Concrete illustrations indicate that thick plates with short spans can sustain high elastic and yield loads, whereas thin or slender configurations are susceptible to buckling under large spans. Strengths include a solid first-principles basis, explicit critical-load expressions, and direct alignment with design practice. Limitations arise from the underlying TSDT assumptions (material linearity, isotropy/anisotropy treatment, boundary conditions, and nonlinear geometric effects) and potential sensitivity to boundary conditions, loading simplifications, and calibration needs for complex geometries or multi-physics couplings (e.g., thermal effects, residual stresses).
In sum, the model exhibits consistent and acceptable accuracy in regimes where 2D/Midlin-type (shear deformation theory) assumptions dominate but shows notable limitations where 3-D exact plate theory become influential, suggesting boundary conditions or coupling mechanisms not fully captured by the current formulation. To achieve broader validation, this study’s results are compared with the prior work of authors [35-40], as summarized in Table 1, 2 and 3 with consideration of the deflection parameter.
Table 1Non dimensional deflection (w) for square SSSS plate at span-thickness ratio (a/t) of 4
Scholars | Theories | Deflection () | Difference, % | Average difference, % |
Present Study | Third order shear deformation theory | 6.155 | 6.2 | |
Sayaad and Ghugal (2012) [35] | Exponential order shear deformation theory (ESDT) | 5.816 | 5.51 | |
Reddy (2021) [36] | Higher order shear deformation theory (HSDT) | 5.869 | 4.65 | |
Ghugal and Sayyad (2018) [37] | Trigonometric shear deformation theory (TSDTri) | 5.680 | 7.72 | |
Ghugal and Sayyad (2003) [38] | Hyperbolic order shear deformation theory (HPSDT) | 5.858 | 4.82 | |
Mindlin (1951) [39] | First order shear deformation theory (FSDT) | 5.633 | 8.48 |
Table 2Non dimensional deflection (w) for square SSSS plate at span-thickness ratio (a/t) of 10
Scholars | Theories | Deflection () | Difference, % | Average difference, % |
Present Study | Third order shear deformation theory | 4.774 | 2.5 | |
Sayaad and Ghugal (2012) [35] | Exponential order shear deformation theory (ESDT) | 4.658 | 2.43 | |
Reddy (2021) [36] | Higher order shear deformation theory (HSDT) | 4.666 | 2.26 | |
Ghugal and Sayyad (2018) [37] | Trigonometric shear deformation theory (TSDTri) | 4.625 | 3.12 | |
Ghugal and Sayyad (2003) [38] | Hyperbolic order shear deformation theory (HPSDT) | 4.665 | 2.28 | |
Mindlin (1951) [30] | First order shear deformation theory (FSDT) | 4.670 | 2.18 | |
Kirchhoff (1850) [40] | Classical plate theory (CPT) | 4.436 | 7.08 | 7.1 |
Table 3Non dimensional deflection (w) for square SSSS plate at span-thickness ratio (a/t) of 100
Scholars | Theories | Deflection () | Difference, % | Average difference, % |
Present Study | Third order shear deformation theory | 4.52 | 1.4 | |
Mindlin (1951) [39] | First order shear deformation theory (FSDT) | 4.47 | 1.11 | |
Kirchhoff (1850) [40] | Classical plate theory (CPT) | 4.44 | 1.77 |
6) Validation perspective, practical implications and recommendations.
The present Third Order Shear Deformation Theory (TSDT) results for the thick square plate show sensible consistency with both thin- and thick-plate behavior across different span-to-thickness ratios. At 10, the agreement improves to ~2-3 %, consistent with the expected convergence toward thin-plate behavior. At 100, differences reduce to roughly 1-2 % with CPT/FSDT, illustrating the asymptotic convergence to classical thin-plate predictions. In the thin-plate limit (large ), refined theories such as HSDT, ESDT, TSDTri and HPSDT are expected to converge toward classical plate theory (CPT) predictions because transverse shear effects become less influential [13, 36]. Indeed, at 100, the TSDT prediction (4.52) closely matches CPT-based values (4.44-4.67). The small differences (about 1.1 % to 1.8 %) fall within the range typically observed when different refined theories approach the thin-plate limit, supporting the validity of the present TSDT formulation for both thin- and thick-plate regimes and align with standard conclusions in plate theory literature [13, 36, 40].
Present study results are reasonably validated by cross-comparison with multiple established theories. The small percentage differences (generally under 3-4 % for 10 and up to ~8 % for 4) indicate that the model is consistent and credible. If the structure is thick (low ), using a higher-order shear deformation theory (e.g., TSDT or ESDT/HPSDT) yields more reliable deflection predictions than FSDT or CPT. The result of the present work show TSDT provides comparable accuracy to other refined theories within a few percent. For very thin plates (high ), CPT or FSDT may suffice, as indicated by the small differences with higher-order theories.
For the thick-plate regime ( around 4-10), the spread between TSDT and the higher-order shear deformation theories (ESDT, HSDT, TSDTri, HPSDT) is modest, generally between 2 % and 8 % at 4 and about 2 %-3 % at 10. This level of discrepancy is expected given the distinct shear-deformation assumptions inherent to each theory and the continued influence of transverse shear in thicker plates. The largest deviation at 4 relative to CPT is not surprising, since CPT neglects transverse shear altogether [13, 41]; in that case, the TSDT result is consistently higher, reflecting the impact of including higher-order shear effects on deflection predictions in thick configurations.
Generally, the present TSDT results demonstrate good validity across thicknesses. The agreement is typically within 2 %-3 % for 10 and within about 1 %-8 % for 4 when compared with other higher-order theories, which is a realistic range given differing kinematic formulations. The somewhat larger scatter at 4 is expected due to the stronger role of shear in thick plates and the sensitivity to the chosen shear-strain-displacement relations. This pattern provides a credible validation window rather than a single perfect match.
In terms of practical interpretation, refined theories are preferable for thick plates because transverse shear becomes non-negligible, and the TSDT results align with this expectation by showing comparable accuracy to other advanced theories. For very thin plates, CPT or FSDT remains adequate, as indicated by the small deviations from higher-order predictions. The theory used and solutions obtained in the current study are recommended for analysis of rectangular plate under such boundary condition and load configuration.
8. Conclusions
This research enhances the understanding of rectangular plate behavior under transverse loads using a refined shear deformation theory. By incorporating a third-order shear profile and energy variational calculus, it accurately predicts critical loads, deflections, and shear stresses. The model effectively overcomes the limitations of earlier theories by providing precise estimates of flexural and shear characteristics, particularly for plates with all edges simply supported. The results demonstrate that increasing plate thickness markedly improves load capacity and safety margins, whereas higher aspect ratios and spans tend to reduce structural stability – highlighting the importance of optimal geometric design. Validation against existing studies confirms the model’s reliability, reaffirming that thicker plates offer greater capacity while slender configurations are more prone to instability. The observed trends – such as differences between elastic limit loads and yield loads – underscore the necessity of designing within elastic limits for serviceability, while also considering plastic capacity for ultimate safety. Negative or very low capacity values in certain configurations serve as warnings of potential instability, especially in slender plates, emphasizing the need for reinforcement, appropriate material selection, and stability considerations. Generally, this model provides a reliable and efficient tool for predicting structural performance, supporting safer, more economical design solutions.
Recommendations:
1) Utilize the developed model to accurately estimate critical loads, deflections, and shear stresses in rectangular plates.
2) Increase plate thickness or opt for materials with higher yield strengths in critical or heavily loaded regions to enhance capacity.
3) Favor designs with lower aspect ratios and shorter spans where possible to improve stability and load-bearing ability.
4) Incorporate conservative safety margins into the design, especially for plates with high aspect ratios or large spans, to mitigate instability risks.
5) Choose materials with higher yield stresses to increase the maximum yield load ().
6) Reinforce slender or thin plates with edge stiffeners or lateral supports to prevent buckling and structural failure.
7) Ensure the loads stay within the elastic limit () to maintain serviceability, keeping deflections within the allowable limits.
8) Confirm that the ultimate load capacity () exceeds expected maximum loads, accounting for dynamic effects and imperfections.
9) Maintain operational loads within elastic limits () to ensure serviceability while preventing excessive deflections (e.g., 1, 3, or 5 mm).
10) Use for serviceability checks and as the threshold for maximum safe load prior to failure, informing reinforcement and material selection.
11) Employ this advanced model during the design process to enhance analysis accuracy, improve reliability, and reduce time-consuming post-design evaluations, leading to safer, more cost-effective, and compliant plate structures.
References
-
P. Menon, “Advanced materials in structural engineering: innovations and applications,” International Research Journal of Engineering Science, Technology and Innovation, Vol. 11, No. 1, 2025.
-
W. Chen and J. N. Reddy, Shear Deformation Theory for Plates and Shells. Springer, 2019.
-
F. C. Onyeka, “Direct analysis of critical lateral load in a thick rectangular plate using refined plate theory,” International Journal of Civil Engineering and Technology, Vol. 10, No. 5, pp. 492–505, 2019, https://doi.org/10.14429/ijcet.10.5.492
-
F. C. Onyeka and T. E. Okeke, “New refined shear deformation theory effect on non-linear analysis of a thick plate using energy method,” Arid Zone Journal of Engineering, Technology and Environment, Vol. 17, No. 2, pp. 121–140, 2021.
-
J. N. Reddy, Theory and Analysis of Elastic Plates and Shells. CRC Press, 2006, https://doi.org/10.1201/9780849384165
-
H. S. Kim and D. G. Lee, “Design and manufacture of stainless steel/carbon epoxy hybrid shaft for cleaning large LCD glass panels,” Composite Structures, Vol. 80, No. 2, pp. 279–289, Sep. 2007, https://doi.org/10.1016/j.compstruct.2006.05.008
-
F. C. Onyeka and T. E. Okeke, “Analysis of critical imposed load of plate using variational calculus,” Journal of Advances in Science and Engineering, Vol. 4, No. 1, pp. 13–23, Jan. 2021, https://doi.org/10.37121/jase.v4i1.125
-
M. M. Bhatti and A. Shakir, “A review of higher-order shear deformation theories,” Journal of Structural Engineering and Management, Vol. 4, No. 2, pp. 73–81, 2017, https://doi.org/10.3/23872
-
T. Watanabe and K. Kaneko, “Comparative study on shear deformation theories for thick plates,” Journal of Sound and Vibration, Vol. 335, No. 24, pp. 4451–4466, 2015.
-
P. Kuhlmey and R. Fischer, “Thick plate analysis using higher order shear deformation theory,” Mechanics of Advanced Materials and Structures, Vol. 23, No. 8, pp. 917–926, 2016.
-
F. C. Almeida and C. F. Santos, “Bending of thick plates using a refined higher-order shear deformation theory,” Composite Structures, Vol. 192, pp. 469–478, 2018.
-
W. Chen and J. N. Reddy, “Bending analysis of thick plates using mindlin’s theory,” Applied Mechanics Reviews, Vol. 71, No. 5, p. 050802, 2019.
-
J. N. Reddy, Mechanics of Laminated Composite Plates and Shells. CRC Press, 2003, https://doi.org/10.1201/b12409
-
R. D. Mindlin, “Influence of rotary inertia and shear on bending of elastic plates,” Journal of Applied Mechanics, Vol. 18, No. 1, pp. 31–38, 1951.
-
S. P. Timoshenko and J. N. Goodier, Theory of Elasticity. Auckland: McGraw-Hill Inc, 1970.
-
F. C. Onyeka, “Effect of stress and load distribution analysis on an isotropic rectangular plate,” Arid Zone Journal of Engineering, Technology and Environment, Vol. 17, No. 1, pp. 9–26, 2021.
-
J. C. Ezeh, O. M. Ibearugbulem, L. O. Ettu, L. S. Gwarah, and I. C. Onyechere, “Application of shear deformation theory for analysis of CCCS and SSFS rectangular isotropic thick plates,” Journal of Mechanical and Civil Engineering (IOSR-JMCE), Vol. 15, No. 5, pp. 33–42, 2018, https://doi.org/10.9790/1684-1505023342
-
F. Onyeka, C. Nwadavid, and B. Okwudili Mama, “Static bending solutions for an isotropic rectangular clamped/simply supported plates using 3-D plate theory,” Journal of Computational Applied Mechanics, Vol. 54, No. 1, pp. 1–18, Mar. 2023, https://doi.org/10.22059/jcamech.2022.349835.764
-
C. C. Ike, “A third-order shear deformation plate bending formulation for thick plates: first principles derivation and applications,” Mathematical Models in Engineering, Vol. 9, No. 4, pp. 144–168, Dec. 2023, https://doi.org/10.21595/mme.2023.23688
-
F. C. Onyeka, T. E. Okeke, and C. D. Nwa-David, “Static and buckling analysis of a three-dimensional (3-D) rectangular thick plates using exact polynomial displacement function,” European Journal of Engineering and Technology Research, Vol. 7, No. 2, pp. 29–35, Mar. 2022, https://doi.org/10.24018/ejeng.2022.7.2.2725
-
F. Onyeka, T. Edozie Okeke, C. David Nwadavid, and B. Okwudili Mama, “Analytical elasticity solution for accurate prediction of stresses in a rectangular plate bending analysis using exact 3-D theory,” Journal of Computational Applied Mechanics, Vol. 54, No. 2, pp. 167–185, Jun. 2023, https://doi.org/10.22059/jcamech.2022.351892.781
-
F. Onyeka, T. Edozie Okeke, and J. Wasiu, “Strain-displacement expressions and their effect on the deflection and strength of plate,” Advances in Science, Technology and Engineering Systems Journal, Vol. 5, No. 5, pp. 401–413, Jan. 2020, https://doi.org/10.25046/aj050551
-
F. C. Onyeka and D. E. Osegbowa, “Stress analysis of thick rectangular plate using higher order polynomial shear deformation theory,” FUTO Journal Series – FUTOJNLS, Vol. 6, No. 2, pp. 142–161, 2018.
-
X. Hu and E. Iarve, “Development of a higher-order shear deformation theory for analysis of thick plates,” International Journal of Mechanical Sciences, Vol. 118, pp. 108–115, 2016.
-
W. Chen and J. N. Reddy, “Shear deformation theory for analysis of composite plates,” Journal of Applied Mechanics, Vol. 71, No. 1, pp. 123–132, 2004.
-
Batra and R. C., “Analysis of plates and shells using higher-order shear deformation theory,” Mechanics of Advanced Materials and Structures, Vol. 11, No. 6, pp. 175–183, 2004.
-
H. K. Jassim, H. Ahmad, A. Shamaoon, and C. Cesarano, “An efficient hybrid technique for the solution of fractional-order partial differential equations,” Carpathian Mathematical Publications, Vol. 13, No. 3, pp. 790–804, Dec. 2021, https://doi.org/10.15330/cmp.13.3.790-804
-
F. M. Al-Askar, C. Cesarano, and W. W. Mohammed, “Multiplicative brownian motion stabilizes the exact stochastic solutions of the Davey-Stewartson equations,” Symmetry, Vol. 14, No. 10, p. 2176, Oct. 2022, https://doi.org/10.3390/sym14102176
-
O. Moaaz, C. Cesarano, and A. Muhib, “Some new oscillation results for fourth-order neutral differential equations,” European Journal of Pure and Applied Mathematics, Vol. 13, No. 2, pp. 185–199, Apr. 2020, https://doi.org/10.29020/nybg.ejpam.v13i2.3654
-
V. T. Ibeabuchi, O. M. Ibearugbulem, C. Ezeah, and O. O. Ugwu, “Elastic buckling analysis of uniaxially compressed CCCC stiffened isotropic plates,” International Journal of Applied Mechanics and Engineering, Vol. 25, No. 4, pp. 84–95, Dec. 2020, https://doi.org/10.2478/ijame-2020-0051
-
“Steel Construction Manual,” American Institute of Steel Construction, 2016.
-
“Eurocode 3: Design of steel structures – Part 1-5: Plated structural elements,” European Committee for Standardization, 2005.
-
R. W. Clough and J. Penzien, Dynamics of Structures. Computers and Structures, Inc., 2010.
-
F. C. Onyeka and B. O. Mama, “Analytical study of bending characteristics of an elastic rectangular plate using direct variational energy approach with trigonometric function,” Emerging Science Journal, Vol. 5, No. 6, pp. 916–928, Dec. 2021, https://doi.org/10.28991/esj-2021-01320
-
A. S. Sayyad and Y. M. Ghugal, “Bending and free vibration analysis of thick isotropic plates by using exponential shear deformation theory,” Applied and Computational Mechanics, Vol. 6, pp. 65–82, 2012.
-
J. N. Reddy, “A simple higher-order theory for laminated composite plates,” Journal of Applied Mechanics, Vol. 51, No. 4, pp. 745–752, Dec. 1984, https://doi.org/10.1115/1.3167719
-
Y. M. Ghugal and M. D. Pawar, “Buckling and vibration of plates by hyperbolic shear deformation theory,” Journal of Aerospace Engineering and Technology, Vol. 1, No. 1, pp. 1–12, 2011.
-
Y. M. Ghugal and A. S. Sayyad, “Free vibration of thick orthotropic plates using trigonometric shear deformation theory,” Latin American Journal of Solids and Structures, Vol. 8, pp. 229–243, 2010, https://doi.org/0.1590/s1679-78252011000300002
-
R. D. Mindlin, “Influence of Rotatory Inertia and Shear on Flexural Motions of Isotropic, Elastic Plates,” Journal of Applied Mechanics, Vol. 18, No. 1, pp. 31–38, Mar. 1951, https://doi.org/10.1115/1.4010217
-
G. Kirchhoff, “On the vibrations of a circular elastic plate,” (in German), Annalen der Physik, Vol. 157, No. 10, pp. 258–264, Mar. 2006, https://doi.org/10.1002/andp.18501571005
-
E. Carrera, S. Brischetto, and P. Nali, Plates and Shells for Smart Structures: Classical and Advanced Theories for Modeling and Analysis. Wiley, 2011, https://doi.org/10.1002/9781119950004
About this article

The authors have not disclosed any funding.
The datasets generated during and/or analyzed during the current study are available from the corresponding author on reasonable request.
The authors declare that they have no conflict of interest.
