Abstract
In modern industry, thin-walled components have become critical elements in high-end manufacturing due to their unique structure and lightweight properties. However, their production process is prone to chatter, which severely impacts machining quality and efficiency. Although ultrasonic vibration grinding technology can partially suppress chatter, the issue remains unresolved. To address this, this paper proposes an online chatter monitoring method based on an improved convolutional neural network (ICS-CNN) and the Sparrow Optimization Algorithm (SSA). This approach enhances key information capture through multi-scale feature extraction and attention mechanisms, while incorporating residual connections and a feature pyramid structure to strengthen the model's ability to identify subtle chatter characteristics. Input signals undergo frequency domain analysis and filtering to improve data quality. The SSA algorithm is further employed to optimise network parameters, constructing the SSA-ICS-CNN intelligent monitoring model. Experimental results demonstrate an identification accuracy of 98.37 % with a decision time of merely 147 milliseconds, while visualisation techniques validate its discrimination precision. Compared to conventional convolutional neural networks, this approach achieves significant improvements in both recognition accuracy and response speed, effectively overcoming limitations inherent in traditional methods reliant on manual feature extraction and dynamic response delays.

Highlights
- Innovates ICS-CNN network integrating Inception, CBAM attention, and FPN, accurately capturing non-stationary chatter frequency-domain features to address incomplete extraction in traditional CNNs.
- Applies Sparrow Search Algorithm (SSA) for hyperparameter optimization (learning rate 0.0026, batch size 32), avoiding local optima and enhancing model convergence and stability.
- Achieves 98.37% accuracy, 147 ms decision time, outperforming comparative models and integrable into CNC systems for intelligent thin-walled part machining quality control.
1. Introduction
In recent years, with the widespread application of high-speed milling technology and the iterative upgrading of advanced manufacturing process equipment, the processing efficiency and precision have been significantly improved. However, the machining of thin-walled parts still faces many challenges. Among them, the chatter phenomenon significantly affects the manufacturing of thin-walled parts. As a self-excited vibration of the tool-workpiece-machine tool system in an unstable state during machining, chatter degrades part machining quality, accelerates tool wear, and impairs machine tool performance. Therefore, detecting and suppressing chatter has become a critical issue in modern manufacturing.
Ultrasonic vibration milling technology effectively suppresses dynamic fluctuations in cutting force through high-frequency vibration effects, synchronously controls heat accumulation in the machining zone, and achieves optimization of workpiece surface roughness and reduction of tool wear rate, demonstrating certain inhibitory effects on chatter. Thus, it has been widely applied and deeply studied. For example, Wu C. et al. [1] found that ultrasonic longitudinal-torsional vibration milling significantly improves the equivalent stiffness compared to conventional milling. Kan Z. et al. [2] conducted ultrasonic vibration milling experiments on TC4 titanium alloy and showed that ultrasonic vibration milling significantly enhances the surface tissue uniformity during dry cutting. Jianhui L et al. [3] performed ultrasonic vibration milling experiments on 7075 aluminum alloy using a single-factor test method. Through morphology observation and analysis with a super-depth-of-field measuring instrument and white-light diffractometer, they found that the workpiece surface after ultrasonic milling exhibits a uniform and regular scaly structure with significantly reduced surface roughness. These studies confirm that ultrasonic vibration milling technology can partially suppress chatter.
However, it should be noted that although ultrasonic vibration milling has advantages, it still cannot completely eliminate the chatter phenomenon. To further accurately detect chatter, online monitoring of chatter needs to be further studied. Selecting appropriate monitoring signals is the basis for achieving accurate chatter monitoring. There are various monitoring signals. Tlusty and Andrews [4] found that force signals are more sensitive to chatter features than other signals because force is the direct cause of workpiece and tool vibration. Liu et al. [5] used fast kurtosis and frequency band analysis of milling force signals to monitor chatter. Fu et al. [6] achieved online monitoring of the cutting state by collecting vibration signals of the spindle. Wang et al. [7] analyzed the robot milling process by extracting vibration signals, and the experimental results showed that the signals were robust. Gao et al. [8] studied and found that sound signals can obtain more chatter information, and it is feasible to use acoustic signals for chatter monitoring in machining. The occurrence of chatter is also accompanied by changes in current signals, but current signals are not sensitive to slight changes in processing parameters. Some scholars have also found that a single sensor cannot capture all features of chatter. Tran et al. [9] proposed a multi-sensor fusion scheme, using microphones and acceleration sensors to monitor the occurrence of chatter during milling.
However, due to the influence of sensor acquisition accuracy and the surrounding environment, the collected physical signals often contain unwanted noise that interferes with subsequent signal analysis. Therefore, processing of raw signals is necessary. Common signal processing methods currently include time-domain analysis, frequency-domain analysis, and time-frequency-domain analysis. Ye et al. [10] calculated the root mean square error (RMSE) of time-domain sample data and defined the ratio of its standard deviation to the mean variance as the coefficient of variation (CV) for chatter identification. Although time-domain analysis is simple and intuitive, it is challenging to monitor time-varying machining states with limited parameters. Rumusan et al. [11] used Fourier transform to convert measured signals into the frequency domain and evaluated the stability of the cutting process by the ratio of the maximum value of the cutting force signal to its average amplitude. In the early stage of chatter, both time-domain and frequency-domain methods struggle to capture real-time signal changes and extract features. To address these limitations, time-frequency-domain signal processing schemes were proposed. Yao et al. [12] found that the energy of each frequency band changes regularly and identified chatter through the energy ratio of the chatter frequency band. Zhang et al. [13] decomposed signals using wavelet packet transform based on the energy accumulation principle during chatter, and completed chatter identification through the energy entropy and energy distribution of sub-signals. Sun and Xiong [14] et al. proposed an improved weighted wavelet packet entropy (WWPE) method to solve for optimal weights during steady-state and chatter conditions. Fu et al. [6] first decomposed signals using empirical mode decomposition (EMD), then selected the intrinsic mode function (IMF) with the largest energy ratio based on the energy limit coefficient. Finally, Hilbert-Huang transform (HHT) was applied to the IMF, and normalized energy ratio and CV were calculated for chatter identification. Cao et al. [15] proposed using ensemble empirical mode decomposition (EEMD) to analyze chatter signals and extracted two nonlinear indicators for monitoring. Li et al. [16] proposed chatter monitoring based on variational mode decomposition (VMD) and power spectral entropy difference, using the entropy difference as a feature to determine milling states. Experiments verified that this method can identify early-stage chatter. Liu et al. [17] performed real-time chatter monitoring based on VMD and energy entropy. However, signal decomposition requires presetting the number of decomposition layers and penalty factors. Yang et al. [18] proposed optimizing these parameters using a simulated annealing algorithm to avoid errors caused by manual setting, ensuring more accurate VMD performance.
Most of the above methods rely on single features, but different processing conditions may lead to changes in feature sensitivity, and the lack of a universal threshold standard results in insufficient generality and robustness of feature extraction. Meanwhile, there are problems of strong parameter dependence and insufficient adaptability. For example, VMD (Variational Mode Decomposition) [19] requires presetting the number of decomposition layers and penalty factors, and its performance is highly dependent on parameter selection. Although algorithms such as simulated annealing are used to optimize parameters, this increases computational complexity and may not guarantee a global optimum. Traditional heuristic algorithms, such as genetic algorithms [20] and particle swarm optimization algorithms [21], are highly prone to falling into local optimal solutions during the optimization process, which in turn leads to real-time performance and computational efficiency issues. Therefore, it is necessary to carry out a series of explorations based on traditional heuristic algorithms or adopt novel heuristic algorithms to address this challenge.
Most existing studies on flutter monitoring rely on traditional CNN architectures [22] or their improved versions for signal feature extraction [23]. However, these models generally have two key problems: Firstly, they do not optimize for the frequency domain characteristics of the flutter signals[24] (such as the frequency band aggregation of flutter energy and non-stationary spectral distribution), resulting in incomplete extraction of key discriminative features [25]; Secondly, traditional CNNs have the problem of redundant convolutional layers [26], which not only increase the model complexity but also reduce the inference speed - this is a significant defect for real-time online monitoring scenarios [27]. In contrast, the ICS-CNN network proposed in this study achieves structural innovation through the following content: integrating an improved sparse residual link channel mechanism in the convolutional layers. This mechanism not only enhances the cross-channel interaction ability of frequency domain features but also reduces the generation of redundancy through residual links. At the same time, it optimizes the network depth and convolution kernel size to ensure the accuracy of feature extraction and meet the real-time requirements of online monitoring. The existing vibration monitoring methods based on neural networks mostly adopt manual parameter tuning or simple heuristic algorithms (such as Particle Swarm Optimization algorithm, PSO) for hyperparameter optimization. There are two significant drawbacks: Firstly, manual parameter tuning relies on empirical knowledge and is prone to getting stuck in local optima, resulting in unstable model performance; Secondly, the optimization based on PSO has a slow convergence speed when dealing with high-dimensional hyperparameters (such as learning rate, number of convolution filters, dropout rate), and is prone to premature convergence problems, unable to find the global optimal parameter combination. This study introduces the Sparrow Optimization Algorithm (SSA) to optimize the hyperparameters of the ICS-CNN model. It has two core advantages: The SSA simulates the foraging and anti-predation behaviors of sparrows, which enables a faster convergence speed and stronger global search capability; the hyperparameter combinations optimized by SSA maintain stable performance. The SSA-ICS-CNN model proposed in this study achieves a balance among multiple performance indicators: firstly, it has high accuracy: the recognition accuracy reaches 98.37 %, while the Matthews Correlation Coefficient (MCC) is 0.9327 and the F1 score is 0.9717. Secondly, it has ultra-fast inference: the decision time is only 147 ms, meeting the real-time requirements for online monitoring. In summary, this study proposes solutions to the limitations of existing flutter monitoring models in feature extraction, hyperparameter optimization, and comprehensive performance. The constructed SSA-ICS-CNN system provides a more efficient and robust technical path for online flutter monitoring in industrial processing, and also lays the foundation for intelligent control of processing quality
In summary, this paper proposes a neural network system for online chatter monitoring based on the Sparrow Optimization Algorithm (SSA) and ICS-CNN. Chapter 1 constructs the ICS-CNN network model and introduces its components; Chapter 2 describes the experimental setup, collects corresponding force data, preprocesses the data using a band-stop filter, and constructs a 2D spectral diagram dataset through FFT analysis and normalization; Chapter 3 presents the chatter monitoring process of the SSA-ICS-CNN model and optimizes hyperparameters using the sparrow algorithm; Chapter 4 conducts performance verification and comparative experiments with other models. The results show that the model demonstrates excellent performance in chatter recognition, with a recognition accuracy of 98.37 %, a Matthew Correlation Coefficient (MCC) of 0.9327, an F1 score of 0.9717, and a judgment time of only 147 ms. Compared with other models, this model has significant advantages in chatter monitoring, enabling efficient and accurate discrimination of chatter states, while also featuring faster convergence speed. This effectively ensures high-precision chatter recognition under complex working conditions.
2. Structural design of ICS-CNN network model
In the scope of this paper, a new network model (ICS-CNN) is innovatively constructed, which integrates a variety of advanced technologies and structures to achieve excellent performance. Its core components include: the Inception module based on multi-scale feature fusion, the sparse residual network integrating the CBAM spatial attention mechanism, and the FPN multi-scale fusion structure.
2.1. Multi-scale feature extraction-inception module
In traditional convolutional neural networks, fixed-size convolution kernels (such as 3×3 or 5×5) are typically used for feature extraction, which may miss important feature information at different scales. The Inception-V1 module, however, simultaneously captures local detail information (via small convolution kernels) and broader semantic information (via large convolution kernels) by parallelly using 1×1, 3×3, and 5×5 convolution kernels along with 3×3 max pooling operations. The 1×1 convolution kernel serves as a dimensionality reduction component in this structure.
Before performing 3×3 and 5×5 convolutions, 1×1 convolutions are first used to reduce the dimensionality of input channels, which minimizes the scale of network parameters and reduces computational complexity. This allows the network to increase both depth and width while avoiding overfitting and computational resource waste caused by excessive parameters. Additionally, this approach enriches the extracted features, which are ultimately fused along the channel dimension and used as input for the next module. This Inception structure broadens the width of each layer and increases network depth without additional computational overhead, thereby enhancing the generalization ability and accuracy of chatter detection.
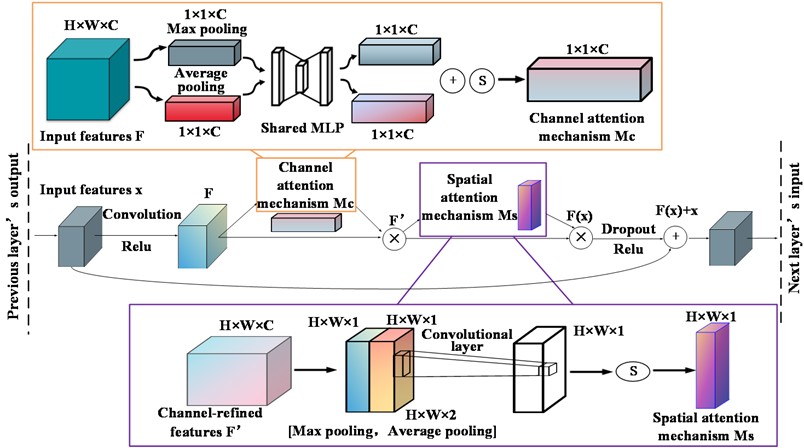
2.2. Sparse residual connections incorporated into the CBAM mechanism
The combination of the CBAM (Convolutional Block Attention Module) [28] and sparse residual connections can enhance the network's ability to focus on key features while reducing computational load and parameter count through sparsity. The CBAM module adjusts feature maps via attention weights, enabling residual blocks to better process important feature information. Sparse residual connections optimize network structure and parameter efficiency while ensuring the trainability of network depth. During training, the introduction of sparsity prompts the network to automatically select important connections, while CBAM guides the network to utilize feature information more effectively on these connections, thereby improving network performance and generalization ability. The network structure is shown in Fig. 1.
Fig. 1Sparse residual links integrated into CBAM mechanism
2.3. FPN multi-scale fusion
The Feature Pyramid Network (FPN) is characterized by its ability to organically integrate features from different scales, thus laying a solid feature foundation for subsequent tasks. The multi-scale features extracted by the Inception module provide richer feature inputs for the FPN. This enables the FPN to fuse more diverse feature information when constructing the feature pyramid, further enhancing the representation ability for targets of different scales. The combination of the Inception’s multi-scale feature extraction and the FPN's feature fusion and pyramid construction allows the model to better handle targets of different sizes. It not only improves computational efficiency but also enhances performance.
3. Experimental setup
3.1. Experimental platform and experimental parameters
The experimental setup used in this study includes a machining center, an ultrasonic vibration assistance system, and a cutting force measurement system, as shown in Fig. 2.
Parameters of TH5650 Vertical Machining Center: Spindle speed range: 50-6000 r/min; Maximum torque: 70/909 (continuous/30 min) N·m; Power: 11/7.5 kW; Travel of , , axes: 850 mm, 500 mm, 630 mm respectively; Maximum feed rate: 24 m/min for and axes; 15 m/min for Z axis.
The TiAlN-coated solid carbide tool MS2SS was chosen for this experiment. At high cutting temperatures, the aluminum element in the coating forms oxides, which improve the tool’s thermal hardness and wear resistance. The main mechanical properties are listed in Table 1.
The MS2SS tool steel used in TiAlN-coated solid carbide cutting tools exhibits brittle behaviour, lacking macroscopic plastic deformation. The stress-strain curve abruptly terminates upon reaching fracture strength, precluding analysis of yield points or necking processes characteristic of ductile materials.
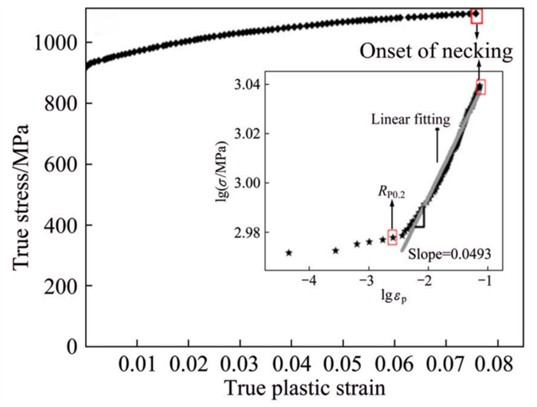
The Fig. 3 depicts the true stress-true plastic strain curve for Ti-6Al-4V material, incorporating dual-logarithmic linear fits for and to systematically analyse the material’s mechanical behaviour and strain hardening patterns during plastic deformation. The main plot demonstrates that true stress increases continuously with rising true plastic strain, indicating the material exhibits pronounced work hardening (strain hardening) characteristics during plastic deformation. That is, as the amount of plastic deformation increases, the material’s resistance to further plastic deformation progressively strengthens. To quantitatively characterise the strain hardening behaviour, a double-logarithmic transformation was applied to the stress-strain relationship during the plastic deformation stage based on the Holman equation, followed by linear fitting. The results reveal a good linear relationship between and , with a fitted slope of 0.0493. This slope represents the material's strain hardening index, whose physical significance lies in the material’s resistance to plastic deformation. A highervalue indicates stronger work hardening capability.
Fig. 2Experimental platform and data acquisition system. The photograph was taken by Guanzhong Wu at the Engineering Training Center of Liaoning Petrochemical University on March 4, 2025
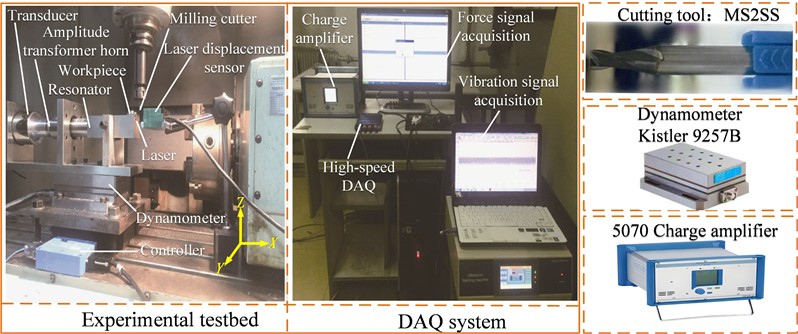
Fig. 3Bipolar logarithmic fitting analysis of true stress-true plastic strain curves and strain hardening characteristics for Ti-6Al-4V
Based on the processing parameters shown in Table 2, the force in the , , and directions was collected using the Dynoware software.
Table 1The main mechanical properties of Ti-6A1-4V alloy
Density / (kg/m3) | Elastic modulus / GPa | Poisson’s ratio | Tensile strength / MPa | Yield strength / MPa | Thermal conductivity / W/(m·K) | Hardness / HB |
4420 | 110 | 0.31 | 960~1270 | 820 | 7.955 | 195 |
Table 2Test conditions and processing parameters
Tool and workpiece material | Machining parameters | ||
The type of tool | Double-edged end mills | Cutting speed / (m/min) | 5-23 |
Tool coating | TiAlN coating | Feed rate / (μm/z) | 8 |
Tool diameter / mm | 4 | Depth of cut / mm | 0.3 |
Tool brand | Mitsubishi | Type of vibration | Feed direction |
Helix angle / (°) | 30 | Frequency / kHz | 20.0 |
Workpiece material | Ti-6Al-4V | Amplitude / μm | 0, 8, 10, 12, 14 |
3.2. Design parameters of the band-stop filter and the signal processing steps
A Band-Stop Filter (BSF) is a frequency-selective device primarily used to suppress or attenuate signals within a specific frequency range while allowing signals outside this range to pass through. To accurately capture signals containing ultrasonic frequencies at 20 kHz, the sampling frequency is chosen as 50 kHz. Since the goal is to filter out the ultrasonic frequency, the center frequency should be set to the digital frequency corresponding to the ultrasonic frequency. The digital center frequency is set to 2.513 kHz. Given that the ultrasonic frequency is 20 kHz, the bandwidth is selected as [18 kHz-22 kHz], corresponding to a digital frequency range of [2.2608-2.7632]. This ensures the removal of both the ultrasonic frequency and the surrounding noise interference. The filter order is chosen as 4. The relevant formulas are as follows:
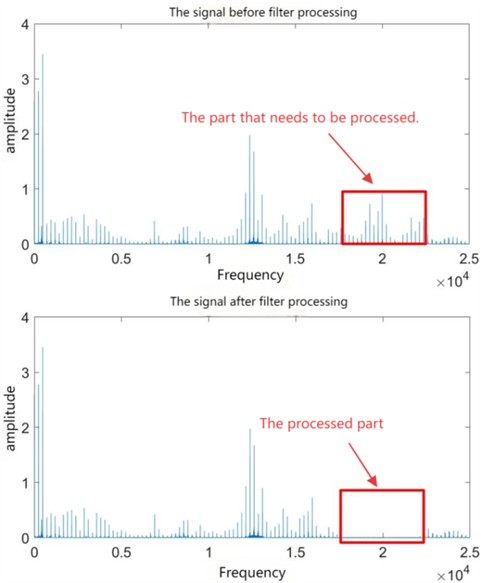
As shown in Fig. 4 Frequency-domain analysis is performed on the filtered data to verify whether the ultrasonic frequency is effectively removed. The filtered data is converted to the frequency domain using FFT again, and whether the amplitude at the ultrasonic frequency position in the spectrum is significantly reduced is observed. Meanwhile, if the ultrasonic frequency component is effectively suppressed, it indicates that the preprocessing of the band-stop filter is successful; otherwise, the filter parameters (such as center frequency, bandwidth, order, etc.) need to be readjusted, and the above steps are repeated until a satisfactory filtering effect is obtained.
3.3. Dataset construction
The data pre-processed by the filter cannot be directly used as the dataset for the neural network. During the data processing, not only should the influence of the ultrasonic frequency be eliminated through the filter, but also FFT analysis should be performed on the data. And the corresponding machining processes, such as idle cutting, chatter, and stable cutting, should be labeled according to different frequencies. Labels are added to the data corresponding to different machining processes, so as to provide training targets for the neural network.
In addition, since there are differences in the amplitude ranges of the data generated by different machining methods, to avoid the influence of these differences on the neural network training, the data needs to be normalized. Through normalization, the distribution range of the data can be adjusted to an appropriate interval.
Fig. 4Band-stop filter processing effect diagram
4. Chatter monitoring process of ICS-CNN model based on sparrow optimization algorithm
4.1. Monitor processes
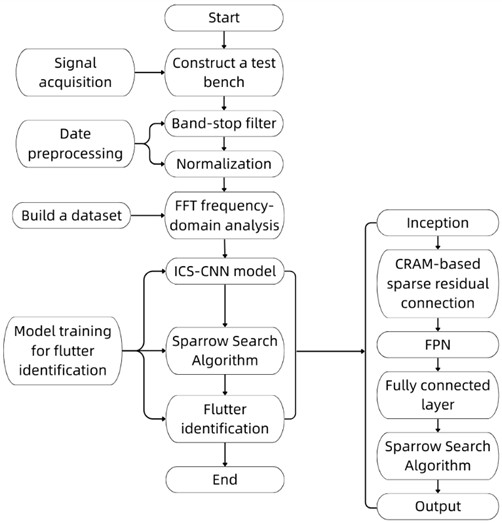
The overall chatter recognition process is shown in Fig. 5, with the specific steps as follows:
1) Acquire force signal data during the milling process.
2) Process the collected force signals using a band-stop filter to eliminate ultrasonic frequencies.
3) Perform frequency-domain analysis on the preprocessed data, convert the one-dimensional force signal data into two-dimensional frequency-domain images through FFT transformation and normalization, and label the data with category labels. Divide the converted frequency-domain image data into training, testing, and validation sets as input data for subsequent convolution operations.
4) Input the two-dimensional frequency-domain images into the ICS-CNN model to automatically extract chatter-related features through Inception multi-scale feature extraction, sparse residual connections integrated with CBAM, and FPN.
5) Use the Sparrow Optimization Algorithm (SSA) to find the optimal solution for the ICS-CNN model’s objective function and obtain the training result output.
6) For the trained model, import data into the trained ICS-CNN monitoring model to directly classify the machining states.
Fig. 5ICS-CNN chatter monitoring process based on sparrow optimization algorithm
4.2. Optimization of hyperparameters by the Sparrow optimization algorithm
After constructing the neural network structure for chatter identification, the Sparrow Optimization Algorithm (SSA) is used to optimize hyperparameters. The fixed hyperparameters in this paper are: AdamW optimizer, Label Smoothing loss function, ReLU activation function, and a Dropout regularization coefficient of 0.5.
AdamW adds weight decay to Adam, which can balance the efficiency of gradient update and the regularization effect: it not only accelerates the parameter update of the ICS-CNN convolution layer through adaptive learning rate, and quickly reduces the loss, but also can suppress overfitting, reduce the model’s dependence on specific working condition noise features, and improve generalization ability. Loss function: Label Smoothing addresses the “over-confident” issue of one-hot labels by setting the positive sample labels to (0.1) and the negative sample labels toε.The formula for the loss function is as follows:
This retains the model's ability to learn uncertainty, avoids overfitting to noisy samples, enhances the sensitivity of recognizing early fluttering weak features, and reduces classification errors. The ReLU activation function can prevent the gradient disappearance in deep networks and ensure the effective transmission of frequency-domain features of ICS-CNN; moreover, it is computationally simple, has no gradient saturation in the positive range, and can quickly distinguish the sensitive and non-sensitive frequency band features of the vibration-sensitive signals in the spectrogram. Regularization coefficient: Dropout = 0.5. During training, 50 % of the neurons in the fully connected layers are randomly deactivated, which can prevent overfitting (avoiding redundant features such as noise in the learning device); through pre-experiment verification, this coefficient can balance feature retention and robustness, making the model's accuracy on the validation set fluctuate the least and having the best anti-noise ability.
The optimization ranges are: learning rate [0.0001, 0.01], batch size [16, 64], and weight magnitude [0.001, 0.1]. The optimization results are: learning rate of 0.0026, batch size of 32, and weight magnitude of 0.057.
5. Test of chatter recognition effect of ICS-CNN model based on sparrow optimization algorithm
5.1. Test results
During the research, the Sparrow Optimization Algorithm (SSA) was applied to successfully locate the optimal solution, and the relevant parameters were fed back to the ICS-CNN model. The number of iterations was reasonably increased to 200. Finally, the loss function curve and accuracy curve were successfully obtained, and their detailed information is shown in Fig. 6.
Fig. 6Loss function curve and accuracy curve for 200 iterations
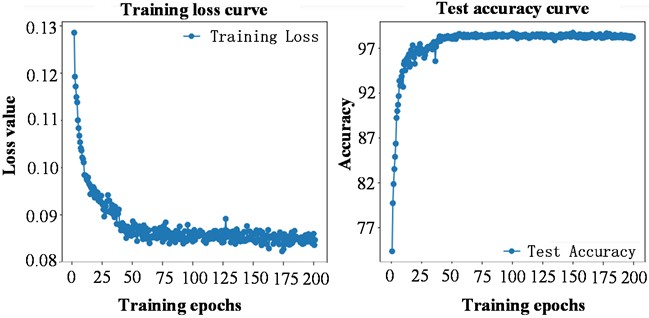
It can be seen that the loss function continuously converges until it approaches a steady state. Notably, although the loss function converges continuously, it does not ultimately converge to zero, which precisely indicates that the model exhibits good performance on the training set and effectively avoids the risk of overfitting. From the accuracy curve, it is clearly observed that the accuracy climbs extremely rapidly in the initial stage, then gradually stabilizes, and finally reaches a high accuracy of 98.37 %. This result strongly confirms that the model also performs excellently on the test set, achieving high accuracy while successfully eliminating overfitting. Comprehensive analysis above fully demonstrates the outstanding effect of the ICS-CNN model based on the Sparrow Optimization Algorithm in chatter identification for ultrasonic milling.
5.2. Visual analysis of the model
To clearly and intuitively understand the performance of the model on the training set and the test set, it is necessary to conduct a visual analysis of the model. Visualization methods can not only help further verify the effectiveness of the model but also evaluate the model’s performance in an intuitive way. In this paper, two visualization approaches, namely the T-SNE visualization scatter plot and the decision boundary plot, are used to conduct a more in – depth verification and evaluation of the model, providing multiple perspectives for the analysis of the model’s performance, as shown in Fig. 7 and Fig. 8.
First, the visualization results of the model on the training set (left plot) were observed through T-SNE scatter plots. The results clearly show that the data form three distinct clusters, with clear boundaries between clusters and no confusion between samples of different clusters. This phenomenon fully demonstrates the model's excellent classification ability on the training set.
Fig. 7T-SNE visual scatter plot
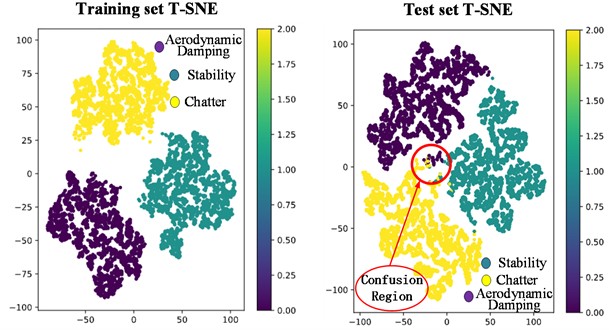
Meanwhile, observing the model's performance on the test set (right plot), the three clusters are nearly completely separated, with only a few samples confused, concentrated in the areas marked by red circles in the figure. This result further highlights the model's excellent performance during the testing phase and strongly proves its good applicability and reliability in practical application scenarios.
Using only one verification method to measure the model's performance is insufficient. To rigorously demonstrate the model’s performance, this paper uses decision boundary plots to visualize the training and testing effects, providing supplementary evidence for the model's performance, as shown in Fig. 8.
Fig. 8Decision boundary diagram
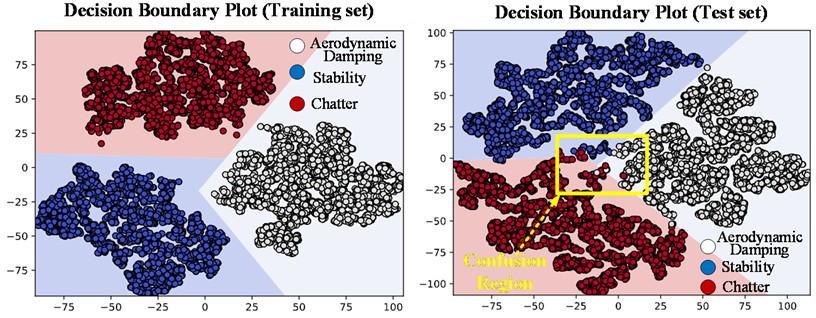
By observing the model's performance on the training set (left plot) in the decision boundary diagram, it can be clearly seen that the three clusters are accurately and perfectly classified without any confusion. This result is highly consistent with the conclusion drawn from the T-SNE analysis of the training set, further verifying the model's excellent classification ability during the training phase. Meanwhile, observing the model's performance on the test set (right plot), it is evident that the three clusters are almost completely separated, with only a minimal number of samples confused. These confused samples are concentrated in the areas marked by yellow boxes in the figure, fully demonstrating the model's superior performance during the testing phase.
Through the synchronous analysis of T-SNE and decision boundary diagrams, the results of the two visualization methods corroborate each other, providing strong evidence for the model's good applicability and reliability in practical application scenarios. This significantly enhances the credibility and persuasiveness of the model evaluation conclusions.
5.3. Comparative experiments on chatter identification effects of different models
To verify the effectiveness of the proposed method, this study conducted a detailed comparative analysis. Focusing on the identification performance of network models, the Sparrow Optimization Algorithm (SSA) was combined with four common network models to construct the SSA-CNN (Convolutional Neural Network with SSA), SSA-ResNet (Residual Neural Network with SSA), SSA-SVM (Support Vector Machine with SSA), and SSA-Inception-V1 (Inception-V1 with SSA). These combined models were then comprehensively compared with the proposed model (SSA-ICS-CNN). Through visual analysis of different models, the performance of each model was accurately evaluated to validate the effectiveness of the proposed method, as detailed in Fig. 9.
Fig. 9Visual comparison of different models

Table 3Comparison of recognition performance among different methods
Model name | SSA-ICS-CNN | SSA-CNN | SSA-ResNet | SSA-SVM | SSA-Inception-V1 |
Accuracy | 98.37 % | 85.44 % | 88.37 % | 90.37 % | 92.62 % |
By carefully observing Fig. 9, it is evident that the proposed SSA-ICS-CNN model outperforms other models on the test set. In its test results, the proportion of confused samples is extremely small, whereas other models exhibit significantly higher confusion rates on the test set. Further comparison of accuracy data for different methods in Table 3 shows that the SSA-ICS-CNN model achieves the highest accuracy among all compared models, which strongly reinforces its significant performance advantages and ideal effectiveness.
In addition to model comparisons, different optimization algorithms are also contrasted, including the Random Search-optimized model (RS-ICS-CNN), Simulated Annealing-optimized model (SA-ICS-CNN), Tree-structured Parzen Estimator-optimized model (TPE-ICS-CNN), Covariance Matrix Adaptation Evolution Strategy-optimized model (CMA-ES-ICS-CNN), Genetic Algorithm-optimized model (GA-ICS-CNN), and Particle Swarm Optimization-optimized model (PSO-ICS-CNN). The experimental settings are listed in Table 4.
Table 4Comparison test settings
Method | Description |
Random search | Conduct 200 random assessments |
Simulated annealing method | Random search generates initial points, with a total of 200 evaluations conducted |
TPE algorithm | Accept the prior distribution of each parameter and conduct 200 evaluations |
CMA-ES algorithm | Conducted 20 generations, with 10 individuals per generation, for a total of 200 assessments |
GA algorithm | Conducted 20 generations, with 10 individuals per generation, for a total of 200 assessments |
PSO algorithm | Initialize speed and position for 200 evaluations |
Full text arithmetic SSA-ICS-CNN | Initialization of 10 populations per generation for a total of 200 assessments |
Fig. 10The ROC curve is used to represent the performance of various models

For generating ROC curves of various models to quantify and compare the classification performance of the SSA-ICS-CNN model with the other six models (RS-ICS-CNN, SA-ICS-CNN, TPE-ICS-CNN, CMA-ES-ICS-CNN, GA-ICS-CNN, PSO-ICS-CNN), first, regarding the task and sample set determination, aiming at the three-category task of distinguishing idle cutting, stable cutting, and chatter states, the “One-vs-Rest” strategy is adopted to convert it into a binary classification task, and the preprocessed test set (divided in a 7:1:2 ratio for training, validation, and testing) is selected as the evaluation sample source. Next, for obtaining predictive probabilities, the probability vectors from the fully connected layer of each of the seven models are extracted, and in each “One-vs-Rest” scenario, the probability of the target category is taken as the “positive class score” while the maximum probability of the other two categories is taken as the “negative class score”. Then, for calculating TPR and FPR, 101 thresholds ranging from 0 to 1 with an interval of 0.01 are set; samples are classified according to these thresholds, the numbers of TP (True Positives), FP (False Positives), TN (True Negatives), and FN (False Negatives) are counted under each threshold, and TPR, and FPR are further computed. Finally, for plotting curves and calculating AUC, each model generates 3 sub-ROC curves, the AUC of each sub-ROC curve is calculated using the trapezoidal integration method and the average of these three AUC values is taken as the final AUC of the model; the average ROC curves of the seven models are plotted in the same coordinate system. Fig. 10 shows the ROC curves of seven algorithms (the closer the ROC curve is to the upper-left corner, the higher the classification accuracy of the model; AUC is the area under the ROC curve, and a larger AUC indicates better classification performance of the model). It can be seen from the figure that the proposed identification model has the highest classification accuracy, with an AUC of 0.983, which is larger than that of the other six identification models. This indicates that the model not only has the best classification performance but also faster convergence ability and higher convergence accuracy:
Fig. 11The identification accuracy and discrimination time of different models

Table 5Performance comparison of 7 algorithm models
Method | Accuracy | MCC | F1Score | Judge time (ms) |
RS-ICS-CNN | 0.8365 | 0.7663 | 0.9007 | 487 |
SA-ICS-CNN | 0.8044 | 0.8562 | 0.8996 | 403 |
TPE-ICS-CNN | 0.7656 | 0.8606 | 0.9123 | 302 |
CMA-ES-ICS-CNN | 0.7273 | 0.8769 | 0.9063 | 280 |
GA-ICS-CNN | 0.9038 | 0.9037 | 0.9027 | 263 |
PSO-ICS-CNN | 0.8581 | 0.8927 | 0.9163 | 313 |
SSA-ICS-CNN | 0.9837 | 0.9327 | 0.9717 | 147 |
The results of this study demonstrate that the proposed SSA-ICS-CNN model exhibits outstanding overall performance in identifying chatter during ultrasonic milling of thin-walled components. As depicted in Fig. 11 and Table 5, this model achieves optimal values in recognition accuracy (98.37 %), Matthews correlation coefficient (0.9327), and F1 score (0.9717), whilst requiring only 147 milliseconds for classification. This represents a significant improvement over other comparative models. This outstanding performance stems from the SSA algorithm's exceptional global search capability during hyperparameter optimisation, effectively circumventing local optima. Concurrently, the multi-scale feature fusion mechanism (Inception module) introduced within the ICS-CNN architecture, attention-guided (CBAM) and feature pyramid network (FPN) mechanisms within the ICS-CNN architecture enhance frequency-domain feature extraction. The sparse residual structure substantially reduces computational complexity while preserving expressive power, thereby unifying high accuracy with high real-time performance. Compared with recent related studies, this approach demonstrates distinct technical advantages, further reducing response time while maintaining comparable accuracy. These comparisons indicate that SSA-ICS-CNN not only outperforms existing mainstream intelligent chatter monitoring methods in performance metrics but also provides a genuinely practical solution meeting industrial online monitoring requirements.
From an industrial application perspective, the developed recognition system possesses the potential for integration into CNC machine tool control units, enabling real-time chatter monitoring and predictive maintenance. Capable of completing state discrimination within 147 milliseconds, the system provides critical technical support for timely adjustment of cutting parameters, thereby preventing workpiece damage and tool wear. Its favourable computational efficiency renders it suitable for edge computing environments, aligning with the evolving trend of end-edge-cloud collaborative architectures within contemporary intelligent manufacturing systems.
Nevertheless, this research retains certain limitations. The current model was trained and validated under specific machining conditions and using a limited-scale dataset; its generalisability across broader operating conditions requires further validation. Furthermore, while the model demonstrates favourable computational efficiency, its deployability on resource-constrained embedded devices requires further optimisation through model compression techniques. Future research will focus on constructing multi-condition datasets, designing adaptive lightweight networks, and achieving closed-loop integration with actual CNC systems to advance the method's widespread adoption in industrial settings.
6. Conclusions
Aiming at the characteristics of thin-walled parts with weak rigidity and the problem of easy occurrence of chatter instability in actual machining, this paper conducts research on online chatter monitoring technology for ultrasonic vibration milling of thin-walled parts, and constructs a real-time monitoring system based on the SSA-ICS-CNN model to achieve real-time online monitoring of instability in the cutting process. This approach of combining the sparrow optimization algorithm with the ICS-CNN model enables the model to comprehensively capture the vibration characteristics from multiple perspectives and levels, significantly enhancing the model's robustness, effectively improving the accuracy and efficiency of online monitoring, and providing a new technical means for online vibration monitoring. The following is a summary of the main contents and conclusions of this paper, as well as an analysis of the limitations of this research and an outlook for the future:
1) First, the corresponding force experimental data during ultrasonic vibration-assisted milling were collected, and then preprocessing was carried out on the collected data: considering that the ultrasonic frequency in ultrasonic-assisted machining would interfere with subsequent analysis, a band-stop filter was used to filter out this frequency component; Fast Fourier Transform (FFT) analysis was performed on the preprocessed signals to extract frequency-domain features; finally, normalization was conducted to eliminate the impact of signal amplitude differences under different working conditions, ensuring the consistency of subsequent model inputs.
2) To improve the recognition performance of chatter states, the constructed ICS-CNN model was combined with the Sparrow Search Algorithm (SSA) to build the SSA-ICS-CNN network model. The SSA was used to optimize the key parameters of the model, and the optimal parameter combination was finally obtained: learning rate of 0.0026, batch size of 32, and weight magnitude of 0.057. The model performance was evaluated through multi-dimensional verification: visualization analysis was used to intuitively present the model's recognition effect, the loss function curve was used to observe the model's convergence (ensuring no obvious overfitting), and the accuracy curve was used to verify the model's recognition ability. The results showed that the proposed SSA-ICS-CNN model had good recognition performance for chatter states.
3) Comprehensive comparison experiments were conducted between the SSA-ICS-CNN model and different types of models and algorithms: the results showed that the chatter state recognition accuracy of the proposed model reached 98.37 %, and the single-sample judgment time was only 147 ms. Compared with other comparative models, the SSA-ICS-CNN model showed significant advantages in both performance (such as judgment efficiency) and accuracy, and could realize efficient and precise discrimination of chatter states; at the same time, the model had a faster convergence speed, which could effectively ensure the demand for high-precision chatter recognition tasks under complex working conditions.
Currently, the ICS-CNN model mainly relies on two-dimensional spectrogram datasets for vibration monitoring. With the increasing availability of multi-modal data, such as the characteristic data of ultrasonic signals, the sound signals during the milling process, the temperature data at the contact area between the tool and the workpiece, and the vibration acceleration data during the processing, etc. In the future, efforts should be made to expand the ICS-CNN model to enable it to effectively integrate these multi-modal data, thereby more comprehensively and accurately capturing the vibration characteristics of ultrasonic milling.
\
References
-
C. Wu, S. Chen, K. Cheng, and C. Xiao, “Investigation of strengthening effect on the machining rigidity in longitudinal torsional ultrasonic milling of thin-plate structures,” Proceedings of the Institution of Mechanical Engineers, Part B: Journal of Engineering Manufacture, Vol. 234, No. 3, pp. 665–670, Sep. 2019, https://doi.org/10.1177/0954405419875346
-
K. Zheng, W. Liao, Q. Dong, and L. Sun, “Friction and wear on titanium alloy surface machined by ultrasonic vibration-assisted milling,” Journal of the Brazilian Society of Mechanical Sciences and Engineering, Vol. 40, No. 9, Aug. 2018, https://doi.org/10.1007/s40430-018-1336-9
-
L. Jianhui, Z. Lu, T. U. Yuanyang, and W. Xin, “Experimental Study on Micromorphology of Ultrasonic Milling Aluminum Alloy Surface,” Mechanical Engineer, p. 2018, 2018.
-
J. Tlusty and G. C. Andrews, “A Critical Review of Sensors for Unmanned Machining,” CIRP Annals, Vol. 32, No. 2, pp. 563–572, Jan. 1983, https://doi.org/10.1016/s0007-8506(07)60184-x
-
C. Liu, X. Gao, D. Chi, Y. He, M. Liang, and H. Wang, “On-line chatter detection in milling using fast kurtogram and frequency band power,” European Journal of Mechanics – A/Solids, Vol. 90, p. 104341, Nov. 2021, https://doi.org/10.1016/j.euromechsol.2021.104341
-
Y. Fu et al., “Timely online chatter detection in end milling process,” Mechanical Systems and Signal Processing, Vol. 75, pp. 668–688, Jun. 2016, https://doi.org/10.1016/j.ymssp.2016.01.003
-
Y. Wang, M. Zhang, X. Tang, F. Peng, and R. Yan, “A kMap optimized VMD-SVM model for milling chatter detection with an industrial robot,” Journal of Intelligent Manufacturing, Vol. 33, No. 5, pp. 1483–1502, Jan. 2021, https://doi.org/10.1007/s10845-021-01736-9
-
J. Gao, Q. Song, and Z. Liu, “Chatter detection and stability region acquisition in thin-walled workpiece milling based on CMWT,” The International Journal of Advanced Manufacturing Technology, Vol. 98, No. 1-4, pp. 699–713, Jun. 2018, https://doi.org/10.1007/s00170-018-2306-1
-
M.-Q. Tran, M.-K. Liu, and M. Elsisi, “Effective multi-sensor data fusion for chatter detection in milling process,” ISA Transactions, Vol. 125, pp. 514–527, Jun. 2022, https://doi.org/10.1016/j.isatra.2021.07.005
-
J. Ye, P. Feng, C. Xu, Y. Ma, and S. Huang, “A novel approach for chatter online monitoring using coefficient of variation in machining process,” The International Journal of Advanced Manufacturing Technology, Vol. 96, No. 1-4, pp. 287–297, Jan. 2018, https://doi.org/10.1007/s00170-017-1544-y
-
G. R. Frumusanu, I. C. Constantin, V. Marinescu, and A. Epureanu, “Development of a stability intelligent control system for turning,” The International Journal of Advanced Manufacturing Technology, Vol. 64, No. 5-8, pp. 643–657, Apr. 2012, https://doi.org/10.1007/s00170-012-4074-7
-
Z. Yao, D. Mei, and Z. Chen, “On-line chatter detection and identification based on wavelet and support vector machine,” Journal of Materials Processing Technology, Vol. 210, No. 5, pp. 713–719, Mar. 2010, https://doi.org/10.1016/j.jmatprotec.2009.11.007
-
Z. Zhang, “Analysis of Milling Vibration State Based on the Energy Entropy of WPD,” Journal of Mechanical Engineering, Vol. 54, No. 21, p. 57, Jan. 2018, https://doi.org/10.3901/jme.2018.21.057
-
Y. Sun and Z. Xiong, “An optimal weighted wavelet packet entropy method with application to real-time chatter detection,” IEEE/ASME Transactions on Mechatronics, Vol. 21, No. 4, pp. 2004–2014, Aug. 2016, https://doi.org/10.1109/tmech.2016.2547481
-
H. Cao, K. Zhou, and X. Chen, “Chatter identification in end milling process based on EEMD and nonlinear dimensionless indicators,” International Journal of Machine Tools and Manufacture, Vol. 92, pp. 52–59, May 2015, https://doi.org/10.1016/j.ijmachtools.2015.03.002
-
X. Li, S. Wan, X. Huang, and J. Hong, “Milling chatter detection based on VMD and difference of power spectral entropy,” The International Journal of Advanced Manufacturing Technology, Vol. 111, No. 7-8, pp. 2051–2063, Oct. 2020, https://doi.org/10.1007/s00170-020-06265-y
-
C. Liu, L. Zhu, and C. Ni, “Chatter detection in milling process based on VMD and energy entropy,” Mechanical Systems and Signal Processing, Vol. 105, pp. 169–182, May 2018, https://doi.org/10.1016/j.ymssp.2017.11.046
-
K. Yang, G. Wang, Y. Dong, Q. Zhang, and L. Sang, “Early chatter identification based on an optimized variational mode decomposition,” Mechanical Systems and Signal Processing, Vol. 115, pp. 238–254, Jan. 2019, https://doi.org/10.1016/j.ymssp.2018.05.052
-
J. Wang, J. Li, H. Wang, and L. Guo, “Composite fault diagnosis of gearbox based on empirical mode decomposition and improved variational mode decomposition,” Journal of Low Frequency Noise, Vibration and Active Control, Vol. 40, No. 1, pp. 332–346, Feb. 2020, https://doi.org/10.1177/1461348420908364
-
Z. Chen et al., “Research on bearing fault diagnosis based on improved genetic algorithm and BP neural network,” Springer Science and Business Media LLC, Scientific Reports, Jul. 2024, https://doi.org/10.1038/s41598-024-66318-0
-
Y. Cheng, Z. Wang, W. Zhang, and G. Huang, “Particle swarm optimization algorithm to solve the deconvolution problem for rolling element bearing fault diagnosis,” ISA Transactions, Vol. 90, pp. 244–267, Jul. 2019, https://doi.org/10.1016/j.isatra.2019.01.012
-
Y. Fu et al., “Machining vibration states monitoring based on image representation using convolutional neural networks,” Engineering Applications of Artificial Intelligence, Vol. 65, pp. 240–251, Oct. 2017, https://doi.org/10.1016/j.engappai.2017.07.024
-
B. Liu, C. Liu, Y. Zhou, D. Wang, and Y. Dun, “An unsupervised chatter detection method based on AE and merging GMM and K-means,” Mechanical Systems and Signal Processing, Vol. 186, p. 109861, Mar. 2023, https://doi.org/10.1016/j.ymssp.2022.109861
-
X. Jing, H. Yang, X. Song, Y. Chen, and H. Li, “A novel chatter detection method in micro-milling process using wavelet packet entropy,” The International Journal of Advanced Manufacturing Technology, Vol. 131, No. 9-10, pp. 5289–5303, Mar. 2024, https://doi.org/10.1007/s00170-024-13325-0
-
W. Mou, S. Zhu, Z. Jiang, and G. Song, “Vibration signal-based chatter identification for milling of thin-walled structure,” Chinese Journal of Aeronautics, Vol. 35, No. 1, pp. 204–214, Jan. 2022, https://doi.org/10.1016/j.cja.2020.09.029
-
P. Stavropoulos, T. Souflas, D. Manitaras, C. Papaioannou, and H. Bikas, “Optimization of milling processes: chatter detection via a sensor-integrated vice,” Machines, Vol. 11, No. 1, p. 52, Jan. 2023, https://doi.org/10.3390/machines11010052
-
R. Wang, Q. Song, Z. Liu, H. Ma, and Z. Liu, “Multi-condition identification in milling Ti-6Al-4V thin-walled parts based on sensor fusion,” Mechanical Systems and Signal Processing, Vol. 164, p. 108264, Feb. 2022, https://doi.org/10.1016/j.ymssp.2021.108264
-
B. Yuan, L. Lei, and S. Chen, “Optimized variational mode decomposition and convolutional block attention module-enhanced hybrid network for bearing fault diagnosis,” Machines, Vol. 13, No. 4, p. 320, Apr. 2025, https://doi.org/10.3390/machines13040320
About this article

The authors have not disclosed any funding.
The datasets generated during and/or analyzed during the current study are available from the corresponding author on reasonable request.
Na Zhao and Chao Zhang conceived the idea. Hui Yang, Wei Du, Futao Liu and Jiaming Li performed all the experiments. Guanzhong Wu drafted the manuscript, and Min Xia, Changfu Liu, Na Zhao and Chao Zhang interpreted, discussed and edited the manuscript. Wei Du finalized the manuscript, including preparing the detailed response letter. Na Zhao supervised the work.
The authors declare that they have no conflict of interest.
