Abstract
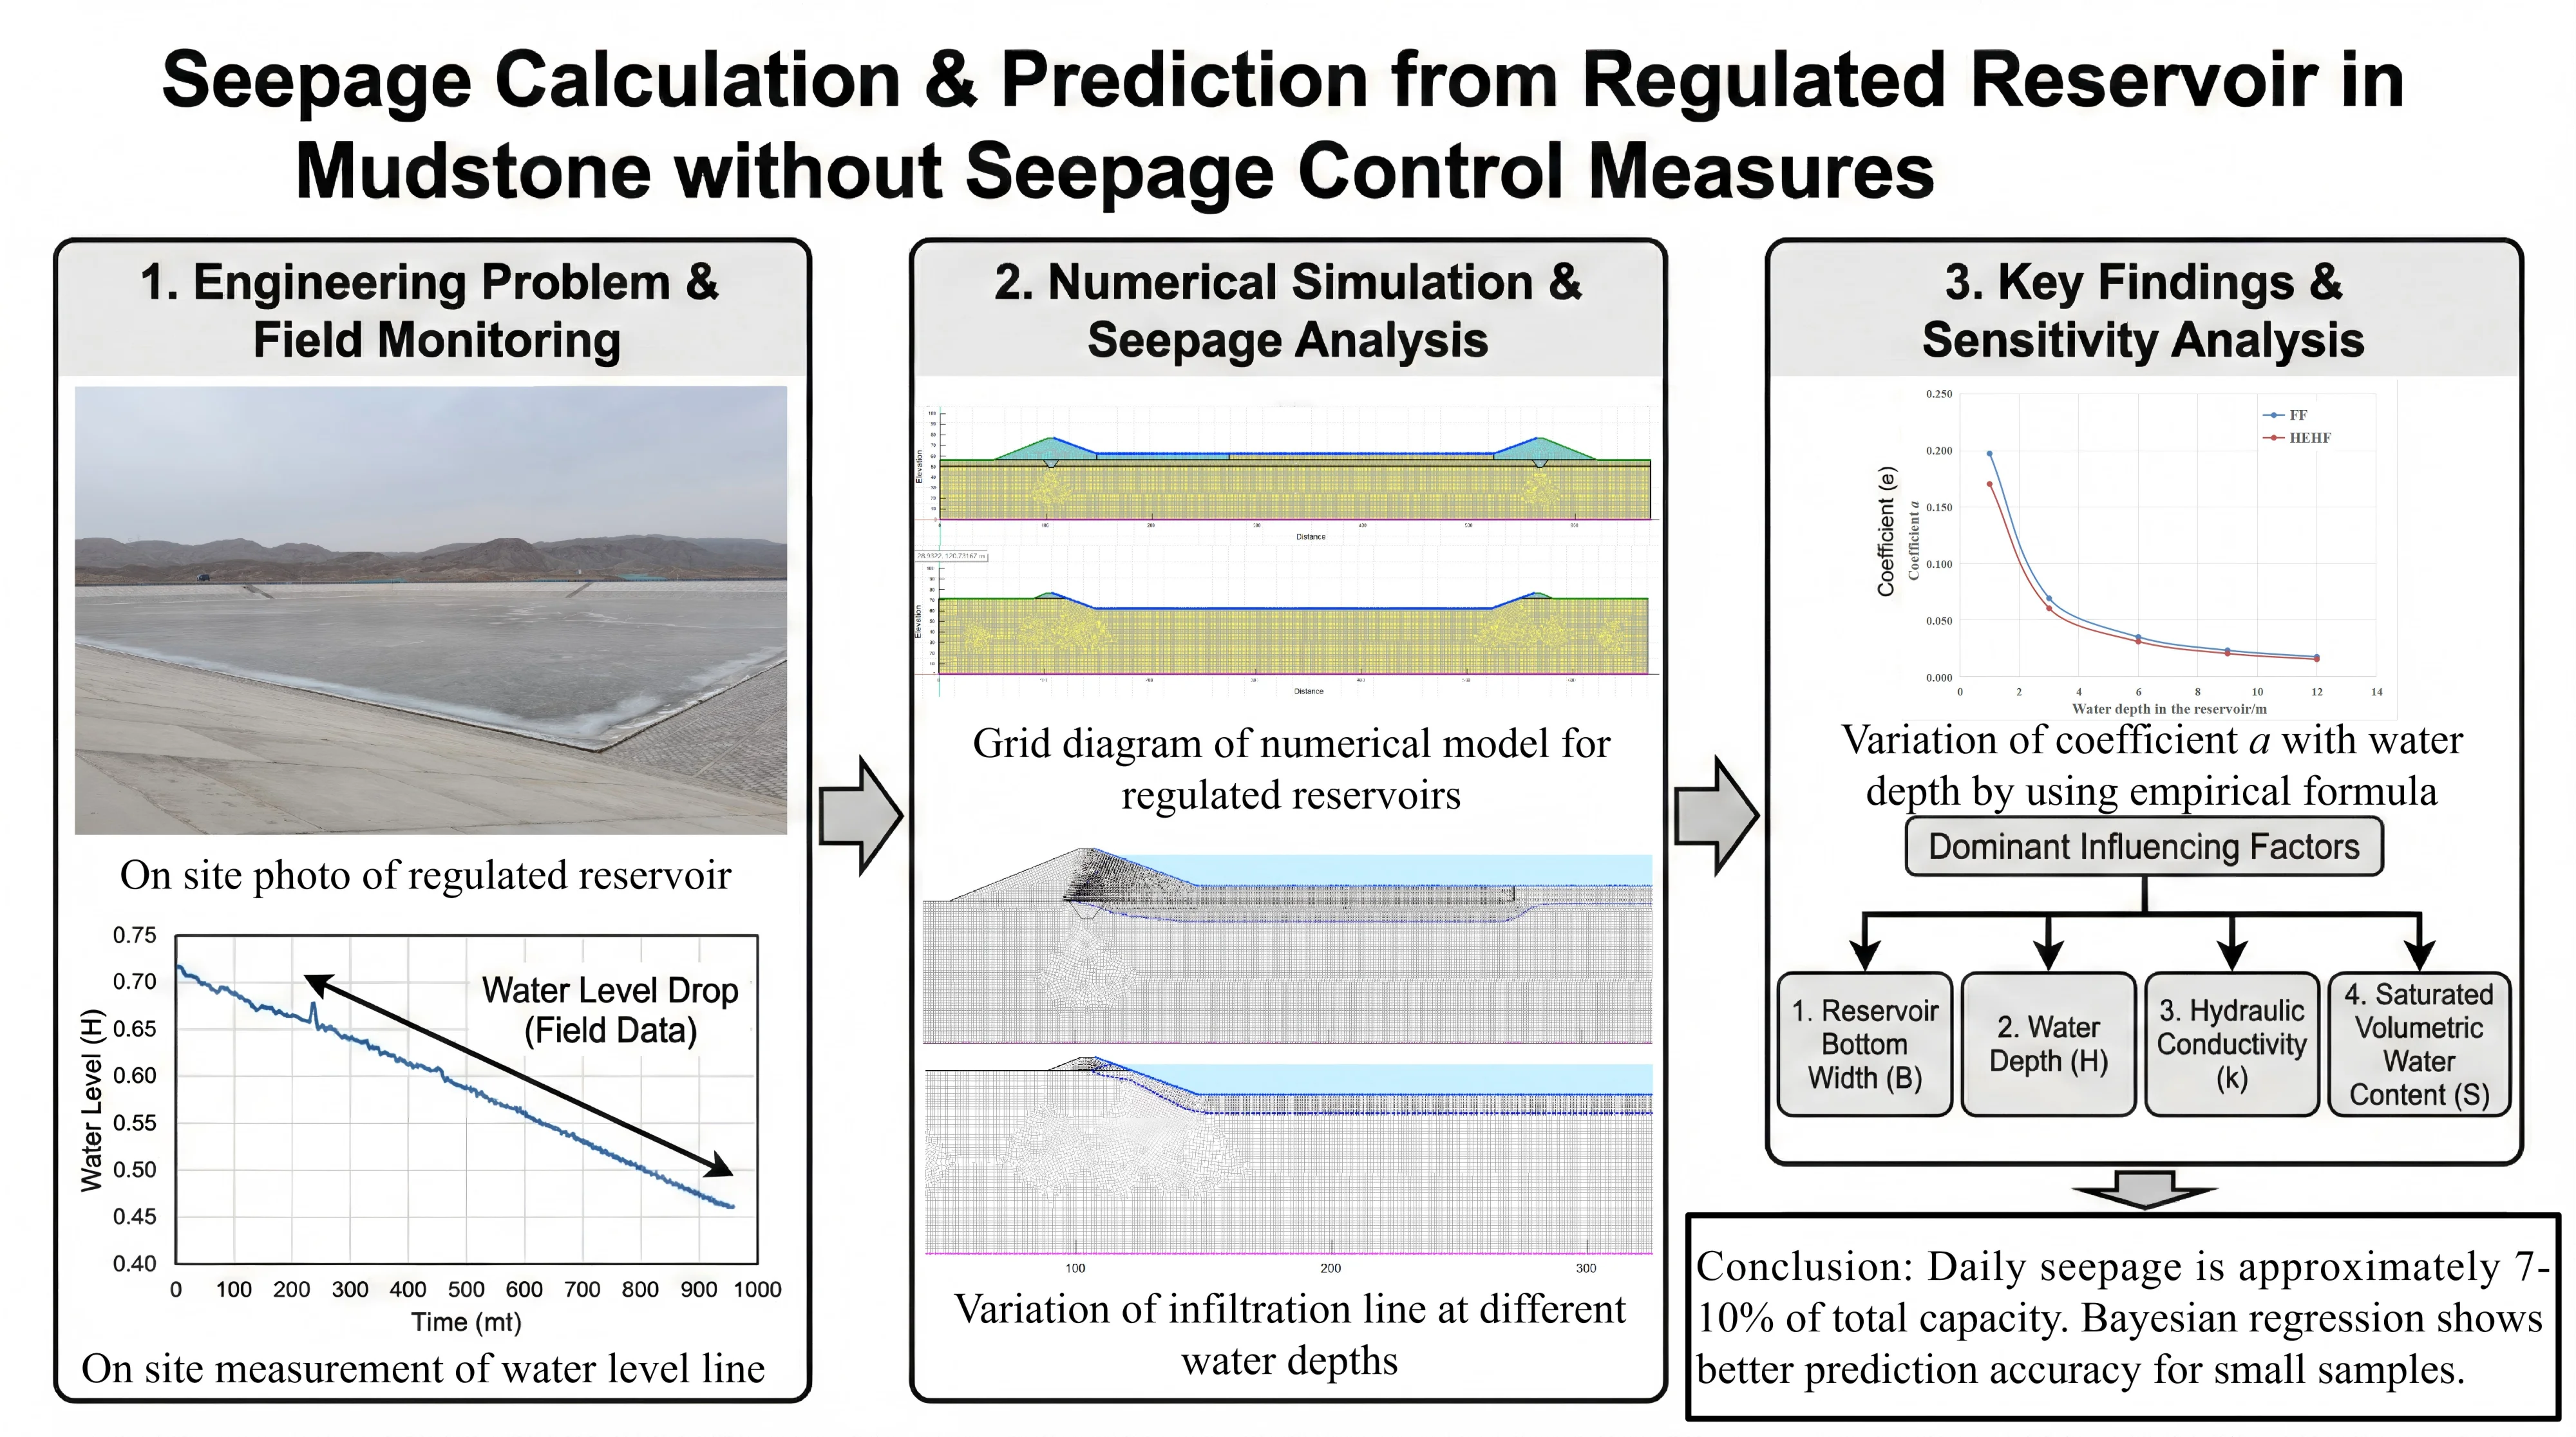
Correctly assessing seepage amount of the regulated reservoir is vital to water resources efficlent utilization and engineering safety. A regulated reservoir in mudstone area without seepage control measures was used as the engineering prototype. Based on the mutual verification of field monitoring and numerical simulation, the estimation formula of the seepage amount of the regulated reservoir was determined. In addition, the sensitivity analysis of the factors affecting the seepage amount of the regulated reservoir was carried out, and the seepage prediction models were established based on the different optimization algorithms. The research results indicate that the regulated reservoir without lying geomembranes exists in a certain amount of seepage every day, accounting for about 7 to 10 % of the total reservoir capacity. The sensitivity ranking of influencing factors in descending order is as follows: reservoir bottom width, water depth, hydraulic conductivity, and saturated volumetric water content. The prediction accuracy of Bayesian regression is significantly better than that of traditional regression models under small training samples. This research approach provides a highly accurate and strongly robust solution to the small sample engineering prediction problem.
Highlights
- Developed a field-validated empirical formula for rapid seepage estimation in mudstone geology.
- Established a novel methodology for robust seepage prediction in data-scarce environments.
- Bayesian regression as a model for providing superior predictive accuracy with limited training data.
- Determined the reservoir geometry (bottom width and water depth) as dominant factors controlling seepage.
1. Introduction
Water scarcity poses a significant challenge in arid and semi-arid regions, demanding efficient water storage and management solutions [1-2]. In Ningxia, China, the Yellow River irrigation district extensively employs regulated reservoirs to optimize water allocation. However, seepage losses from these reservoirs substantially diminish water-use efficiency, particularly in mudstone-dominated areas where geomembranes may be impractical due to economic or geological constraints. Accurate estimation of seepage amounts in such settings is critical for sustainable water resource management, yet existing models often inadequately account for the hydrogeological complexities of fractured mudstone [3].
The Hongquangou regulated reservoir in Ningxia presents a representative case where mudstone serves as the primary foundation without geomembranes anti-seepage measures. Previous studies on reservoir seepage have predominantly examined highly permeable strata (such as alluvial deposits) by applying Darcy’s law and numerical simulations [4]. However, mudstone, despite its low matrix permeability, can exhibit significant fracture-induced seepage under sustained hydraulic pressure [5]. While field measurements coupled with numerical modeling (such as MODFLOW) provide a robust framework for seepage quantification [6], there is still little research on seepage from regulated reservoirs built on mudstone formations. More and more new regulated reservoirs are being built in mudstone areas, and their seepage characteristics, seepage calculations and seepage control treatments need to be solved urgently [7-8]. Some studies have concluded that the amount of seepage loss from regulated reservoirs in loess areas is mainly dominated by the saturated water demand on the bottom of the reservoir and the soil layer around the reservoir in the early stage [9]. However, the permeability characteristics of mudstone areas are significantly different from those of loess areas. Seepage represents an inherent characteristic of reservoir operation, yet its quantification and prediction remain critical for sustainable water management. Uncontrolled seepage not only diminishes water availability but also threatens infrastructure stability, potentially compromising both water security and public safety. Accurate assessment of seepage rates enables optimized design and operation of water storage systems, particularly in water-scarce regions where conservation is paramount [10-11].
Current seepage estimation methodologies encompass analytical solutions (such as Hantush's equations) and computational models [12], yet their applicability to fractured mudstone remains underexplored. Existing researches lack reliable predictive models for estimating seepage amounts in regulated reservoirs constructed on mudstone foundations without anti-seepage geomembranes. This knowledge gap significantly impedes accurate water loss quantification, leading to two critical consequences: (1) substantial water resource wastage in arid regions where conservation is paramount, and (2) compromised water allocation efficiency due to uncertain storage capacity calculations, ultimately undermining the long-term resilience of water infrastructure in arid regions [13]. Therefore, the simple estimation and precise prediction of seepage amount in regulated reservoirs without anti-seepage geomembranes still need to be explored. Similarly, although sensitivity analysis techniques are well-established in leakage estimations [14], their application to characterize seepage mechanisms in fractured, low-permeability mudstone formations is notably absent from current literature [15]. Currently, artificial intelligence has been introduced in various fields of the water conservancy industry and has achieved remarkable results, laying the foundation for future development [16]. This study addresses existing research gaps by creating a field-validated and numerically calibrated prediction model specifically designed for the hydrogeological environment of Ningxia's Yellow River irrigation network [17]. While primarily focused on regional applications, the research also contributes valuable knowledge to sustainable water management strategies. The improved method for estimating water seepage in reservoirs built on mudstone bedrock provides practical data for evaluating the economic feasibility of anti-leakage measures. Moreover, the developed approach can be effectively applied to other dryland areas sharing comparable geological challenges, offering potential solutions for water resource preservation in arid regions.
To address the lack of methods for estimating seepage amounts of regulated reservoir without seepage control measures, this study aims to establish an empirical formula for estimating seepage amounts in mudstone-based regulated reservoirs by integrating field monitoring with numerical simulation validation. In addition, we perform a sensitivity analysis to identify dominant factors influencing seepage and develop a predictive model that ranks these factors by their relative contributions. The outcomes will furnish water managers with a practical tool to optimize reservoir design and operations in analogous geological settings, thereby mitigating unnecessary water losses.
2. On site investigation of seepage amount
2.1. Overview of regulated reservoirs
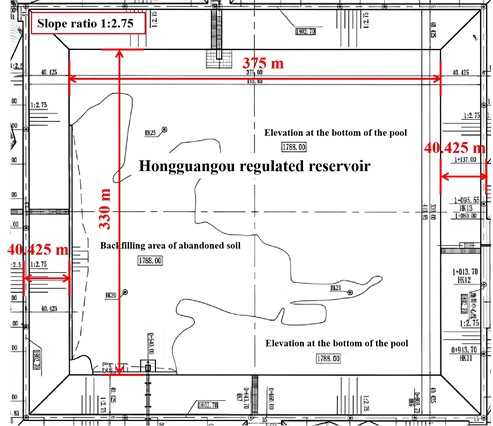
The regulated reservoir is located on the east side of Xiangshan Township, Shapotou District, Zhongwei City, Ningxia. The site belongs to the hilly landform unit, with a ground elevation of 1775-1812 meters. The site is mostly exposed in the Neogene strata. The total designed capacity of the regulated reservoir is 2.05 million m3, with a designed bottom elevation of 1788.00 m, a designed water level of 1801.20 m, a designed dam crest elevation of 1802.70 m, a designed reservoir depth of 14.7 m, and a designed water depth of 13.2 m. The designed dam axis is 1757.40 meters long and the dam crest width is 6.0 meters. The dam is a crushed homogeneous earth dam, and the fill of the dam is a mixture of soil from the designated soil quarry on the downstream side of the Xinshui Reservoir and a mixture of strongly weathered mudstone and loam excavated in the reservoir area, with a fill compaction degree of ≥ 0.97. The maximum fill height of the dam is 25.7 m. The slope ratio of the front dam is 1:2.75 and the slope ratio of the back dam is 1:2.5. The upstream dam slope is protected by precast concrete slabs and cast-in-place concrete slabs, while the downstream dam slope is protected by grass protection. The stratum of the site mainly consists of loam, gravel and mudstone, of which the thickness of the top layer of loam is 0.5~3.5 m, with a wet subsidence. The gravel is distributed in the upper part of the terraces on both sides of the main channel, in a medium-dense to dense state, and is a moderately permeable layer. The sandy mudstone and muddy sandstone are widely distributed and have not been exposed within the exploration depth range. They belong to the weakly-moderately permeable layer. No surface water or groundwater was found in the reservoir area, and no anti-seepage geomembrane was laid on the dam slope and reservoir bottom. The on-site photo of the regulated reservoir is shown in Fig. 1, and the layout plan is shown in Fig. 2.
Fig. 1On site photo of regulated reservoir. Photographs were taken at the Hongguangou regulated reservoir site, Zhongwei City, Ningxia Hui Autonomous Region, China, by J.Y. Niu on 15 January 2024
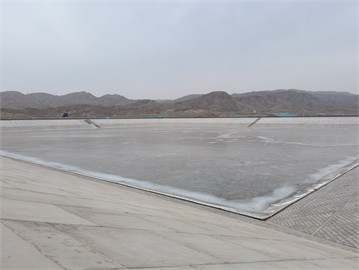
a) Ice cover on the reservoir surface, demonstrating conditions during the winter monitoring period
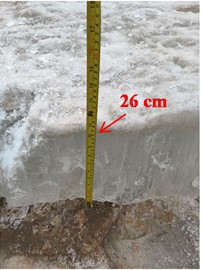
b) Measurement of ice thickness at the reservoir edge
Fig. 2Plan dimensions of the regulated reservoir
2.2. Results analysis of on-site investigation
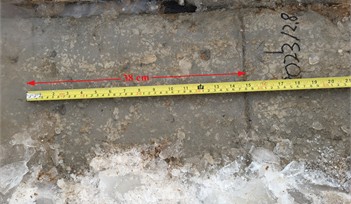
The method for measuring on-site seepage is to mark the height of the water level in the regulated reservoir twice during the periods when the regulated reservoir is not fed and not discharged. By calculating the reduction in storage volume based on the decrease in water level, the leakage rate of the regulating storage tank can be obtained. The on-site operations and changes in the water level line during the two measurements are shown in Fig. 3. The first measurements were taken on December 8, 2023 and January 15, 2024 (a total of 38 days), with a distance of 38 cm between the two marked positions on the dam slope surface. The vertical height difference was 13 cm, and the water depth decreased from 1 m to 0.87 m. The effect of water surface evaporation on the amount of seepage was considered negligible due to persistent sub-freezing temperatures (around –13 °C) and the presence of a continuous ice cover during the monitoring period, as supported by regional meteorological records. The thickness of the ice layer is about 26 cm, which can prove that ignoring the evaporation loss on the water surface is reasonable.
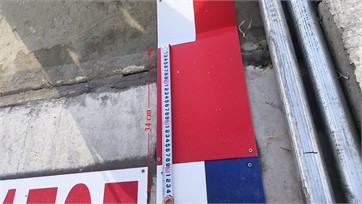
The seepage was calculated to be 16562.25 m3 for 38 days and 435.85 m3 per day. The second measurements were taken on April 27, 2024 and May 15, 2024 (a total of 18 days), with a distance of 34 cm between the two marked positions on the dam slope surface. The vertical height difference was 11 cm, and the water depth decreased from 9 m to 8.89 m. The impact of water surface evaporation needs to be considered during this measurement, with a total seepage and evaporation of 17693.55 m3.
The specific reservoir evaporation loss is related to the water surface area, evaporation, precipitation and other factors, which can be calculated according to the following formula:
where is the evaporation loss, 10000 m3; is the conversion coefficient for water surface evaporation of E601 evaporator; is the water surface evaporation rate, mm; is the water surface area of the reservoir, km2.
According to the “Specification for hydrologic computation of water resources and hydropower projects” (SL278-2002) [18], relevant calculation parameters were determined. The evaporation coefficient was determined as 0.65 following the SL278-2002 specification, which is standard for arid regions like Ningxia when using E601 evaporimeters. A sensitivity analysis revealed that a ±20 % variation in resulted in approximately ±7 % change in the calculated daily seepage rate, underscoring the need for accurate regional evaporation data in seepage quantification. It can be obtained that the total evaporation in the second measurement time period is 10,427.25 m3, the total seepage is 7,266.31 m3, and the daily seepage is 403.68 m3.
Fig. 3On site measurement of changes in the water level line of the regulated reservoir. Photographs were taken at the Hongguangou regulated reservoir, Zhongwei City, Ningxia Hui Autonomous Region, China, by S. Zhang on 15 January 2024 and 15 May 2024
a) Water level change observed during the first measurement period (December 2023 to January 2024)
b) Water level change observed during the second measurement period (April to May 2024)
Due to the calculation of evaporation using an empirical formula, there is a certain error in the leakage rate between the two measurements, but overall they are relatively close. Although the base of the dam and the foundation of reservoir bottom are weakly to moderately permeable layers, there is still a certain amount of seepage flow per day. Due to the deep groundwater level, there is no direct hydraulic connection between the groundwater surface and the reservoir bottom or dam foundation, and the regulated reservoir will remain in a stable free seepage stage.
3. Numerical simulation of seepage in regulated reservoir
3.1. Calculation model
In order to avoid the influence of errors in evaporation calculation on seepage calculation, the numerical model is calibrated based on the first measured seepage amount when simulating the seepage of the regulated reservoir in this section. The middle section is selected as the calculation section, in order to eliminate boundary effects, the distance from the bottom of the reservoir to the bottom boundary is 62 m, and the distance from the left and right dam bottoms to the boundary is 50 m, both of which meet the boundary requirement of 2 times the reservoir depth. The 2-D modeling approach assumes uniform seepage along the longitudinal axis, which is reasonable given the consistent geological profile and geometry of the reservoir. However, the absence of detailed downstream seepage mapping or geophysical profiling represents a limitation, and future work should include 3-D field validation.
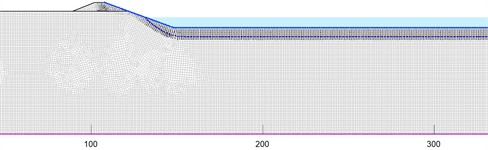
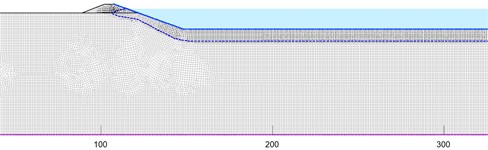
The bottom of the model is set as a fixed-head boundary of 0 m, the inside of the reservoir is set as a fixed-head boundary according to the water depth requirement, and the left and right sides are set as impermeable boundaries. Most of the dam bodies of the regulated reservoir are constructed using the fully filled method, and a small portion of the dam bodies are constructed using the half excavated and half filled method. In order to comprehensively consider the influence of construction methods on seepage amount, a fully filled (FF) model and a half excavated and half filled regulated reservoirs (HEHF) model were established, and the numerical models are shown in Fig. 4.
Fig. 4Grid diagram of numerical model for regulated reservoirs
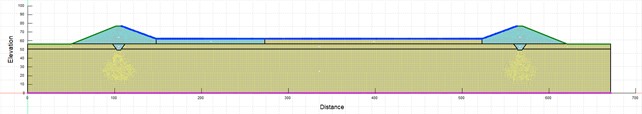
a) Fully filled model
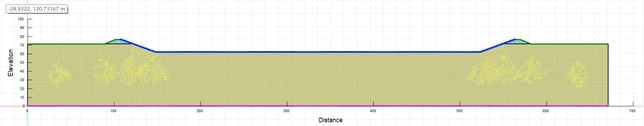
b) Half excavated and half filled model
3.2. Calculation of working conditions
By calculating the total underwater anti-seepage area of the entire three-dimensional regulated reservoir and the underwater anti-seepage area of the regulated reservoir per unit length of the reservoir bottom, the converted length of the reservoir bottom for the two-dimensional numerical model was calculated. This converted length can make the total underwater anti-seepage area of the two-dimensional numerical model and the three-dimensional model equal. The calculation conditions of numerical simulation, the calculation dimensions of the FF model and the HEHF model are shown in Table 1. The seepage calculation parameters for different rock and soil masses are shown in Table 2. The related seepage calculation parameters were selected as a representative average based on laboratory tests and geological survey data indicating that weakly weathered mudstone dominates the foundation.
Table 1Mechanical parameters of mineral rock mass
Working condition number | Construction method | Water depth / m | Unit length area / m2 | Converted length / m | Underwater infiltration area / m2 |
1 | FF | 1 | 380.85 | 335.85 | 127908.09 |
2 | FF | 3 | 392.56 | 347.51 | 136417.41 |
3 | FF | 6 | 410.11 | 364.93 | 149664.21 |
4 | FF | 9 | 427.67 | 382.28 | 163490.38 |
5 | FF | 12 | 445.23 | 399.56 | 177895.94 |
6 | HEHF | 1 | 380.85 | 335.85 | 127908.09 |
7 | HEHF | 3 | 392.56 | 347.51 | 136417.41 |
8 | HEHF | 6 | 410.11 | 364.93 | 149664.21 |
9 | HEHF | 9 | 427.67 | 382.28 | 163490.38 |
10 | HEHF | 12 | 445.23 | 399.56 | 177895.94 |
Table 2Calculation parameters for seepage of rock and soil mass
Type | Permeability coefficient / (m/s) | Saturated volumetric water content |
Seepage interceptor | 1e-07 | 0.6 |
Weakly weathered mudstone | 2e-07 | 0.585 |
Filling material | 4e-06 | 0.8 |
3.3. Result analysis
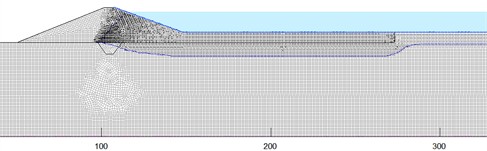
After repeated adjustments of the calculation parameters, primarily the saturated hydraulic conductivity and saturated volumetric water content of the mudstone foundation within their plausible ranges (refer to Table 2), the simulated seepage amount for the 38-day period was calibrated to 16,581.59 m3. This represents a relative error of 0.12 % compared to the field-measured value of 16,562.25 m3, demonstrating a high degree of model fidelity. Fig. 5 shows the position of the infiltration line of the FF regulated reservoir at different water depths after 38 days of seepage. Fig. 6 shows the position of the infiltration line of the HEHF regulated reservoir at different water depths after 38 days of seepage. The statistical values of seepage for each working condition are shown in Table 3. Comparing Fig. 5 and Fig. 6, it can be seen that seepage always occurs at the dam body and reservoir bottom of the FF regulated reservoir at different water depths. The HEHF regulated reservoir experiences seepage in both the dam body and the reservoir bottom when the water depth is 12 m, and seepage only occurs in the mudstone layer at the reservoir bottom when the water depth is between 1 m and 9 m. The FF regulated reservoir and the HEHF regulated reservoir have different characteristics of infiltration line changes. The infiltration line of the HEHF regulated reservoir is smoother than that of the FF regulated reservoir, which is caused by the difference in permeability coefficients between the dam body and the mudstone strata.
In order to quantitatively calculate the seepage amount of the regulated reservoir under the condition of no anti-seepage measures for mudstone, and provide reference for engineering design, construction, and management personnel to preliminarily estimate the seepage amount, according to Darcy’s law, the formula for calculating the seepage amount of the regulated reservoir is defined as:
where is the estimated seepage amount of the regulated reservoir, m3/s; is the permeability coefficient of the foundation of the regulated reservoir, m/s, which is provided by the engineering geological survey; is the seepage area of the regulated reservoir, m2; is the seepage path coefficient, which is related to the degree of seepage of the dam body and the reservoir bottom; is the average annual water depth of the reservoir, m.
Fig. 5Variation of infiltration line at different water depths in the fully filled regulated reservoirs
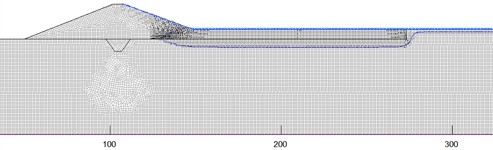
a) FF regulated reservoir with the meter depth of 1 m
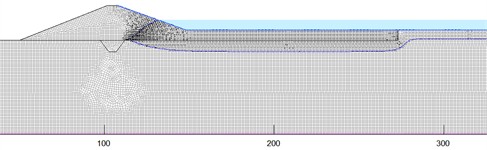
b) FF regulated reservoir with the meter depth of 6 m
c) FF regulated reservoir with the meter depth of 12 m
Fig. 6Variation of infiltration line at different water depths in the half excavated and half filled regulated reservoirs
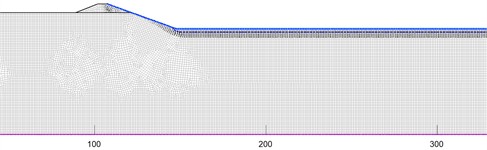
a) HEHF regulated reservoir with the meter depth of 1 m
b) HEHF regulated reservoir with the meter depth of 6 m
c) HEHF regulated reservoir with the meter depth of 12 m
Table 3Statistical values of seepage amount under different working conditions
Working condition number | Daily seepage amount / m3 | Annual seepage amount / 10000 m3 | Seepage amount per second / (m3/s) | Annual leakage as a percentage of total storage capacity / % |
1 | 436.36 | 15.93 | 0.00505 | 7.77 |
2 | 490.48 | 17.90 | 0.00568 | 8.73 |
3 | 544.66 | 19.88 | 0.00630 | 9.70 |
4 | 593.51 | 21.66 | 0.00687 | 10.57 |
5 | 649.65 | 23.71 | 0.00752 | 11.57 |
6 | 376.94 | 13.76 | 0.00436 | 6.71 |
7 | 427.80 | 15.61 | 0.00495 | 7.62 |
8 | 481.79 | 17.59 | 0.00558 | 8.58 |
9 | 521.47 | 19.03 | 0.00604 | 9.28 |
10 | 568.62 | 20.75 | 0.00658 | 10.12 |
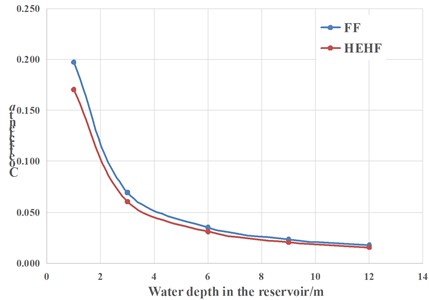
The dam body is equipped with anti-seepage grooves, and compared with the seepage area of the mudstone formation at the reservoir bottom, the seepage area of the dam body is very small. In order to simply carry out the parameters assignment in the calculation formula, the permeability coefficient in Eq. (2) is taken from the permeability coefficient of mudstone strata, and the calculation results of the coefficient are shown in Table 4. The variation of coefficient with water depth under the construction methods of FF and HEHF is shown in Fig. 7. It can be seen that for the FF regulated reservoir, the foundation of the reservoir bottom is weakly weathered mudstone, and the permeability coefficient is taken as 2×10⁻⁷ m/s. Therefore, the range of coefficient is 0.018~0.197. If the construction method is changed to half excavated and half filled, the weakly weathered layer of mudstone is 0.65 times the height of the reservoir depth, and the permeability coefficient is taken as 2×10⁻⁷ m/s, the value of coefficient a is taken in the range of 0.015-0.17. When the water depth is 1-3 m, the variation amplitude of coefficient is relatively large, and when the water depth is greater than 3 m, the variation amplitude of coefficient is relatively small. It should be noted that when the water depth is small, there may be significant errors in the selection of coefficient . The relatively high value of at 1 m depth (0.197) may be attributed to the heightened contribution of lateral seepage under shallow conditions. The trend line in Fig. 7 represents the best fit curve, but there may be corresponding errors in practical engineering. It is important to note that the seepage amount of the regulated reservoir is also related to the saturated volumetric water content of the underlying rock and soil mass, so the value of the geological permeability coefficient is not a complete indication of the seepage amount of the regulated reservoir. Although the permeability coefficient of weakly weathered or slightly weathered sandy mudstone or mudstone is relatively small, considering the complexity of the geological conditions of foundation surface of reservoir, the difficulty in ensuring the consistency of the construction quality of dam body filling and reservoir bottom backfilling, there is still a certain amount of seepage in the regulated reservoir every day, which accounts for about 7-10 % of the total storage capacity. Eq. (2) employs the average annual water depth for simplicity. For reservoirs experiencing substantial seasonal water level fluctuations, integrating a time-varying depth over a hydrograph would yield a more precise annual leakage estimate and is recommended for detailed design. In addition, the current model uses a lumped coefficient for simplicity. A dual-parameter formulation distinguishing between bottom and lateral seepage paths could improve accuracy, especially at extreme water depths, and is suggested for future research.
To enhance the practical utility of Eq. (2) for engineering design, an empirical relationship between the seepage path coefficient and the water depth (in meters) was derived based on the data for the Fully Filled (FF) condition in Table 4. The best-fit power-law relationship is given by:
Eq. (3) provides a direct means to estimate coefficient for preliminary seepage calculations within the studied water depth range (1-12 m).
Table 4Calculation results of coefficient a under different working conditions
Working condition number | Seepage amount / (m3/s) | Seepage area of reservoir / m2 | Water depth / m | Coefficient |
1 | 0.00505 | 127908.09 | 1 | 0.197 |
2 | 0.00568 | 136417.41 | 3 | 0.069 |
3 | 0.00630 | 149664.21 | 6 | 0.035 |
4 | 0.00687 | 163490.38 | 9 | 0.023 |
5 | 0.00752 | 177895.94 | 12 | 0.018 |
6 | 0.00436 | 127908.09 | 1 | 0.170 |
7 | 0.00495 | 136417.41 | 3 | 0.060 |
8 | 0.00558 | 149664.21 | 6 | 0.031 |
9 | 0.00604 | 163490.38 | 9 | 0.021 |
10 | 0.00658 | 177895.94 | 12 | 0.015 |
Fig. 7Variation of coefficient a with water depth in the reservoirs under different construction methods
4. Sensitivity analysis of influencing factors
4.1. Experimental plan design
In order to investigate the degree of influence of different parameter variables on the seepage amount of the regulated reservoir in the numerical simulation, the orthogonal experimental design method was used for the numerical simulation calculation. Four main influencing factors, permeability coefficient, saturated volumetric water content, water depth, and bottom width of reservoir, were selected and three levels were taken for each factor. The three levels of permeability coefficient are 6×10⁻⁸ m/s, 2×10⁻⁷ m/s and 3.4×10⁻⁷ m/s, respectively. The three levels of saturated volume moisture content S are 0.545, 0.585, and 0.625, respectively. The three levels of water depth are 1 m, 6 m, and 11 m respectively. The three levels of bottom width of reservoir are 100 m, 300 m, and 500 m, respectively. The construction methods are set as fully filled (FF), half filled regulated reservoirs (HEHF) and fully excavated (FE). Each construction method includes 9 sets of orthogonal experimental schemes, for a total of 27 experimental schemes. The calculation results are shown in Table 5.
4.2. Calculation results of sensitivity analysis
Table 6 shows the range analysis results of different influencing factors under three construction methods. The sensitivity of different influencing factors can be ranked by comparing the magnitude of the range analysis results. The larger the range analysis results indicates that the seepage of the regulated reservoir is more sensitive to the influencing factors. It can be seen that under the three types of construction methods of FF, HEHF, and FE, the sensitivity of the four influencing factors from high to low is the bottom width , water depth , permeability coefficient , and saturated volume water content . The sensitivity of the bottom width of the reservoir to the seepage of the regulated reservoir is the highest, while the sensitivity of the saturated volume water content is the lowest. The consistent sensitivity ranking across construction methods, including the fully excavated (FE) case without a dam, indicates that seepage is primarily governed by the reservoir’s geometry and the foundation mudstone properties, as the permeability contrast minimizes the dam’s influence relative to the foundation. It is important to note that this specific sensitivity ranking () is characteristic of seepage through fractured, low-permeability media like mudstone. In highly permeable porous aquifers, the relative importance of factors, particularly hydraulic conductivity, would differ significantly.
Table 5Results of orthogonal tests
Test number | Construction method | / (m/s) | / m | / m | Total seepage amount / m3 | |
1 | FF | 6.00E-08 | 0.545 | 1 | 100 | 1195.989 |
2 | FF | 6.00E-08 | 0.585 | 6 | 300 | 14212.035 |
3 | FF | 6.00E-08 | 0.625 | 11 | 500 | 43550.339 |
∙∙∙ | ∙∙∙ | ∙∙∙ | ∙∙∙ | ∙∙∙ | ∙∙∙ | ∙∙∙ |
7 | FF | 3.40E-07 | 0.545 | 11 | 300 | 15601.132 |
8 | FF | 3.40E-07 | 0.585 | 1 | 500 | 29828.921 |
9 | FF | 3.40E-07 | 0.625 | 6 | 100 | 2508.551 |
10 | HEHF | 6.00E-08 | 0.545 | 1 | 100 | 1179.247 |
11 | HEHF | 6.00E-08 | 0.585 | 6 | 300 | 13660.145 |
12 | HEHF | 6.00E-08 | 0.625 | 11 | 500 | 42402.729 |
∙∙∙ | ∙∙∙ | ∙∙∙ | ∙∙∙ | ∙∙∙ | ∙∙∙ | ∙∙∙ |
16 | HEHF | 3.40E-07 | 0.545 | 11 | 300 | 14492.986 |
17 | HEHF | 3.40E-07 | 0.585 | 1 | 500 | 29792.436 |
18 | HEHF | 3.40E-07 | 0.625 | 6 | 100 | 2371.083 |
19 | FE | 6.00E-08 | 0.545 | 1 | 100 | 1173.171 |
20 | FE | 6.00E-08 | 0.585 | 6 | 300 | 13508.843 |
21 | FE | 6.00E-08 | 0.625 | 11 | 500 | 42280.893 |
∙∙∙ | ∙∙∙ | ∙∙∙ | ∙∙∙ | ∙∙∙ | ∙∙∙ | ∙∙∙ |
25 | FE | 3.40E-07 | 0.545 | 11 | 300 | 14391.674 |
26 | FE | 3.40E-07 | 0.585 | 1 | 500 | 29761.667 |
27 | FE | 3.40E-07 | 0.625 | 6 | 100 | 2350.542 |
Table 6Range analysis of influencing factors in numerical simulation
Construction method | ||||
FF | 3695.75 | 3190.41 | 6857.75 | 32982.99 |
HEHF | 3564.21 | 3085.56 | 5996.20 | 32475.49 |
FE | 3540.23 | 3081.00 | 5951.89 | 32422.94 |
In order to verify the correctness of the above analysis results, the grey correlation method was used to conduct sensitivity analysis on the numerical simulation results under fully filled construction conditions. The grey correlation degree obtained by the grey correlation method is a value between 0 and 1, and the closer its value is to 1 indicates the stronger the correlation between the influence factor and the calculation result. The calculation result of grey correlation degree is shown in Fig. 8. It can be seen that the results of the grey correlation method are consistent with the range analysis results, and the sensitivity ranking of the influencing factors is still as follows: pool bottom width , water depth , permeability coefficient , and saturated volume water content .
Fig. 8Grey correlation degree of various influencing factors under different construction methods
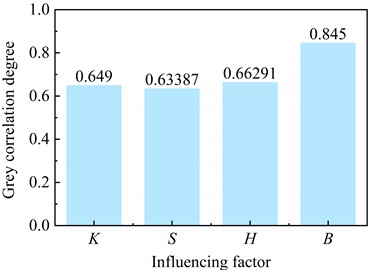
a) FF model
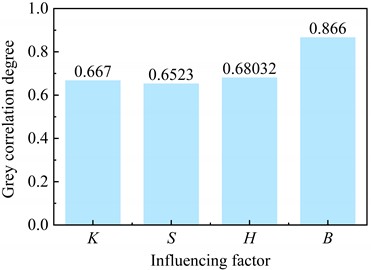
b) FF model
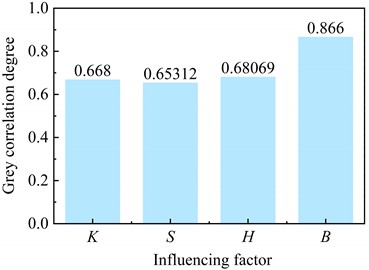
c) FE model
5. Prediction model for seepage amount of regulated reservoir
5.1. Introduction to prediction methods
The BP neural network model is a feed-forward network model trained according to the algorithm of error backward transmission, and it is also the most widely used prediction model [19]. The network consists of an input layer, a hidden layer, and an output layer. Through forward propagation of signals and backward propagation of errors, the weights between each layer are finally obtained, and a prediction model is established. In the parameter settings, the number of hidden layers is 1, the number of hidden layer neurons is 8, the learning rate is 0.01, the L2 regularization coefficient is 0.001, and the training epochs are 200.
The Bayesian regression (BR) is a statistical modeling method based on a probabilistic framework. The integration of uncertainty quantification and domain knowledge is achieved by introducing the prior distribution of the parameters and deriving the posterior distribution of the parameters jointly with the likelihood function of the observed data [20]. Compared with traditional regression methods, its advantage lies in its ability to integrate a priori information such as expert experience or physical mechanisms through prior distributions, which significantly improves the generalization ability of the model, especially in small sample scenarios. The Bayesian regression encodes the degree of influence of input variables (bottom width of reservoir > water depth > permeability coefficient > saturated volume water content) into model parameters by setting a heteroscedastic normal prior distribution, in order to improve generalization ability in small samples. The prior standard deviation of the regression coefficient is positively correlated with the importance of the variable, as shown in Eq. (4):
where , , and correspond to the prior constraint strengths of bottom width of reservoir, water depth, permeability coefficient, and saturated volume water content in sequence. The variables with high importance, such as bottom width of reservoir (4), are assigned larger standard deviations, allowing their coefficients to be freely adjusted to capture dominant effects. The secondary variables, such as saturated volumetric moisture content (1), are strictly constrained to suppress noise interference. This setting is equivalent to adaptive regularization, which can avoid overfitting while ensuring that the model focuses on key physical laws. The noise term σ is assumed to follow a half-normal distribution( HalfNormal(10)), which can limit the observation error standard deviation to a reasonable range.
After determining the prior distribution, the No-U-Turn Sampler (NUTS) algorithm is used to perform Markov Chain Monte Carlo (MCMC) sampling. The parameters are set to 2000 total iterations (including 1000 combustion periods), 2 chains, and a target acceptance rate of 0.90. The convergence is verified by the Gelman-Rubin statistic, and subsequently the posterior mean coefficients are extracted to calculate the predicted values of the test set.
The support vector machine (SVM) model is a generalized learning method developed on the basis of statistical learning theory and structural risk minimization principles. The SVM can demonstrate strong generalization ability when facing pattern recognition problems with small samples, nonlinearities, and high dimensions [21]. In the parameter settings, the penalty factor is taken as 4, and the radial basis function parameter is taken as 0.8.
5.2. Prediction result analysis
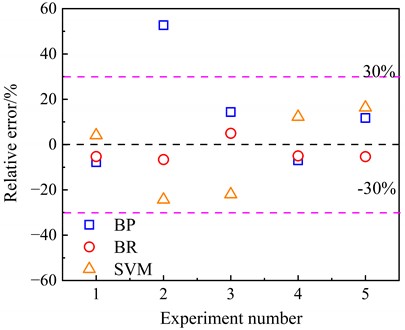
The diagonal error of prediction and the relative error of prediction of the total seepage from the regulated reservoirs by the BP neural network model, Bayesian regression model and the support vector machine model are shown in Figs. 9-10, respectively. For the total seepage predicted by different models, the coefficient of determination is used to evaluate the fitting accuracy of the seepage prediction models for different regulated reservoirs, as shown in Eq. (5). The prediction accuracy is evaluated using mean absolute error (MAE), mean relative error (MRE), and running time, as shown in Eqs. (6-7):
where is the number of test samples; is the actual seepage amount; is the predicted seepage amount; is the average value of the actual flow.
The evaluation indicators for the prediction results of different prediction models are shown in Table 7.
Table 7Evaluation of prediction results of the BP model, Bayesian Regression, and SVM model
Computational models | MAE (m3) | MARE (%) | Run time (s) | |
BP | 0.97 | 1,376.67 | 18.72 | 5-10 s |
BR | 0.99 | 653.45 | 5.43 | 25-30 s |
SVM | 0.97 | 1,347.74 | 15.79 | < 5 s |
The prediction results of total seepage from BR model have the largest and the smallest MAE and MRE, indicating that the BR model has the highest prediction accuracy. The prediction results of total seepage based on SVM model and BP model have the same , but the MAE and MRE of both models are significantly higher than that of BR model. The prediction accuracy based on SVM model is slightly better than that based on BP model. Leave-one-out cross-validation was used to assess robustness. Performance metrics gradually degraded with smaller training sets (e.g., decreased to 0.88 for 9), yet Bayesian regression consistently outperformed comparative models, demonstrating its suitability for small-sample engineering prediction problems. Then, in terms of the training time of the models, the SVM model has the shortest training time, followed by the BP model, and the BR model has the longest training time. This is because the BR model takes into account the effect of ranking the degree of influence of input variables on model performance, resulting in increased computation time. Neither the BP model nor the SVM model integrates the ranking of the degree of influence of variables, so the prediction accuracies of both models are significantly lower than that of BR model, and the training time of both models are significantly shorter than that of BR model.
Fig. 9Diagonal error of seepage amount for different prediction models
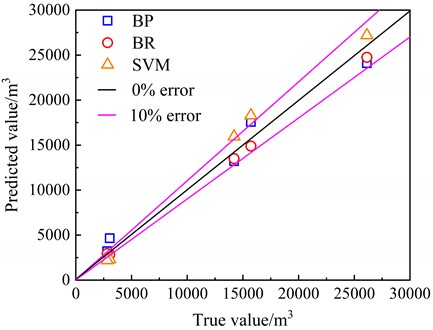
Fig. 10Relative error of seepage amount for different prediction models
In summary, Bayesian regression realizes the organic coupling of data-driven and physical mechanisms by embedding domain knowledge into prior distributions. Its application in seepage prediction shows that this method can not only effectively improve the modeling robustness of small sample data, but also provide probabilistic basis for engineering risk assessment through posterior distribution. This method can be extended to other engineering scenarios where monitoring data is scarce but some prior information is clear, providing new methodological support for reliability analysis of complex systems.
Future studies should consider time-dependent permeability due to consolidation or clogging. A long-term monitoring program, including periodic in-situ permeability tests and seepage measurements every 3-5 years, is recommended to validate and update the predictive model over the reservoir's lifecycle. The quantified seepage rates provide essential input for subsequent economic analyses comparing the present-value cost of water loss against the installation and maintenance expenses of anti-seepage measures like geomembranes. The proposed methodology is primarily applicable to arid/semi-arid regions with fractured mudstone geology. Its applicability may be limited in humid climates, or in geological settings dominated by matrix flow (e.g., porous aquifers) or significant karstification.
6. Conclusions
Based on the prototype of the Hongdugou regulated reservoir in Ningxia, the seepage estimation formula of the regulated reservoir under the condition of mudstone without seepage control measures was determined on the basis of mutual verification of on-site monitoring and numerical simulation. In addition, the sensitivity analysis was conducted on the factors affecting the seepage of the regulated reservoir, and a seepage prediction model based on the importance of the influencing factors was proposed.
1) For the regulated reservoir built in sandy mudstone or mudstone geological conditions, when the stratum permeability coefficient is 6×10⁻⁸-2×10⁻⁷ m/s (slightly weathered, weakly weathered), the regulated reservoir still exists in a certain amount of seepage every day, accounting for about 7 to 10 % of the total reservoir capacity. In the formula for estimating the seepage amount of a regulated reservoir without lying geomembrane, the seepage path coefficient can be taken as 0.015-0.197. When constructing regulated reservoirs on sandy mudstone or mudstone formations, anti-seepage design of the bottom and surroundings of the reservoir should be carried out.
2) The total seepage amount of the regulated reservoir was set as the target parameter, the sensitivity of the factors affecting the seepage of the regulated reservoir was analyzed by combining the grey correlation method with numerical simulation. The sensitivity ranking of influencing factors from high to low is as follows: reservoir bottom width, water depth, permeability coefficient, and saturated volume water content. This hierarchy is particularly representative for fractured, low-permeability geological settings similar to the mudstone studied here.
3) Based on the results of the sensitivity analysis of the influencing factors, the Bayesian regression method can adaptively adjust the variable contribution weights through the prior distributions. The prediction accuracy of the adopted method is significantly better than that of traditional regression models under 27 training samples. This research approach provides a highly accurate and strongly robust solution to the small sample engineering prediction problem.
This study presents a comprehensive framework for quantifying and predicting seepage in regulated reservoirs constructed on fractured mudstone formations. The key innovations include: (1) development of a field-validated empirical formula for rapid seepage estimation in mudstone geology, providing practical tools for engineering design; (2) implementation of a Bayesian regression model that incorporates domain knowledge through prior distributions, demonstrating superior predictive accuracy with limited training data; (3) establishment of a novel methodology integrating field monitoring, numerical simulation, and machine learning for robust seepage prediction in data-scarce environments.
References
-
C. Yuan et al., “National estimation of regulated water storage of reservoirs in China,” Journal of Hydrology, Vol. 645, p. 132296, Dec. 2024, https://doi.org/10.1016/j.jhydrol.2024.132296
-
Z. D. Xie, B. J. Liu, and M. Cui, “Thoughts on ecological protection and high quality development in the Yellow River Basin,” (in Chinese), Water Resources Development Research, Vol. 25, No. 2, pp. 21–25, 2025, https://doi.org/10.13928/j.cnki.wrdr.2025.02.004
-
S. Nan et al., “Electrical resistivity imaging and dye tracing test for joint investigation of reservoir leakage paths: a case study of loess area,” Bulletin of Engineering Geology and the Environment, Vol. 82, No. 9, p. 348, Aug. 2023, https://doi.org/10.1007/s10064-023-03371-5
-
X. Man, H. Zhou, X. Liu, Y. Chen, and H. Qu, “Permeability test of geotextile-soil system under different sand filling heights,” Journal of Measurements in Engineering, Vol. 13, No. 1, pp. 168–184, Mar. 2025, https://doi.org/10.21595/jme.2025.24555
-
P. Asem and P. Gardoni, “A probabilistic, empirical model for permeability of mudstone,” Probabilistic Engineering Mechanics, Vol. 69, p. 103262, Jul. 2022, https://doi.org/10.1016/j.probengmech.2022.103262
-
M. Zhang, Y. Dong, and P. Sun, “Impact of reservoir impoundment-caused groundwater level changes on regional slope stability: a case study in the Loess Plateau of Western China,” Environmental Earth Sciences, Vol. 66, No. 6, pp. 1715–1725, Jun. 2012, https://doi.org/10.1007/s12665-012-1728-6
-
Z. Hu, M. Liu, Y. Wang, M. Ye, and S. Li, “Geophysical assessment of freshwater intrusion into saline aquifers beneath plain reservoirs,” Journal of Environmental and Engineering Geophysics, Vol. 27, No. 1, pp. 13–22, Mar. 2022, https://doi.org/10.32389/jeeg21-012
-
Y.-C. Hung, T.-T. Chen, T.-F. Tsai, and H.-X. Chen, “A Comprehensive Investigation on Abnormal Impoundment of reservoirs-a case study of Qionglin reservoir in Kinmen Island,” Water, Vol. 13, No. 11, p. 1463, May 2021, https://doi.org/10.3390/w13111463
-
P. Li, “Leakage analysis of regulated reservoir in loess areas,” (in Chinese), Shaanxi Water Resources, Vol. 5, pp. 125–127, 2017, https://doi.org/10.16747/j.cnki.cn61-1109/tv.2017.05.049
-
X. Man, H. Li, H. Xiao, H. Wang, and M. Rong, “Effect of warp and weft uniaxial tension on the permeability of sand covered with geotextile,” Journal of Measurements in Engineering, Vol. 10, No. 3, pp. 105–116, Sep. 2022, https://doi.org/10.21595/jme.2022.22681
-
B. Liu et al., “Cascade surface and borehole geophysical investigation for water leakage: A case study of the Dehou reservoir, China,” Engineering Geology, Vol. 294, p. 106364, Dec. 2021, https://doi.org/10.1016/j.enggeo.2021.106364
-
C. Yang, Z. Shen, L. Xu, and H. Shen, “A simplified method for leakage estimation of clay core dams with different groundwater levels,” Water, Vol. 14, No. 12, p. 1961, Jun. 2022, https://doi.org/10.3390/w14121961
-
B.-L. Gan, D.-M. Zhang, Z.-K. Huang, F.-Y. Zheng, R. Zhu, and W. Zhang, “Ontology-driven knowledge graph for decision-making in resilience enhancement of underground structures: Framework and application,” Tunnelling and Underground Space Technology, Vol. 163, p. 106739, Sep. 2025, https://doi.org/10.1016/j.tust.2025.106739
-
X. Man, G. Sha, S. Hu, H. Bao, and G. Liu, “Experimental study on permeability characteristics of geotubes for seepage analysis on safety assessment of dams,” Structural Durability and Health Monitoring, Vol. 14, No. 4, pp. 303–314, Jan. 2020, https://doi.org/10.32604/sdhm.2020.011009
-
S. Ghabezloo, J. Sulem, and J. Saint-Marc, “Evaluation of a permeability-porosity relationship in a low-permeability creeping material using a single transient test,” International Journal of Rock Mechanics and Mining Sciences, Vol. 46, No. 4, pp. 761–768, Jun. 2009, https://doi.org/10.1016/j.ijrmms.2008.10.003
-
J. Wu, “Application practice and prospect of artificial intelligence in water sector,” (in Chinese), Water Resources Development Research, Vol. 24, No. 8, pp. 44–49, 2024, https://doi.org/10.13928/j.cnki.wrdr.2024.08.008
-
Z. Hou, J. Niu, J. Zhu, and L. Lu, “Flow prediction of a measurement and control gate based on an optimized back propagation neural network,” Applied Sciences, Vol. 13, No. 22, p. 12313, Nov. 2023, https://doi.org/10.3390/app132212313
-
“Specification for hydrologic computation of water resources and hydropower projects,” (in Chinese), Ministry of Water Resources of the People's Republic of China, SL/T 278-2020, 2020.
-
Y. Yang, Z. Lin, H. Lu, and X. Zhan, “Prediction model of lateral spreading of liquefied soil during earthquakes based on neural network,” Vibroengineering Procedia, Vol. 51, pp. 42–48, Oct. 2023, https://doi.org/10.21595/vp.2023.23541
-
A. Elaoud, R. Jalel, and H. Ben Hassen, “Bayesian network versus variational Bayesian Linear Regression model for predicting penetration resistance and compaction factors in agricultural soils,” Computers and Electronics in Agriculture, Vol. 230, p. 109913, Mar. 2025, https://doi.org/10.1016/j.compag.2025.109913
-
A. Roy and S. Chakraborty, “Support vector machine in structural reliability analysis: A review,” Reliability Engineering and System Safety, Vol. 233, p. 109126, May 2023, https://doi.org/10.1016/j.ress.2023.109126
About this article

This study has received financial support from the Youth Talent Cultivation Program of North Minzu University (Grant No. 2025QNPY22), the Ningxia Natural Science Foundation (Grant No. 2025BEG02024), the Sustainable Land and Water Management for Ecological Restoration in Arid Regions of Ningxia Science and technology innovation team (Grant No. 2024CXTD015), the Ningxia Key Research and Development Program (Grant No. 2023BEG03056, 2025BEE02011), and the Yinchuan Science and Technology Plan Project (Grant No. 2023SFZD06). The financial supports are gratefully acknowledged.
The datasets generated during and/or analyzed during the current study are available from the corresponding author on reasonable request.
Jiayong Niu: conceptualization, methodology, resources, validation, writing-review and editing. Shuai Zhang: methodology, software, validation, formal analysis, writing-original draft preparation. Taiyun Li and Lixin Zhang: conceptualization, data curation, project administration, writing-review and editing. Jiayong Niu and Taiyun Li: software, validation, investigation, data curation.
The authors declare that they have no conflict of interest.
