Abstract
Effective evaluation of equipment criticality is a key concern in Engineering Asset Management, particularly in operationally intensive industries such as mining. While the concept of criticality is often subjective, it can be assessed more objectively using quantifiable indicators such as cost, downtime, and failure rate. This paper presents a data-driven approach to assess equipment-level criticality by analysing the impact of individual equipment downtimes on overall system performance. Focusing on a case study from a gold mining operation in Australia, the study demonstrates how equipment-level performance can be used to prioritise maintenance efforts and support more informed decision-making. One of the key contributions of this work lies in its integration of statistical modelling and probabilistic analysis to identify critical equipment within a system. Unlike conventional methods that often overlook uncertainty or assume uniform equipment influence, this approach quantifies the impact of individual equipment failures on system-level outcomes. The analysis treats subsystems independently, acknowledging the absence of interdependency data while still capturing meaningful insights about their relative importance. By leveraging a combination of platforms – Excel for data preprocessing, R for simulation, and Netica for network-based evaluation – the study offers a replicable and scalable methodology for criticality assessment. Sensitivity analysis within the Bayesian Network model further enhances the framework by highlighting components with the highest influence on system reliability. The outcome is a transparent, objective, and practically applicable tool for maintenance prioritisation, offering significant value in data-intensive and reliability-critical environments like mining. This paper contributes to the growing body of research focused on integrating operational data with advanced modelling techniques to improve asset performance management.
1. Introduction
In today’s data-driven era, everything generates data, and the entire world is busy collecting this data, consequently increasing the use of data visualisation to analyse the patterns of that data. A wide range of industries across different sectors provide access to datasets that may support the analysis and benchmarking of operational processes. As data becomes more available and abundant, visual methods are often employed to aid in the interpretation and communication of data insights. This has strengthened the role of graphics and data visualisation in enhancing understanding and supporting informed decision-making. Though these techniques represent recent developments in statistics, the graphical representation of quantitative information has deep historical roots in map-making and early forms of visual communication. Later it was applied in thematic cartography, statistical graphics and in many fields of medicine and science. This gave rise to widespread data collection and statistical thinking for planning and commerce through the 19th century. Along the way, the development of technologies for drawing and reproducing images, advances in mathematics and statistics, and new developments in data collection, empirical observation and recording contributed to the widespread use of data visualisation today [1].
In Industry 4.0, enterprises generally function using complicated processes which yield large amounts and sizes of data. The complexity of studying this data, consisting of multiple critical elements and uncertainties, is always a challenge to define due to the different environments in which the different processes exist. A visual representation of data from such complicated processes helps in highlighting the different patterns, critical elements and paths, interdependency of elements, etc. existing in the data. This allows the decision-maker to derive the desired conclusions. The purpose of visual representations is to make life easy for a viewer, helping them interpret the meaning from patterns in the data [2]. Data visualisation plays a very dynamic role in industries producing large amounts of data continuously, which are difficult to analyse daily. But visualization also helps decision-makers understand data better. In simple terms, data visualisation can be considered as visual communication between the data and the user by analysing the data and representing it with different tools and techniques [3]. According to Umadevi and Geraldine Bessie Amali [4], data visualisation is the representation of information or data in a graphical format.
Data visualisation can also help in the maintenance decision-making process, which focuses on reducing the risk associated with the system failures. These failure modes exist in a complex network of equipment and analysing this network of equipment to study these failure modes is a challenging task. Each failure mode carries a risk profile of different criticality and identification of these critical failure modes further assist the smooth operation of assets. Criticality can be assessed with quantifiable elements like cost, downtime or failure rate to remove the uncertainties from the decision-making process. The term “critical” and the topic of criticality is a very subjective matter and may have different perspectives in different industries depending on how they are defined. From an engineering asset management (EAM) perspective, criticality analysis helps in drafting maintenance strategies, which further helps in improving the complex production processes [5]. In EAM, the criticality of an asset is derived based on the risk associated with the asset failure. The risk can be identified and assessed with different risk assessment techniques, either qualitative or quantitative, by identifying and analysing the failure modes and their effects on the assets. Thus, historical failure data consisting of different failure modes from an array of throughput delivering assets is important information for any organisation. Analysing this information by representing it as a graphical network may therefore unlock a better understanding of the criticality that individual assets pose within a collective network of equipment striving to produce desired outputs.
A network, which is a form of graph, is a set of connected points with a certain distance between them, establishing a relationship or correlation with each other. According to graph theory, a graph is a mathematical structure consisting of two elements Vertices () (or nodes) and Edges (), and which is mathematically represented as . In a network, any node may be connected by edges to any number of other nodes, which signifies a relationship between those nodes. The total number of edges that connect a node is known as the degree of that node. ‘In Degree’ highlights the number of edges pointing to a node and “Out Degree” highlights the number of edges going out of a node. The weighted edge shows the relationship between the nodes which are considered to have some value. There are different types of graphs available for different purposes, but the two most generic types are directed and undirected graphs as shown in Fig. 1. A directed graph is a graph with an arrow on its edge, which symbolizes an ordered and non-transitive relationship between two nodes. An undirected graph is a graph with no arrow on its edge, which shows an unordered and transitive relationship between two nodes [6]. For more basic definitions related to Graph theory, the paper by Zhang and Chartrand [7] and Stephenson [8] can be referred to.
Fig. 1Undirected and directed graph

a) Undirected graph
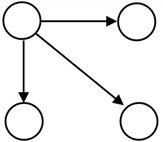
b) Directed graph
Bayesian Network (BN) originated from efforts to represent expert knowledge in fields where uncertainty, ambiguity, and incompleteness exist. They are grounded in probability theory and consist of two levels: qualitative and quantitative. At the qualitative level, a BN is depicted as a directed acyclic graph (DAG), where nodes represent variables and directed arcs define the conditional independence relationships within the model. At the quantitative level, these dependency relationships are expressed through conditional probability distributions assigned to each variable in the network. Each variable has a defined state space, consisting of mutually exclusive and exhaustive possible values [9]. BN can be constructed using two distinct approaches: the data-based approach and the knowledge-based approach. The data-based approach focuses on methods for building BN using available data. In contrast, the knowledge-based approach relies on expert domain knowledge to develop the network structure. This approach is particularly valuable in scenarios where domain expertise is essential, and data availability is limited [9]. BN have proven their effectiveness in the fields of causal inference, artificial intelligence in supporting uncertainty analysis and probabilistic reasoning of a system [10]. Many software platforms are available for the construction of a BN, such as Bayes Net Toolbox (BNT), BayesBuilder, and JavaBayes, of which the MATLAB-based BNT developed by Murphy [11] is extensively used. According to Zou and Yue [12], this toolbox provides a lot of basic function libraries for BN learning, but it does not combine the basic functions for BN learning into a system. Absence of Graphical User Interface (GUI) in BNT, makes it not user-friendly.
The term criticality mapping is derived based on the concept of causality mapping. Causality refers to the relationship between cause and effect whereas criticality describes the consequence of the event. Thus, mapping criticality gives an overview of its impact on the final desired output. The concept of constructing a BN using criticality mapping approach is inspired by the work of Nadkarni and Shenoy [9]. This paper presents a data-driven reliability modelling framework developed through a case study of a gold mining operation in Australia. The focus of the study is on improving maintenance decision-making by identifying the most critical equipment, in a system, whose failure has the most significant impact on system-level performance. Mining operations are characterised by the continuous operation of complex and interdependent equipment under harsh and variable environmental conditions. In such settings, unplanned equipment failures can lead to significant operational disruptions, production losses, and elevated maintenance costs. Despite the availability of historical operational data, traditional maintenance strategies in mining often rely on heuristics or reactive approaches that fail to leverage probabilistic insights into system behaviour. The core objective of this study is to propose and validate a systematic method to identify critical sub-systems within a larger system by analysing a key operational variable – equipment downtime. This approach moves beyond general reliability rankings or expert-based failure mode analyses by quantitatively modelling the variation in downtime using historical data and integrating it into a Bayesian Network (BN) structure. The BN model facilitates the estimation of how individual equipment-level downtimes influence overall system performance, thus enabling targeted and risk-informed maintenance planning.
A key gap addressed by this research is the limited use of integrated probabilistic modelling techniques, such as Bayesian Networks, for quantifying component-level impact in mining environments using real-world data. While past studies have explored failure rates or MTBF-based rankings, few have attempted to explicitly model the conditional relationship between equipment states and system-level outcomes using downtime as a stochastic input. Additionally, there is a lack of structured methodologies that bridge data preprocessing, statistical distribution fitting, and probabilistic inference across multiple platforms. This paper addresses that gap by demonstrating a full implementation across Excel, R, and Netica to construct, simulate, and analyse the BN model. The proposed methodology not only highlights how downtime variability can be accurately modelled and simulated, but also how these simulations can inform a graphical model that supports both prediction and decision-making. The result is a more transparent, data-informed framework for prioritising critical equipment in asset-intensive industries such as mining, where downtime has direct implications for productivity and cost-efficiency.
2. Bayesian network frameworks and research gaps
Bayesian Networks (BNs) are well established for reliability and risk analysis because they combine data with expert knowledge, represent conditional dependencies explicitly, and handle missing and uncertain information more naturally than classical tools such as Fault Trees or Markov models. Foundational reviews show BNs’ advantages for dependability assessment, maintenance decision-making, and sensitivity analysis across complex engineered systems [13, 14]. In practice, BNs support posterior updating as new evidence arrives and provide transparent, graphical causal structures that are easier to communicate to non-specialists than purely algebraic models – an important consideration for operations and maintenance teams [15]. These properties align with our study’s need to fuse imperfect operational records with domain knowledge and to map criticality in a way that is interpretable for practitioners. Within mining and adjacent heavy industries, recent applications illustrate the method’s relevance. Rahimdel [16] demonstrates a BN/DBN approach for fleet reliability of heavy-duty mining trucks, integrating fault-tree knowledge with BN inference to identify critical subsystems and guide maintenance actions [16]. These domain results are consistent with the broader dependability literature, which positions BNs as a flexible backbone for reliability modelling, expert elicitation, and “what-if” reasoning under sparse data [13, 14]. From an implementation standpoint, mature open-source toolchains (e.g., bnlearn in R) provide end-to-end capability for structure learning, parameter estimation, and inference – supporting academic reproducibility and portability to enterprise environments [17]. Collectively, this evidence justifies our choice of BNs over alternatives for criticality mapping in data-constrained mining contexts.
The BN approach has been applied in coal mining to help mitigate business uncertainties, which have grown in response to increasing energy demands and evolving carbon regulations [18]. Limited research exists on modelling this uncertainty. Using a BN approach, key factors such as coal reserve depletion, transportation constraints, and policy ambiguity were identified. This assisted the strategic decision-making process for industry managers and policymakers. The paper [16] highlights BN modelling to analyse mining truck reliability in order to ensure a safe and efficient mineral transportation system for mining operations. A fault tree was developed using a reliability block diagram, followed by dynamic BN construction based on conditional probability analysis. Another integration of fault tree analysis with BN has been highlighted in paper [19], addressing safety risks in aerospace equipment, such as aircrafts, due to performance degradation from long-term storage. It models performance degradation under mission stress. By coupling reliability and safety, it enables dynamic risk assessment and key factor analysis, validated through a case study. Another application of BN which demonstrates a decision-focused, data-driven, and transparent framework usable by non-experts has been highlighted in the paper [20]. In this instance, BN models the Anabaena blooms in Grahamstown Dam, near Newcastle, Australia. The model learns probabilistic relationships from a structured database, linking factors like pumped nutrient load, water column nutrient concentrations, and Anabaena levels. The study highlights the integration of expert knowledge to enhance predictive accuracy and support environmental decision-making. The BN approach has also been applied in analysing the mine water inrush accidents. Mine water inrushes involve numerous unidentified or emerging risk factors due to the increasingly complex hydrogeological conditions associated with greater mining depths. This added complexity makes disaster preparedness more challenging and significantly complicates hazard assessment and emergency response efforts. Wu, et al. [21] introduces a framework that integrates Scenario Analysis methodology with BN to assess the probability of mine water inrush accidents.
While discussing criticality analysis, a study by Jun and Kim [22] proposes a BN-based approach for the fault analysis of plant equipment. A BN based fault analysis framework has been proposed to enhance plant maintenance, especially where sensor data remains underutilised. The approach integrates fault identification, inference, and sensitivity analysis, introducing two new sensitivity measures aligned with seven fault analysis objectives. Validated through a gas compressor case study using real and simulated data, the method enables proactive maintenance by interpreting large volumes of sensor data and predicting potential faults based on updated evidence. Over the years, numerous studies have explored the use of BN and Dynamic BN (DBN) in system diagnostics and fault prediction across different fields. Przytula and Thompson [23] presented a practical BN generation method, successfully applying it to diesel locomotives and satellite systems. Around the same time, Lerner, et al. [24] introduced a DBN model capable of managing both continuous and discrete variables for complex system diagnosis. Mahadevan, et al. [25] focused on structural systems, using BN to account for interdependent component failures and various failure sequences. Sahin, et al. [26] applied particle swarm optimization (PSO) techniques to build BN from large datasets and used them for condition-based maintenance of airplane engines. Their method included data preprocessing and fault probability estimation. Huang, et al. [27] designed a BN model for vehicle system diagnostics, supporting both single and multiple fault symptoms. Cai, et al. [28] extended BN methods to predict failures and benchmarked their approach using helicopter systems. Lampis and Andrews [29] explored BN use in water tank systems by enhancing traditional fault tree analysis. Liu, et al. [30] built a BN model with fault and symptom layers for diagnosing issues in chemical reactors. They trained the model using expert knowledge and statistical methods, and simplified the inference process using a Monte Carlo approach. Xu [31] developed a generalized three-layer BN model incorporating expert insights, machine conditions, and symptom data to assess rotating machinery faults. Zhao, et al. [32] created a diagnostic system for chillers using a DBN structure that replicated expert reasoning. More recently, [33] introduced a data-driven BN model for failure prediction, applying a divide-and-conquer strategy to handle uncertainty in complex systems.
BN have become a widely used approach for reliability assessment in engineering, attracting significant research attention and yielding numerous valuable contributions. The study by Wang, et al. [34] provides a comprehensive review of the BN methodologies applied to reliability assessment within the past two decades, with particular emphasis on integrating traditional approaches with modern analytical techniques. The review focuses on engineering structures commonly assessed for reliability, including bridges, underground facilities, buildings, and offshore structures—areas that broadly represent the current landscape of research in this field. Additionally, the study outlines the typical steps involved in applying BN to reliability assessment and highlights key challenges and ongoing issues faced in their implementation. In the broader body of research on BN, much of the focus has traditionally been on learning and inference algorithms. However, a review of 200 selected publications by Weber, et al. [14] reveals a growing number of studies applying BN in the areas of dependability, risk assessment, and maintenance. This trend highlights the increasing attention BNs are receiving from both the scientific community and industry. Among these studies, 61 % are centered on dependability, 26 % address risk analysis, and the remaining 13 % focus on maintenance-related applications.
The reviewed literature clearly demonstrates that BN have emerged as a versatile and powerful tool across various domains, including mining, aerospace, environmental science, and industrial maintenance. Their ability to model uncertainty, integrate expert knowledge with data, and provide intuitive, visual decision support frameworks makes them particularly suitable for applications that seek to further understand factors that critically influence the delivery of desired system outputs. Numerous studies have explored BN for fault diagnosis, failure prediction, and system-level reliability modelling – each highlighting the strengths of BN in handling incomplete, uncertain, and evolving data. Despite these advancements, a noticeable research gap persists in applications that seek to integrate criticality analysis with real-time and underutilized data, particularly for maintenance decision-making in complex industrial systems. While sensitivity analysis and probabilistic inference are being increasingly utilized, few studies have fully leveraged network-based criticality mapping to connect system output with business objectives at the subsystem level. Additionally, there is limited research that explores interactive and data-driven BN frameworks capable of reflecting interdependencies within complex equipment network using downtime or performance data as a primary parameter.
This study aims to address these gaps by proposing a network-based criticality analysis framework rooted in BN methodology. By focusing on downtime as a primary indicator, the approach offers a foundation for more detailed and layered reliability assessments in later stages. Ultimately, this contributes a novel direction in the literature – bridging theoretical advancements in BN with practical, data-oriented solutions to support strategic maintenance decisions.
3. Data acquisition
The work presented in the paper describes a novel case study based on data from a gold mining company in Australia. The name of the mining company has been withheld to maintain confidentiality. The industry failure data was collected from two different sources, one providing maintenance work order information and another providing downtime information. These were labelled ‘Selective work orders.xlsx’ and ‘Downtime.xlsx’ respectively. The raw data was recorded manually over different periods for different systems, downloaded in comma-separated value (CSV) format, and was initially analysed in MS Excel. Through this process, a new dataset was created which was largely tailored to this undertaking. Initial exploratory analysis was completed using data from the ‘Downtime.xlsx’ client spreadsheet. The major focus was on extracting variables like failure modes, downtime associated with those failure modes and finally the downtime cost associated with each failure mode. As the industry manually records the data, it was difficult to find consistency in the data across the time frames as highlighted in Table 1.
Table 1Data summary
System | Time Stamp |
Mill | January 2021 – October 2021 |
Crusher 1 | July 2021 – April 2022 |
Modular Crusher | January 2021 – April 2022 |
Nolans Crusher | January 2021 – April 2022 |
The downtime history of individual systems is presented in the Fig. 2 with its annual downtime bifurcation. The identified critical system based on downtime from Table 1 is Modular Crusher as highlighted in Fig. 2. The bar chart highlights the downtime history of the systems distributed over two consecutive years. The data table in Fig. 2 helps to understand this distribution. As the data was not recorded evenly for both the years, it was difficult to determine the annual performance of each system and/or whether business objectives were met. But focusing on the purpose of identifying the critical system, based on the total downtime, Modular crusher was the system with maximum downtime. Hence it was further analysed on the equipment level to identify the critical equipment.
Table 2 summarises the variety of failure modes within the 2021/22 dataset associated with the Modular Crusher system.
Some commonly observed failure modes were blockage of jaws, damaged belt, bogged conveyor, bearing failure, liners/bolts failure, oil and lubrication issues, chute issues, electrical issues, etc. However, ‘Total Circuit’ does not resemble any equipment but rather it was a qualitative choice made by the operator to record a downtime event. For instance, if a conveyor bearing fails and interrupts the entire circuit, some operators recorded this as a ‘Total Circuit’ failure. From an asset criticality perspective, some of the ‘Total Circuit’ records were re-assigned correctly (i.e. the above was captured as a ‘conveyor’ failure). For instances where ‘Total Circuit’ entries were not classifiable due to description ambiguity, they were omitted from the dataset. Some of the undefined failure modes were listed under ‘others’, and were omitted as they could not be processed.
Fig. 2Analysis of system downtime
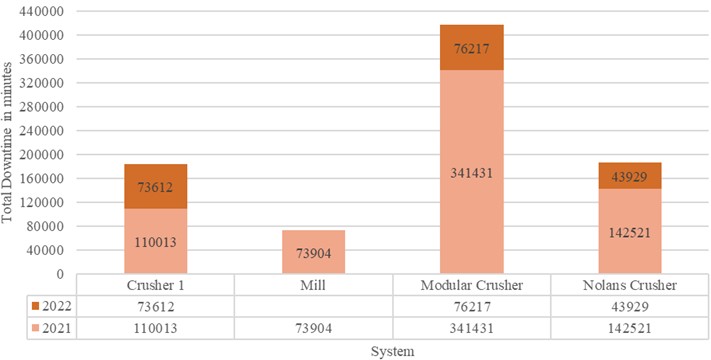
Table 2Failure modes of all the equipment associated within the critical system
Critical system | Equipment | Failure modes |
Modular Crusher | Crusher | Blocked Jaw |
Grizzly Bar Breakdown | ||
Electrical fault | ||
Hydraulic Leak | ||
Liners /Bolts | ||
Motor Breakdown | ||
Oil & Lubrication | ||
Bins Issue | ||
Maintenance | ||
Other | ||
CV 201 (Conveyor) | Belt damaged | |
Chute Issues | ||
Electrical fault | ||
Mechanical Fault | ||
Bins Issue | ||
Other | ||
Feeder | Blockage | |
Mechanical Fault | ||
Bins Issue | ||
Electrical Fault | ||
Maintenance | ||
Liners/Bolts | ||
Others | ||
Fines Conveyor | Belt damaged | |
Conveyor bogged | ||
Electrical Fault | ||
Truck delay | ||
Others | ||
Loader | Loader Unavailable | |
Maintenance | ||
Hydraulic leak | ||
Low Manning | ||
Others | ||
Product stacker | Conveyor bogged | |
Electrical Fault | ||
Commissioning | ||
Others | ||
Reject Stacker | Bearings failure | |
Belt damaged | ||
Blockage | ||
Conveyor bogged | ||
Electrical fault | ||
Maintenance | ||
Mechanical fault | ||
Liners/Bolts | ||
Others | ||
Rock Breaker | Hydraulic leak | |
Noise | ||
Others | ||
Screen | Bearings failure | |
Belt damaged | ||
Conveyor bogged | ||
Maintenance | ||
Electrical fault | ||
Liners/Bolts | ||
Mechanical fault | ||
Oil & Lubrication | ||
Blockage | ||
Screen mats | ||
Others | ||
Total Circuit | Belt damaged | |
Blocked Jaw | ||
Conveyor bogged | ||
Maintenance | ||
Commissioning | ||
Electrical fault | ||
Low Manning | ||
Liners/Bolts | ||
Mechanical fault | ||
Noise | ||
Screen mats | ||
Others |
The exclusion of ambiguous entries, such as ‘Total Circuit’ failures and undefined modes classified under ‘others’, may appear to risk the loss of potentially useful information. However, this decision was taken deliberately and with careful consideration to ensure the reliability and interpretability of the analysis. The ambiguous ‘Total Circuit’ entries did not provide sufficient granularity to be accurately mapped to specific subsystems or components without resorting to speculative assumptions, which would have introduced greater uncertainty into the model. Similarly, the ‘others’ category contained inconsistently defined failure descriptions that could not be reclassified in a meaningful way without introducing subjectivity. Retaining such records would have inflated or distorted failure frequencies, thereby compromising the accuracy of probability estimates within the Bayesian Network and undermining the validity of the criticality analysis. In probabilistic modelling, especially within the context of reliability engineering, data quality often holds greater importance than data quantity. Including poorly defined records can bias results more severely than their omission, leading to misleading outcomes and masking true system behaviour. Therefore, our approach prioritised maintaining a dataset that was internally consistent, classifiable, and analytically sound, even if this required excluding a small proportion of records that could not be confidently interpreted. This decision reflects a deliberate trade-off between completeness and reliability, ensuring that all data retained in the Bayesian Network contributed meaningfully to probabilistic inference without introducing unnecessary uncertainty. Overall, the omission of certain records represents a controlled and transparent methodological decision aimed at preserving model accuracy and interpretability rather than a limitation of scope.
4. System-level downtime assessment using Bayesian network (BN) framework
This study applies a BN framework to examine how downtimes at the equipment level affect overall system performance. The methodology integrates historical data interpretation, probabilistic modelling, and network-based inference, and is implemented across three platforms: Microsoft Excel, R, and Netica. Each platform serves a distinct role within the workflow and contributes to different stages of the analysis.
4.1. Data processing and parameter estimation (Excel)
The first step in the methodology involves the preparation and preliminary analysis of historical operational data using Microsoft Excel. The dataset comprises recorded downtime values for multiple equipment units within a designated critical system. For each unit, the percentage of downtime, denoted by , is calculated by dividing the observed downtime by the total operational period. To represent the variability in , the Beta distribution is selected due to its suitability for modelling continuous variables bounded between 0 and 1. The Beta distribution can take a variety of shapes depending on its parameters, making it ideal for modelling a wide range of real-world proportion data, including the skewed distributions often seen in maintenance and reliability contexts. The basic information about Beta distribution has been well explained in the paper by Johnson and Beverlin [35]. The estimation of the Beta distribution’s scale and shape parameters, alpha () and beta (), is performed using the method of moments. This approach involves equating the empirical mean and variance of the observed downtime proportions to the theoretical moments of the Beta distribution. The expressions for the mean and variance are given as:
By substituting the calculated sample mean and variance into Eq. (1) and (2), a system of equations is formed and solved to obtain estimates of and for each equipment component. These parameter estimates are subsequently used as input in the next stage of the methodology, where random samples are generated in R to simulate probabilistic representations of equipment downtimes. The simulated values serve as prior inputs for the conditional probability tables within the Bayesian Network constructed in Netica.
The estimated parameters are critical to the next phase of the methodology, where they serve as input to the R environment. In R, these values are used to generate a large number of random samples that simulate potential downtime scenarios, effectively capturing the stochastic nature of equipment performance. The resulting simulated values are then transformed into percentage format to align with the requirements of the Netica software, where they are used to populate the conditional probability tables (CPTs) of the child node. In the case study presented within this paper, each child node represents the overall output status of the modular crusher plant network. In this network, each equipment unit is represented as a probabilistic parent node contributing to the assessment of system-level reliability.
4.2. Probabilistic simulation and data preparation (R)
The second stage of the methodology focuses on generating probabilistic inputs for the child node of the Bayesian Network, based on simulation conducted in R. While the percentage of downtime for each parent node (equipment unit) is directly derived from historical data – where the “down” state is represented by the observed downtime percentage and the “available” state is its complement – the same cannot be assumed for the child node. As the equipment nodes are treated as conditionally independent due to a lack of interdependency data, there is no direct mechanism to populate the conditional probabilities of the system-level (child) node without referencing actual system performance patterns. To address this, historical operational data is used indirectly to inform the simulation of the child node’s behaviour. The previously estimated and parameters from Excel are utilised to generate random samples in R, which simulate the probabilistic downtime behaviour across a range of likely scenarios. These simulated values serve as representative inputs to define the conditional probability structure of the child node, ensuring that the resulting Bayesian Network is not solely based on expert judgment or assumptions, but anchored in empirical data.
The simulated values are scaled to represent percentages, consistent with the input format required by Netica’s conditional probability tables. These percentages reflect the likelihood of the 'down' state under the assumption of independent component behaviour. This stage ensures that the model captures the inherent uncertainty in equipment performance by providing a robust probabilistic foundation for the next step, which involves constructing the Bayesian Network in Netica and performing scenario-based reliability assessment.
4.3. Bayesian network and criticality analysis using Netica
To demonstrate the logic behind BN formulation, a simplified case is illustrated in Fig. 3, comprising three nodes – A, B, and C where both B and C depend on A. The joint probability distribution is expressed as:
Fig. 3A BN (Probabilities are not displayed)
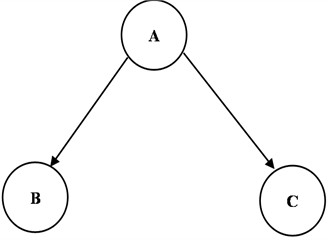
Then the joint BN distribution as given in Fig. 3 is defined as:
Extending this for nodes, nodes , the joint probability for BN is given by Eq. (4). The equation highlights that the joint probability distribution of all the variables (e.g- component downtimes) is the product of the probabilities of each variable given its parents’ values:
This formulation ensures that each variable's probability distribution is explicitly conditioned on its direct predecessors (parents) in the network structure. Such a factorisation leverages conditional independence properties and enables efficient representation and inference of complex multivariate systems. Further details of BN implementation in Netica are given in the paper [12] [36], which shows the BN model for road accident causation analyses. Generally, more complex and large analysis network models can be established and can be further expanded to a more sophisticated network by considering more relevant factors [12]. Ni, et al. [36] discuss applications of Netica that identify critical equipment from within a network of complex systems
In the final stage of the methodology, the Bayesian Network is constructed and analysed using Netica, a widely recognized software platform developed by Norsys for probabilistic reasoning and decision analysis. Netica provides an intuitive graphical interface for building Bayesian networks and offers robust computational tools for inference, belief updating, and sensitivity analysis. Its capacity to handle both qualitative network structures and quantitative probability inputs makes it particularly effective for asset reliability studies in complex industrial systems. Within the Netica environment, each equipment component in the modular crusher system is represented as an uncertain node in the Bayesian Network model, characterised by two discrete operational states: “available” and “down”. These nodes are structured as parent nodes, while the overall system output is modelled as a child node that aggregates their combined influence. To simplify the structure and enhance model tractability, the assumption of conditional independence among parent nodes is applied. This focuses the model on quantifying the individual impact of each equipment component without requiring interdependency data. The Conditional Probability Tables (CPTs) for each parent node are populated using percentage values derived from historical downtime data, representing the likelihood of each component being operational or failed. In contrast, the CPT for the child node is populated using a synthetic dataset generated in R, which reflects empirically informed probabilities of system-level failure under various parent node state combinations. Netica supports both manual and programmatic entry of CPTs and includes internal consistency checks to ensure that each row of probabilities sums to 100 %. Once the network structure is fully defined and populated, a sensitivity analysis is conducted. This involves setting each equipment node to a full downtime state (i.e., 100 % probability of failure) one at a time and recording the resulting change in the child node’s output probability. This process provides a direct and quantitative measure of each component's criticality, enabling informed prioritisation of maintenance resources. Netica’s visual interface and probabilistic engine enhance transparency and interpretability, allowing stakeholders to visualise the cascading impact of specific equipment failures on overall system performance. The outputs generated from this stage include detailed probability distributions, ranked equipment criticality, and system reliability estimates under multiple operational scenarios. Overall, this phase concludes the model implementation and delivers practical, data-driven insights to support maintenance decision-making in mining operations.
This integrated methodology supports strategic maintenance planning by providing a structured, data-driven framework for evaluating system risk due to probabilistic equipment downtime. The use of Microsoft Excel enables efficient processing and statistical characterisation of historical downtime data, forming the empirical foundation for subsequent analysis. The simulation stage in R introduces probabilistic variability, capturing the stochastic behaviour of system components and enabling the generation of realistic failure scenarios. Finally, the implementation of the Bayesian Network in Netica facilitates inference and scenario analysis by linking individual equipment behaviour to overall system performance through an interpretable and visual model. Together, these three phases bridge the gap between probabilistic reasoning and practical decision-making. In mining and other asset-intensive industries – where operational variability, environmental stresses, and data limitations challenge traditional reliability assessments. This approach provides a scalable and flexible tool. It not only accommodates current data but is adaptable to future expansions, including the integration of additional variables or hierarchical subsystems as more information becomes available.
5. Results and discussion
Table 3 presents the fundamental statistical results used to identify the criticality of the Modular Crusher within the system. The analysis was performed using the R statistical environment, which enabled precise estimation of descriptive metrics and distribution fitting. As shown in Fig. 2, the Modular Crusher recorded a total downtime of 417,648 minutes, reflecting significant operational interruptions over the observed period. The calculated mean of 0.566 indicates that downtime events occurred with moderate frequency in relation to total operational time. The variance of 0.112 suggests substantial variability in these occurrences, highlighting fluctuations in equipment reliability. To better understand the probabilistic behaviour of downtime events, a Beta distribution was fitted to the normalized downtime data using different R packages. The estimated scale and shape parameters ( 0.515, 0.673) point to a right-skewed distribution, implying that while short-duration downtimes are more common, occasional long-duration events disproportionately affect system performance. This statistical profile provides a deeper understanding of downtime behaviour and supports data-driven decision-making for targeted maintenance and reliability improvement initiatives.
Table 3Basic statistical results
System | Downtime (Minutes) | Mean | Variance | ||
Modular Crusher | 417648 | 0.566427 | 0.112278 | 0.514784 | 0.672523 |
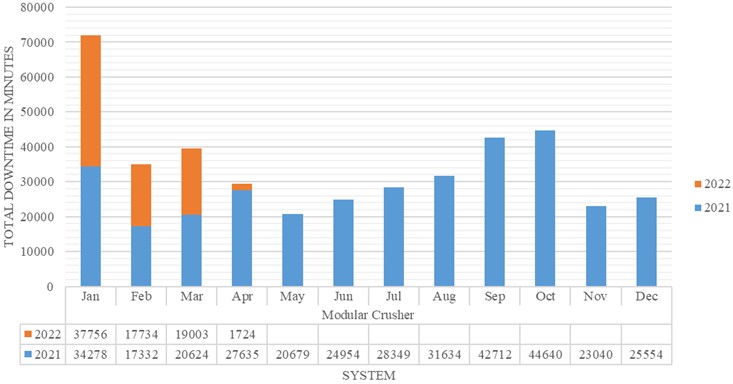
The bar chart highlighted in the Fig. 4 illustrates the monthly downtime (in minutes) of a modular crusher for the years 2021 and 2022. Each bar is stacked to show the contribution from both years, with blue representing 2021 and orange for 2022. The chart highlights significantly higher downtime in early 2022, particularly in January, while 2021 experienced more consistent downtime throughout the year. Overall, the chart helps compare operational interruptions across the two years and identify periods of peak equipment inactivity.
Fig. 4Downtime history of modular crusher
The chart in the Fig. 5 illustrates the percentage downtime of various subsystems in the Modular Crusher. Notably, the Screen, Crusher, and Feeder account for the highest downtime, with the Screen alone contributing nearly 5 %. In contrast, subsystems such as the Rock Breaker, Product Stacker, and Fines Conveyor exhibit minimal downtime. This analysis highlights critical areas – especially the Screen and Crusher – that require focused maintenance efforts to improve overall system performance.
Fig. 5Percentage downtime of individual subsystem of modular crusher
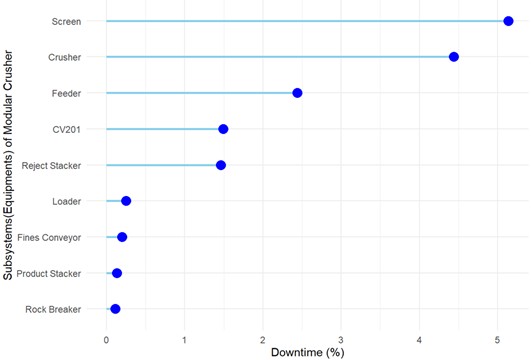
Fig. 6 and 7 illustrate two different configurations of the Bayesian Network developed to model the modular crusher system. The network includes ideally ten parent nodes which represents individual equipment components while a single child node represents the overall output status of the modular crusher system, with respect to downtime.
In Fig. 6, a node labelled “Total Circuit” was included to represent scenarios where operators logged downtime events at a high level, without specifying the exact failing component. For example, a failure in a conveyor bearing may have led to a shutdown of the entire circuit, and the downtime was broadly categorized as “Total Circuit” in the operational records. While this qualitative classification is useful from an operational reporting standpoint, it introduces ambiguity in a probabilistic model because it does not allow for precise attribution of failure to specific assets. As shown, the “Total Circuit” node contributes the highest downtime (44 %) to the system, which in turn results in a modular crusher downtime of 65.5 %. However, from an asset criticality perspective, attributing downtime to such an umbrella term is not analytically useful. A more accurate representation would have been to assign the failure to its originating asset, such as a conveyor or a feeder for instance.
To improve the diagnostic value and precision of the Bayesian Network, Fig. 7 presents a refined model where the uncertain “Total Circuit” node was removed. In this configuration, the ‘Screen’ provided the highest specified component-level downtime (5.14 %) and therefore as the critical equipment. Notably, this adjustment results in a modular crusher downtime of 80.3 %, even though the Screen's individual downtime is significantly lower than that of the original “Total Circuit” node. This counterintuitive outcome reinforces the importance of network structure and probabilistic interdependencies in Bayesian modelling. It also highlights how the ‘Screen’ node exerts a disproportionately high influence on the system’s output, making it a key candidate for maintenance optimisation.
Together, Fig. 6 and 7 demonstrate how refining node structure and removing qualitative ambiguities from the network can significantly enhance the model’s reliability for decision-making and asset criticality mapping.
Fig. 6Criticality mapping 1
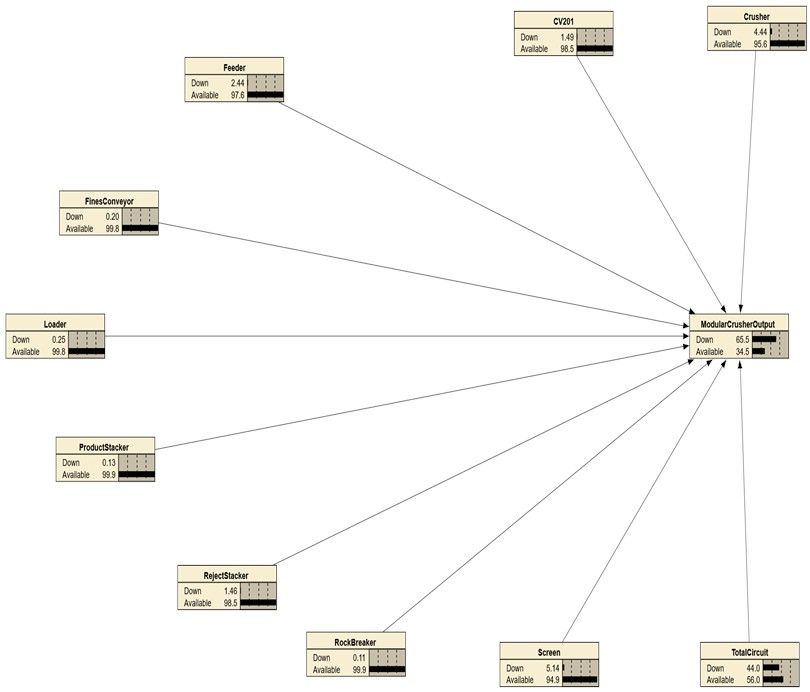
Table 4 illustrates the impact of modifying critical equipment configurations on the overall system performance, specifically focusing on the downtime affecting the modular crusher's output. It compares two criticality mapping scenarios. In Criticality Mapping 1, the “Total Circuit” is treated as critical, resulting in a downtime of 44 % and a corresponding modular crusher downtime of 65.5 %. In contrast, Criticality Mapping 2 identifies the ‘Screen’ subsystem as the critical equipment after the removal of “Total Circuit” node from the network. Although the “Screen” accounts for only 5.14 % of downtime, it causes a disproportionately high modular crusher downtime of 80.3 %. This outcome analysis underscores that some components, despite relatively low downtime, can significantly impact production output due to their position and functional dependencies within the system. Such insights are crucial for making technically sound decisions, as they enable targeted maintenance planning, effective resource allocation, and informed operational strategies that focus on components with the greatest influence on system performance.
Table 4Impact of change of critical equipment
Network | Critical equipment | Percentage of downtime | Modular crusher output (Downtime) |
Criticality Mapping 1 | Total Circuit | 44 % | 65.5 % |
Criticality Mapping 2 | Screen | 5.14 % | 80.3 % |
In a BN, sensitivity analysis helps to understand the influence of multiple causes (node states) on the final output result (target node). Also, it helps in identifying and reducing the elementary events, which contribute relatively more towards the probabilities of the consequential events by taking effective measures [12]. Sensitivity analyses are crucial to examine the impact of uncertainties. Table 5 shows the sensitivity analysis results done in the Netica software.
Fig. 7Criticality mapping 2
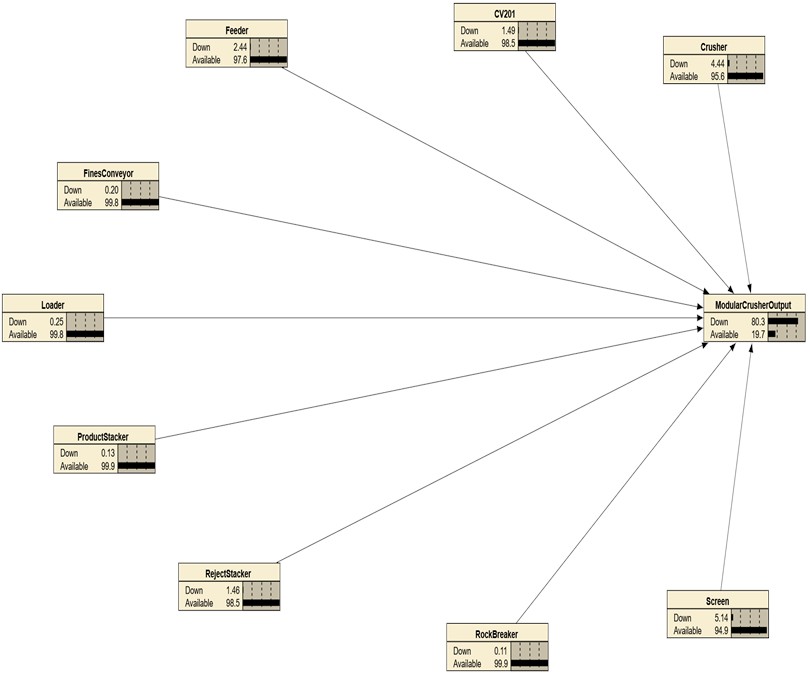
Table 5Sensitivity analysis results in Netica
Subsystem | Downtime (%) | Mutual info | Sensitivity in percent | Variance of beliefs |
Feeder | 2.44 | 0.02822 | 3.94 | 0.0083467 |
Crusher | 4.44 | 0.01601 | 2.24 | 0.0044021 |
Reject Stacker | 1.46 | 0.01457 | 2.04 | 0.0043146 |
Screen | 5.14 | 0.00553 | 0.773 | 0.0009580 |
Loader | 0.25 | 0.00230 | 0.321 | 0.0006817 |
Rock Breaker | 0.11 | 0.00078 | 0.109 | 0.0002288 |
CV201 | 1.49 | 0.00055 | 0.0765 | 0.0001054 |
Fines Conveyor | 0.20 | 0.00010 | 0.0142 | 0.0000190 |
Product Stacker | 0.13 | 0.00000 | 0.0000616 | 0.0000001 |
Sensitivity analysis in Netica software was conducted following a structured procedure. First, the Bayesian Network representing the equipment subsystem interactions was fully established. The sensitivity analysis function available in Netica was then activated for the target node (i.e., modular crusher output), which automatically computes key sensitivity metrics – Mutual Information, Sensitivity in Percent, and Variance of Beliefs – for each subsystem node. The software systematically varied the probabilities (belief states) of individual subsystem nodes to evaluate their impact on the target node's outcomes. This process identified how fluctuations in subsystem probabilities propagated through the network, influencing the overall system-level uncertainty. The output, summarized in Table 5, clearly delineates each subsystem’s relative influence based on calculated metrics. This systematic evaluation highlights critical subsystems that significantly affect the system performance, thus identifying target subsystem/s for maintenance and/or operational improvement.
Downtime percentage simply reflects how long a component is non-operational relative to others. However, in a BN framework, sensitivity analysis goes beyond time-based failure and evaluates how a change in the belief (probability) of a component affects a system-level outcome – such as the modular crusher’s output. Thus, a component might experience frequent or prolonged failures (high downtime), yet have limited influence on the system’s overall behaviour. This explains why components like the “Screen”, despite having the highest downtime (5.14 %), demonstrate relatively low sensitivity (0.773 %) and mutual information (0.00553). In contrast, the Feeder subsystem, though not having the highest downtime, registers the highest mutual information (0.02822) and sensitivity (3.94 %). This indicates that indicating it has a stronger effect on reducing uncertainty and influencing the modular crusher system performance. This insight highlights that system-criticality cannot be determined by downtime alone.
Mutual Information quantifies how much a subsystem contributes to reducing uncertainty in the output, while Sensitivity in Percent reflects how changes in the node affect the system’s predictions. Meanwhile, the Variance of Beliefs shows how responsive a node's probability distribution is to changes elsewhere in the network. The “Feeder”, again, shows the highest variance (0.0083), suggesting a strong, dynamic interaction with the rest of the system. Conversely, components like the “Product Stacker” show near-zero values across all three measures – implying minimal impact on system behaviour despite their presence.
Together, these metrics offer a nuanced view of subsystem criticality. Components with high downtime may not warrant top maintenance priority if their influence on the system is marginal. Instead, by integrating sensitivity analysis metrics, maintenance planning can be more targeted, data-driven, and aligned with actual system dynamics, improving both performance and operational efficiency. However, the reliability of such analytical outcomes ultimately depends on the quality and consistency of the underlying operational data. As with many industrial applications, the integrity of recorded information plays a crucial role in shaping model accuracy and interpretability, making it essential to acknowledge the practical data constraints encountered in this study. Mining operations, particularly those still developing digital maturity, often depend on manually recorded logs, operator notes, and non-standardised reporting systems. While this introduces variability and inconsistency, it also reflects the realistic data environment within which maintenance decisions are made. By working with such data, this study demonstrates that risk-based modelling approaches such as Bayesian Networks can still produce meaningful insights despite imperfections in input quality. Manual logs, though inconsistent, remain the primary and authoritative source of downtime information at the case study site and therefore provide an authentic representation of operational conditions rather than an idealized dataset. To mitigate potential bias, rigorous data preprocessing was undertaken, including standardising terminology, reassigning “Total Circuit” failures to specific subsystems where possible, and removing duplicate or ambiguous records to ensure internal consistency suitable for probabilistic modelling. The Bayesian Network framework is particularly resilient in handling incomplete or uncertain data, as it propagates probabilities instead of deterministic outcomes, allowing uncertainty to be explicitly represented in the results. While reliance on manually recorded data is recognised as a structural limitation, it does not undermine the statistical validity of the findings but may constrain their generalisability. Future research should integrate digitally captured sensor data, automated downtime tracking, and data validation frameworks, such as Bayesian data fusion and outlier detection, to improve accuracy and reduce uncertainty. Overall, this limitation reflects the practical realities of mining operations rather than a methodological weakness, and the framework presented here offers a pragmatic pathway for transitioning from manual data dependence to more reliable, digitally integrated maintenance systems.
6. Conclusions
In asset management, making informed maintenance decisions is essential for meeting business objectives and ensuring long-term system performance. Many industries rely on various analytical tools and models to support this decision-making process, aiming to continuously improve risk and cost profiles and reduce downtime.
However, even with advanced tools in place, selecting the right maintenance strategy remains a challenge – especially when the root cause of equipment failure is not clearly understood. While available technologies offer valuable insights, there's still a noticeable gap: the lack of a unified, objective approach that integrates multiple factors to guide strategic planning. This study addresses that gap by proposing a BN-based criticality analysis framework. Unlike traditional models that often focus narrowly on isolated equipment failures, this approach provides a broader system-level view. It considers how individual equipment can influence the final output of the system, offering a clearer picture of how failures can ripple through a network and affect key business outcomes. By mapping influences at equipment or subsystem level, this method supports practical decision-making and helps prioritise maintenance tasks based on system-wide impact rather than just local performance metrics.
One of the strengths of this work is its use of mutual information and belief variance as tools to measure criticality. These indicators offer a fresh perspective by showing that the most visibly critical equipment in terms of downtime is not always the most sensitive when it comes to system behaviour. This insight is especially useful for maintenance teams, as it shifts the focus from only reacting to failures to understanding which parts of the system have the most influence on future performance. Compared to earlier studies, which mostly concentrated on diagnostic methods using BN or Dynamic BN for individual fault detection, this research introduces a more holistic, decision-oriented model. Instead of just identifying faults, the goal here is to support long-term planning by recognising which failure modes deserve attention based on their role in the broader system. This perspective is relatively underexplored in literature and adds a new layer to maintenance analytics.
That said, the study did face limitations, particularly in terms of data quality. The failure records from the industrial case were inconsistently maintained, which led to certain assumptions being made during model development. As a result, some aspects – such as the detailed interdependencies between network nodes – could not be fully captured. The method would benefit significantly from cleaner, more structured datasets, allowing for a deeper analysis of how failures in one part of the system might influence others.
For this research, the focus was intentionally kept on downtime as the key parameter. While this simplifies the model and helps build a solid foundation, a full criticality analysis should also include failure rates and consequence factors such as cost or safety impact. These additional elements will be included in the next stage of this research. In that upcoming phase, the study will revisit the identified critical systems and perform a more detailed failure mode-level analysis, providing an even clearer understanding of risk and reliability. Overall, this work introduces a practical and scalable method for maintenance planning, that is particularly useful when working with incomplete or noisy data. It emphasises the importance of understanding system behaviour through network modelling and highlights how a shift from isolated analysis to interrelated thinking can improve decision-making. By doing so, it makes a meaningful contribution to the growing body of literature on data-driven maintenance strategies and paves the way for more robust, insight-driven asset management practices.
References
-
M. Friendly, “A brief history of data visualization,” in Handbook of Data Visualization, Berlin, Heidelberg: Springer Berlin Heidelberg, 2008, pp. 15–56, https://doi.org/10.1007/978-3-540-33037-0_2
-
J. Baker, D. Jones, and J. Burkman, “Using visual representations of data to enhance sensemaking in data exploration tasks,” Journal of the Association for Information Systems, Vol. 10, No. 7, pp. 533–559, Jul. 2009, https://doi.org/10.17705/1jais.00204
-
M. Sadiku, A. E. Shadare, S. M. Musa, C. M. Akujuobi, and R. Perry, International Journal of Engineering Research and Advanced Technology (IJERAT). Boston, MA: Springer US, 2003, pp. 11–16, https://doi.org/10.1007/978-1-4615-1177-9
-
K. S. Umadevi and D. Geraldine Bessie Amali, “Data visualization and analysis for air quality monitoring using IBM Watson IoT platform,” Data Visualization, pp. 15–32, Mar. 2020, https://doi.org/10.1007/978-981-15-2282-6_2
-
C. Parra and A. C. Marquez, “Criticality analysis methods: based on the risk assessment process,” IngeCon, Technical Report, Jan. 2020, https://doi.org/10.13140/rg.2.2.25392.17926
-
A. Sadavare and R. Kulkarni, “A review of application of graph theory for network,” International Journal of Computer Science and Information Technologies, Vol. 3, No. 6, pp. 5296–5300, 2012.
-
P. Zhang and G. Chartrand, Introduction to Graph Theory. Tata McGraw-Hill, 2006.
-
T. A. Stephenson, “An introduction to Bayesian network theory and usage,” IDIAP, 2000.
-
S. Nadkarni and P. P. Shenoy, “A causal mapping approach to constructing Bayesian networks,” Decision Support Systems, Vol. 38, No. 2, pp. 259–281, Nov. 2004, https://doi.org/10.1016/s0167-9236(03)00095-2
-
J. Pearl, M. Glymour, and N. P. Jewell, Causal Inference in Statistics: a Primer. John Wiley & Sons, 2016.
-
K. Murphy, “The bayes net toolbox for Matlab,” Computing Science and Statistics, Vol. 33, No. 2, pp. 1024–1034, 2001.
-
X. Zou and W. L. Yue, “A Bayesian network approach to causation analysis of road accidents using Netica,” Journal of Advanced Transportation, Vol. 2017, pp. 1–18, Jan. 2017, https://doi.org/10.1155/2017/2525481
-
H. Langseth and L. Portinale, “Bayesian networks in reliability,” Reliability Engineering and System Safety, Vol. 92, No. 1, pp. 92–108, Jan. 2007, https://doi.org/10.1016/j.ress.2005.11.037
-
P. Weber, G. Medina-Oliva, C. Simon, and B. Iung, “Overview on Bayesian networks applications for dependability, risk analysis and maintenance areas,” Engineering Applications of Artificial Intelligence, Vol. 25, No. 4, pp. 671–682, Jun. 2012, https://doi.org/10.1016/j.engappai.2010.06.002
-
N. Fenton and M. Neil, Risk Assessment and Decision Analysis with Bayesian Networks. CRC Press, 2012, https://doi.org/10.1201/9780367803018
-
M. J. Rahimdel, “Bayesian network approach for reliability analysis of mining trucks,” Scientific Reports, Vol. 14, No. 1, p. 3415, Feb. 2024, https://doi.org/10.1038/s41598-024-52694-0
-
M. Scutari, “Learning Bayesian networks with the bnlearn R package,” Journal of Statistical Software, Vol. 35, pp. 1–22, 2010.
-
F. R. Fidry, I. Vanany, and J. D. T. Purnomo, “A Bayesian network for business uncertainties in coal mining industry,” Journal of Sustainable Mining, Vol. 24, No. 2, pp. 175–188, Jan. 2025, https://doi.org/10.46873/2300-3960.1448
-
B. Zhang, X. Wang, J. Liu, and X. Gao, “Aerospace equipment safety evaluation and key factor analysis method considering performance degradation,” in 3rd International Symposium on Aerospace Engineering and Systems (ISAES), pp. 474–478, Mar. 2024, https://doi.org/10.1109/isaes61964.2024.10751612
-
B. J. Williams and B. Cole, “Mining monitored data for decision-making with a Bayesian network model,” Ecological Modelling, Vol. 249, pp. 26–36, Jan. 2013, https://doi.org/10.1016/j.ecolmodel.2012.07.008
-
J. Wu, S. Xu, R. Zhou, and Y. Qin, “Scenario analysis of mine water inrush hazard using Bayesian networks,” Safety Science, Vol. 89, pp. 231–239, Nov. 2016, https://doi.org/10.1016/j.ssci.2016.06.013
-
H.-B. Jun and D. Kim, “A Bayesian network-based approach for fault analysis,” Expert Systems with Applications, Vol. 81, pp. 332–348, Sep. 2017, https://doi.org/10.1016/j.eswa.2017.03.056
-
K. W. Przytula and D. Thompson, “Construction of Bayesian networks for diagnostics,” in IEEE Aerospace Conference Proceedings, Vol. 5, pp. 193–200, Nov. 2025, https://doi.org/10.1109/aero.2000.878490
-
U. Lerner, R. Parr, D. Koller, and G. Biswas, “Bayesian fault detection and diagnosis in dynamic systems,” in AAAI Conference on Artificial Intelligence, 2000.
-
S. Mahadevan, R. Zhang, and N. Smith, “Bayesian networks for system reliability reassessment,” Structural Safety, Vol. 23, No. 3, pp. 231–251, Jan. 2001, https://doi.org/10.1016/s0167-4730(01)00017-0
-
F. Sahin, M. Yavuz, Z. Arnavut, and Uluyol, “Fault diagnosis for airplane engines using Bayesian networks and distributed particle swarm optimization,” Parallel Computing, Vol. 33, No. 2, pp. 124–143, Mar. 2007, https://doi.org/10.1016/j.parco.2006.11.005
-
Y. Huang, R. Mcmurran, G. Dhadyalla, and R. Peter Jones, “Probability based vehicle fault diagnosis: Bayesian network method,” Journal of Intelligent Manufacturing, Vol. 19, No. 3, pp. 301–311, Jan. 2008, https://doi.org/10.1007/s10845-008-0083-7
-
Z. Cai, S. Sun, S. Si, and N. Wang, “Research of failure prediction Bayesian network model,” in 16th International Conference on Industrial Engineering and Engineering Management, pp. 2021–2025, Oct. 2009, https://doi.org/10.1109/icieem.2009.5344265
-
M. Lampis and J. D. Andrews, “Bayesian belief networks for system fault diagnostics,” Quality and Reliability Engineering International, Vol. 25, No. 4, pp. 409–426, Nov. 2008, https://doi.org/10.1002/qre.978
-
H. Liu, J.-C. Buvat, L. Estel, and I. Polaert, “Bayesian network method for fault diagnosis in a continuous tubular reactor,” Chemical Product and Process Modeling, Vol. 5, No. 1, Sep. 2010, https://doi.org/10.2202/1934-2659.1491
-
B. G. Xu, “Intelligent fault inference for rotating flexible rotors using Bayesian belief network,” Expert Systems with Applications, Vol. 39, No. 1, pp. 816–822, Jan. 2012, https://doi.org/10.1016/j.eswa.2011.07.079
-
Y. Zhao, F. Xiao, and S. Wang, “An intelligent chiller fault detection and diagnosis methodology using Bayesian belief network,” Energy and Buildings, Vol. 57, pp. 278–288, Feb. 2013, https://doi.org/10.1016/j.enbuild.2012.11.007
-
Z. Cai, W. Si, S. Si, and S. Sun, “Modeling of failure prediction Bayesian network with divide‐and‐conquer principle,” Mathematical Problems in Engineering, Vol. 2014, No. 1, p. 21071, May 2014, https://doi.org/10.1155/2014/210714
-
Q.-A. Wang et al., “Application of Bayesian networks in reliability assessment: A systematic literature review,” Structures, Vol. 71, p. 108098, Jan. 2025, https://doi.org/10.1016/j.istruc.2024.108098
-
P. Johnson and M. Beverlin, “Beta Distribution,” in The Concise Encyclopedia of Statistics, New York, NY: Springer New York, 2024, pp. 40–40, https://doi.org/10.1007/978-0-387-32833-1_29
-
Z. Ni, L. D. Phillips, and G. B. Hanna, “Exploring Bayesian belief networks using Netica®,” in Evidence Synthesis in Healthcare, London: Springer London, 2011, pp. 293–318, https://doi.org/10.1007/978-0-85729-206-3_12
About this article

This study is supported by the engineering department of James Cook University, Australia and Rockfield Technologies Australia Pty Ltd.
The datasets generated during and/or analyzed during the current study are available from the corresponding author on reasonable request.
Sagar More: Writing: original draft preparation, conceptualization, formal analysis, methodology, software. Rabin Tuladhar: writing – review and editing. Dr. Sourav Das: formal analysis, software. William Milne: writing – review and editing.
The authors declare that they have no conflict of interest.
