Abstract
This study presents an integrated geospatial framework for advanced monitoring and analysis of oil and gas infrastructure using satellite data, Geographic Information Systems (GIS), three-dimensional (3D) geological modeling, and artificial intelligence methods. The objective is to improve the interpretation of subsurface conditions and support better planning of exploration and infrastructure development in geologically complex areas. The proposed workflow combines satellite-derived digital elevation and multispectral data with geological and lithological information to reconstruct 3D reservoir structures and simulate subsurface fluid migration in heterogeneous permeable and semi-permeable layers. The mathematical basis of the model is Darcy’s law extended to a 3D structured grid, while image interpretation and feature recognition are supported by machine learning tools, including convolutional neural networks. The framework enables visualization of stratigraphic architecture, identification of low-permeability barriers, and detection of zones with restricted flow and abnormal pressure accumulation. The obtained results show that the integration of satellite geodata with digital modeling improves the consistency of geological interpretation, supports preliminary drilling-site screening, strengthens environmental risk awareness, and may help reduce unnecessary exploratory actions. The proposed approach may be useful for digital transformation of oil and gas monitoring workflows and for more sustainable management of subsurface resources.
1. Introduction
The rapid digital transformation of the oil and gas sector has significantly increased the role of satellite remote sensing, geospatial analytics, and computational modeling in exploration, infrastructure planning, and environmental monitoring. Compared with conventional field surveys alone, satellite-derived observations provide large-area, repetitive, and non-invasive information on terrain, land cover, surface deformation, and indirect hydrocarbon-related indicators, which makes them especially valuable in remote, environmentally sensitive, or geologically complex regions [1-7]. In oil and gas applications, such data support the identification of structural features, preliminary assessment of prospective areas, monitoring of environmentally vulnerable zones, and more informed planning of field development and related infrastructure [2], [3], [8], [9].
The analytical value of satellite observations becomes substantially higher when they are integrated with Geographic Information Systems (GIS), geological interpretation, and digital subsurface modeling. GIS-based integration enables the combination of topographic, lithological, infrastructural, and environmental layers within a unified analytical space, while three-dimensional (3D) modeling improves the representation of reservoir geometry, stratigraphic architecture, and spatial relationships between permeable and low-permeability zones [10-12]. This is particularly important for oil and gas systems, which are inherently heterogeneous and often cannot be described adequately by simplified two-dimensional or purely descriptive approaches [10], [12], [13].
Another important direction is the use of artificial intelligence and machine learning methods for geospatial data interpretation. Image classification, feature extraction, anomaly detection, and recognition of subtle spatial patterns can be improved through data-driven methods, including convolutional neural networks and related machine learning techniques [14], [15]. In petroleum and environmental monitoring tasks, these tools support the interpretation of multispectral, hyperspectral, and radar data, accelerate analytical workflows, and reduce dependence on purely manual expert screening [3], [4], [14], [15]. However, the practical usefulness of such methods depends on whether they are embedded in a coherent and reproducible workflow rather than presented as isolated digital tools.
Open satellite products, including Landsat and Sentinel missions, have considerably expanded access to Earth observation data for applied geoscience tasks [16], [17]. At the same time, satellite-based analysis alone has important limitations associated with atmospheric effects, vegetation masking, spatial resolution constraints, and the indirect nature of many surface indicators [1], [4], [5]. For this reason, satellite-derived observations should be interpreted together with geological context, GIS-based spatial analysis, and physically meaningful subsurface modeling in order to produce technically reliable results [2], [10], [18], [19].
In this context, the present study focuses on the integrated use of satellite geodata, GIS, 3D geological reconstruction, and computational methods for oil and gas infrastructure tasks. The objective of the study is to develop a unified geospatial workflow that combines satellite-derived spatial information with digital subsurface representation in order to improve geological interpretation, identify zones of constrained fluid migration, and support better planning of exploration and infrastructure-related decisions. The growing role of computational modeling in engineering analysis further supports the relevance of structured digital simulation approaches for complex infrastructure-related systems [20]. The novelty of the study lies not in the isolated use of satellite data, GIS, artificial intelligence, or 3D modeling as separate instruments, but in their methodological integration within a single analytical framework oriented toward oil and gas applications. The main contributions of this work are as follows. First, an integrated workflow for combining satellite imagery, GIS layers, and geological information is formulated. Second, a 3D subsurface representation based on permeable and semi-permeable layers is applied to analyze filtration behavior and potential flow barriers. Third, the study demonstrates the practical analytical value of this combined framework for more consistent geological interpretation and more environmentally responsible planning in oil and gas infrastructure tasks [2], [8-10], [13], [18], [19].
2. Methodology
2.1. Study area
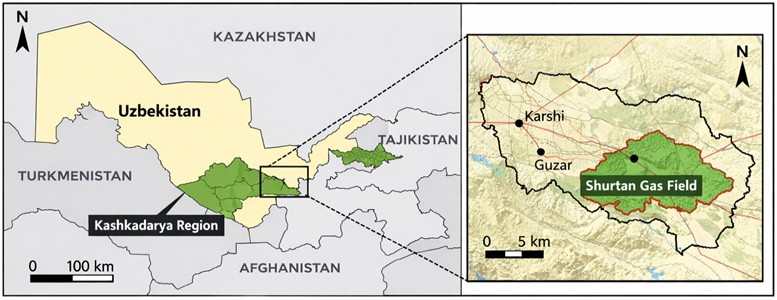
The study area was defined as the Kashkadarya region of Uzbekistan. Kashkadarya is one of the hydrocarbon-oriented regions of Uzbekistan and is therefore an appropriate case for evaluating an integrated framework based on satellite geodata, GIS analysis, three-dimensional geological reconstruction, and computational modeling for oil and gas infrastructure tasks.
From the geological point of view, the study area is considered as a structurally heterogeneous subsurface system composed of interconnected aquifer and hydrocarbon-bearing layers partly isolated by low-permeability barriers, such as clay- and silt-rich strata. This type of configuration is suitable for analyzing restricted fluid migration, local pressure accumulation, and the influence of semi-permeable barriers on subsurface flow behavior. In the context of digital oil and gas planning, such a regional case provides a meaningful basis for combining surface geospatial observations with a simplified but physically interpretable subsurface representation [2], [10], [12], [13].
In the present article, the Kashkadarya case is treated as a regional demonstration area used to evaluate the coherence of the proposed integrated workflow rather than as a fully field-calibrated reservoir simulation case.
For clarity, Fig. 1 shows the regional position of the Kashkadarya region within Uzbekistan and the extent of the analyzed local subarea used in the present study. In this work, Kashkadarya is treated as the broader regional case for evaluating the proposed integrated workflow, whereas the Shurtan gas field is used as the local example for the satellite-based spatial interpretation presented in the Results section.
Fig. 1Location of the study area in Uzbekistan and extent of the analyzed local subarea in the Kashkadarya region: regional location of Kashkadarya within Uzbekistan (left); local demonstration area used for the integrated geospatial analysis (right). Base map prepared by the authors using administrative boundary data and Sentinel-2 imagery, spatial resolution 10 m
2.2. Data sources
The methodological framework was based on the integration of open-access satellite, terrain, and geological information. The manuscript uses MODIS, Landsat, and Sentinel-2 data as the main satellite sources for the structural and surface-oriented representation of oil and gas fields. Landsat-8 OLI and Sentinel-2 were treated as the principal multispectral sources for geological interpretation due to their wide adoption in environmental and geoscientific applications, while MODIS was included as a large-area, high-temporal-coverage source [5-7], [16], [17].
In addition to satellite imagery, digital elevation models (DEMs) were used to describe terrain morphology and support the interpretation of structural features and possible fluid migration controls. The geospatial inputs were complemented by field lithological information, which was incorporated to reconstruct the architecture of aquifer and hydrocarbon-bearing layers. The manuscript also states that the applied data resources included the NASA Earthdata portal and the ESA Copernicus Open Access Hub, which ensured access to current and reliable Earth observation datasets.
The integrated dataset therefore included the following components: multispectral imagery from MODIS, Landsat, and Sentinel-2; DEM-derived terrain information; interpreted geological and lithological information; and geospatial layers used for GIS-based integration and 3D visualization [2], [13], [16], [17], [19]. The main characteristics of the satellite datasets used in the study are summarized in Table 1.
Table 1Main characteristics of the satellite datasets used in the study
Parameter | MODIS (Terra/Aqua) | Landsat-8 OLI | Sentinel-2 (A/B) |
Launch year | Terra – 1999Aqua – 2002 | 2013 | Sentinel-2 A-2015 Sentinel-2 B-2017 |
Operating agency | NASA | NASA / USGS | ESA (European Space Agency) |
Number of spectral bands | 36 | 11 bands + 2 panchromatic (TIRS included) | 13 spectral bands |
Wavelength range | 0.4-14.4 µm | 0.43-12.5 µm | 0.443-2.190 µm |
Spatial resolution | 250 m (2 bands) 500 m (5 bands)1 km (29 bands) | 15 m (pan), 30 m (VNIR & SWIR), 100 m (TIRS) | 10 m, 20 m, 60 m (depending on the band) |
Revisit frequency | Every 1–2 days (global coverage) | Every 16 days (single satellite) | Every 5 days (with both A & B satellites) |
Main application areas | Global climate, vegetation, water monitoring | Land cover, agriculture, geology, mapping | Agriculture, forestry, water, disaster and climate monitoring |
Key advantages | High temporal resolution, wide coverage | High spatial accuracy, long historical archive | High revisit rate, detailed spectral information, free open access |
Source: compiled by the authors based on official mission documentation and open-access user handbooks for MODIS, Landsat 8, and Sentinel-2 | |||
2.3. Geospatial preprocessing and GIS integration
All spatial datasets were harmonized within a GIS-oriented environment. The manuscript explicitly refers to ArcGIS, ERDAS Imagine, ENVI, and Google Earth Engine as the main software environments used for interpretation and integration of satellite observations. In the revised methodological formulation, GIS is considered not as a simple overlay tool, but as a data-fusion environment that enables joint analysis of topographic, lithological, environmental, and infrastructure-related layers [2], [10], [11].
At this stage, satellite imagery was interpreted together with DEM-derived terrain attributes and geological information to improve structural understanding of the study area. Multispectral products, including NDVI-related and thermal-band information, were used to detect spatial patterns relevant to geological interpretation, while terrain descriptors were used to support the identification of surface morphology and structurally controlled zones. Radar interferometry is also mentioned in the manuscript as an auxiliary method for spatial interpretation, especially in the context of deformation-oriented geospatial analysis [18], [19].
The purpose of this stage was to prepare an internally consistent geospatial base for subsequent subsurface reconstruction. Through GIS-based integration, surface observations and geological assumptions could be linked within a single analytical space, making it possible to proceed from satellite interpretation to physically meaningful 3D modeling [2], [8], [10], [18].
2.4. Three-dimensional geological reconstruction
The next stage of the workflow consisted of constructing a three-dimensional representation of the subsurface. In the manuscript, the formulated model uses DEMs, multispectral satellite imagery, including NDVI and thermal bands, and field lithological information to recreate the structure of aquifer and hydrocarbon-related layers. The modeled system is described as a set of linked aquifers partly isolated by low-permeability barriers, such as clay or silt strata, which is consistent with the intended analysis of constrained flow and pressure redistribution [10], [12], [13].
Each geological stratum was represented digitally within a structured model space. In this representation, the subsurface is discretized into units characterized by properties such as permeability, pressure, and porosity. The explicit inclusion of heterogeneity is essential because fluid movement in hydrocarbon-bearing systems is strongly affected by spatial contrasts in permeability and by the presence of semi-permeable barriers. This representation was used to improve the realism of subsurface interpretation and to support subsequent simulation of filtration behavior [10-12].
Three-dimensional visualization was performed using Python-based tools, specifically PyVista and Matplotlib, as stated in the manuscript. Such visualization improves the interpretability of geological architecture and allows geoscientists and engineers to inspect reservoir geometry, structural continuity, and potentially hydrocarbon-relevant zones in an intuitive and reproducible form [11], [21].
2.5. Mathematical model of subsurface flow
The mathematical core of the framework is based on Darcy’s law extended into three-dimensional space. The model is used to simulate groundwater and hydrocarbon filtration in a heterogeneous system of interconnected permeable and semi-permeable layers. In the revised formulation, the flow behavior is described through the relationship:
where is the volumetric flow vector, is permeability, is dynamic viscosity, and is the pressure gradient. This formulation is consistent with the manuscript’s description of a structured-grid representation in which geological strata are assigned permeability, pressure, and porosity values that vary spatially throughout the modeled formation [10], [13].
To ensure the conservation of mass within the simulated domain, Darcy’s law is coupled with the continuity equation for steady-state incompressible flow, formulated as:
where is the fluid density. The differential equations were solved numerically using the Finite Difference Method (FDM) on a regular 3D Cartesian grid. To accurately represent the physical system, specific boundary conditions were applied: Dirichlet boundary conditions (constant pressure) were assigned to the outer boundaries of the primary aquifer to simulate regional flow drivers, while Neumann boundary conditions (zero flux, 0) were enforced across the identified low-permeability barriers to represent no-flow boundaries. The domain was discretized with a spatial resolution of 50×50 meters in the horizontal plane and variable vertical steps () aligned with the interpreted stratigraphic horizons.
The practical purpose of the model is to evaluate how low-permeability barriers modify fluid migration paths, reduce flow velocity, and generate local pressure accumulation. The explicit inclusion of such barriers improves the interpretation of heterogeneous underground systems compared with simplified field-based conceptual models that do not adequately represent structural compartmentalization. As a result, the model supports the identification of zones where hydrocarbon movement may be restricted, redirected, or locally intensified due to lithological contrasts [10], [12], [13].
2.6. AI-assisted image interpretation
Artificial intelligence and machine learning methods were incorporated as supportive tools for image interpretation. The manuscript explicitly mentions convolutional neural networks (CNNs) and Random Forest as the principal models used for object classification in satellite imagery, and also refers to supervised and unsupervised classification logic [14], [15].
In the revised methodological presentation, AI is positioned as an assisting component rather than as an isolated end in itself. The role of machine learning is to support the recognition of land-use patterns, geological properties, rock-type variations, and potential semi-permeable strata visible or indirectly reflected in satellite imagery. CNN-based interpretation is especially relevant for pattern recognition in multispectral data, whereas Random Forest and related classifiers can support spatial categorization tasks when labeled or semi-labeled image sets are available [14], [15].
At the same time, the final geological interpretation is not based solely on automated classification. Instead, AI-derived outputs are integrated with GIS layers, DEM-based interpretation, and geological reasoning. This makes the methodological structure more robust and avoids overstating the independent predictive role of machine learning in the current study [3], [4], [14], [15]. For the supervised classification tasks, the Random Forest (RF) algorithm was employed to map surface anomalies and vegetation stress indices, utilizing multispectral bands (Visible, NIR, SWIR) and DEM derivatives as input features. The RF model was trained using 100 decision trees (Nestimators = 100) with a maximum tree depth set to prevent overfitting. The dataset was split into training (70 %) and testing (30 %) subsets based on visually validated regions of interest (ROIs). Model performance was evaluated using standard quality metrics, achieving an overall classification accuracy of 86 % and an F1-score of 0.84 for target geological classes. For complex spatial feature extraction, a pre-trained Convolutional Neural Network (CNN) architecture was adapted. The multispectral imagery was preprocessed into 64×64 pixel patches to capture local textural contexts before feeding them into the network.
2.7. Validation strategy
To confirm the practical usefulness of the proposed framework, simulation testing was performed on a dataset representing an oil-bearing region. In the present study, the test case is associated with the Kashkadarya region. The validation logic is qualitative but geologically oriented: the performance of the modeling system was compared against known geological patterns and structural expectations for a hydrocarbon-bearing setting.
According to the manuscript, the validation demonstrated four practically relevant outcomes: a clear visual representation of aquifers and semi-impermeable barrier layers; identification of zones with abnormal pressure accumulation caused by flow restriction; support for more informed preliminary drilling-site screening; and identification of locations that may require additional geological or engineering attention due to possible upward gas migration. These results do not yet constitute a full quantitative benchmark, but they do provide a coherent proof-of-concept for the proposed integrated framework [10], [12], [13].
3. Results and discussion
3.1. Three-dimensional structural interpretation
The first main result of the study is the generation of a three-dimensional visual representation of the reservoir-related subsurface architecture using satellite-derived geodata and geological interpretation. The resulting digital model allows the user to inspect the geometry of subsurface layers, the spatial arrangement of stratigraphic units, and the continuity or discontinuity of structurally relevant zones. This is important because oil and gas exploration decisions depend not only on general geological maps, but also on the ability to understand layer relationships in three dimensions [10-12].
The visual output improves the interpretability of the study area by linking surface-derived geospatial information with subsurface structure. In practical terms, the model supports the identification of prospective zones, structurally constrained pathways, and locations where additional subsurface attention may be required before planning drilling or infrastructure expansion. In this way, 3D structural visualization serves as more than an illustrative output; it becomes a decision-support instrument for exploration-oriented analysis [11], [13], [21].
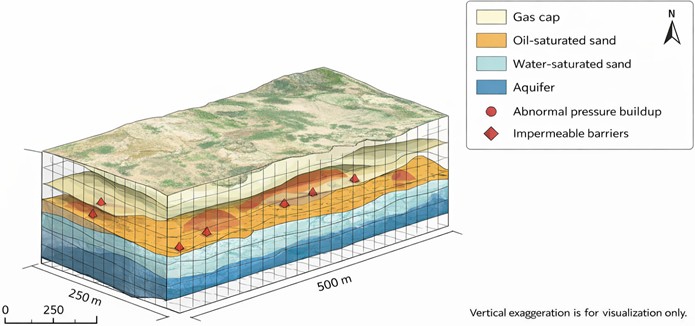
Fig. 2 presents the generated 3D visualization of the modeled oil field, illustrating how satellite-derived geospatial inputs were transformed into a structured digital representation suitable for exploration-oriented interpretation.
Fig. 2Three-dimensional visualization of the modeled oil-field structure reconstructed from integrated satellite-derived geospatial and geological inputs. The subsurface model was discretized on a structured grid with a horizontal cell size of 50×50 m and variable vertical steps aligned with the interpreted stratigraphic horizons. Visualization prepared by the authors using PyVista and Matplotlib
3.2. Representation of heterogeneous layers and barrier-controlled flow
A second important result is the successful representation of heterogeneous geological layers, including low-permeability barriers that affect filtration dynamics. The model does not treat the reservoir as a uniform porous body. Instead, it represents a linked system of aquifer and hydrocarbon-bearing layers separated in part by clay- and silt-rich units. This heterogeneity is central to the analytical value of the model, because it controls how fluid pathways develop and where pressure buildup may occur [10], [12], [13].
Fig. 3Structural representation of the reservoir surface and distribution of permeable and low-permeability zones used in the flow analysis
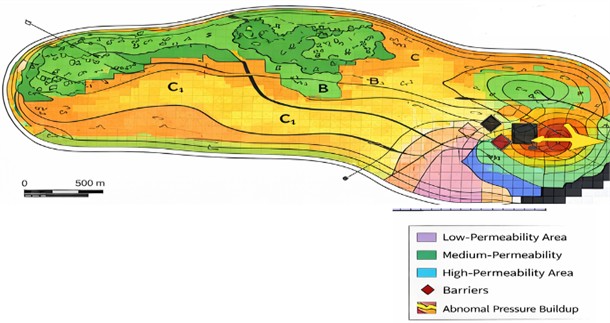
The simulations show that semi-permeable barriers slow fluid migration, alter local flow direction, and promote pressure accumulation in upstream zones. From the standpoint of oil and gas infrastructure tasks, this result is important because such zones may affect drilling risk, reservoir accessibility, and the probability of abnormal migration behavior. Thus, the model supports a more realistic interpretation of reservoir behavior than simplified homogeneous conceptualizations [10], [12], [13].
Fig. 3 shows the 3D structural representation of the reservoir surface and the modeled arrangement of permeable and semi-permeable layers used for subsequent flow analysis.
3.3. Darcy-based simulation results and practical interpretation
The Darcy-based simulation framework allowed the study to evaluate fluid flow under heterogeneous underground conditions. The main analytical output is not merely visual; it is the interpretation of how pressure gradients, permeability contrasts, and barrier geometry interact to produce constrained or redirected migration pathways. This constitutes the central technical contribution of the study.
The simulation results indicate that the inclusion of low-permeability zones enhances the realism of the predicted flow field. In particular, the model identifies zones of restricted flow and abnormal pressure accumulation that are not easily recognized in simplified representations. These outputs are relevant for practical oil and gas decision-making because they can support preliminary well-placement screening, improve interpretation of structurally constrained zones, and highlight areas that may require additional validation before field decisions are made.
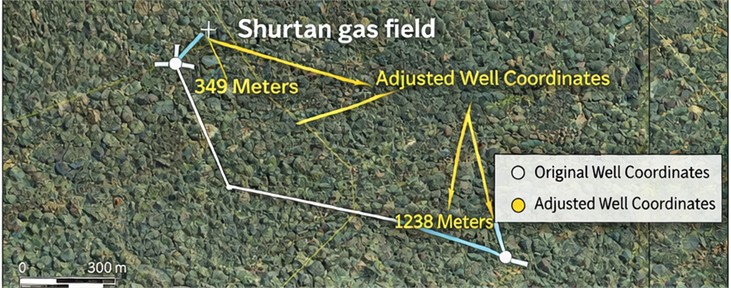
A quantitative comparison with a simplified homogeneous baseline model highlights the impact of this methodological integration. The introduction of semi-permeable barriers ( 0.1 mD) into the simulation reduced the calculated fluid migration velocity by approximately 65 % in the barrier-adjacent zones compared to the homogeneous baseline. Furthermore, the localized pressure buildup in constrained areas reached an excess of 15-20 % relative to the unconstrained flow scenario. Consequently, the adjustment of well coordinates by 349 m and 1238 m (as illustrated in Fig. 4) was mathematically justified by shifting the target zones out of the identified high-pressure gradient anomalies, thereby reducing potential drilling risks.
These findings should be interpreted cautiously. The model supports preliminary drilling-site screening and helps reduce interpretive uncertainty, but it is not intended to demonstrate fully quantified economic optimization in the absence of field-calibrated validation.
Fig. 4 illustrates the satellite-based spatial interpretation of adjusted well locations in the Shurtan gas field within the integrated geospatial analysis framework.
Fig. 4Satellite-based spatial interpretation of adjusted well locations in the Shurtan gas field within the broader Kashkadarya study area based on integrated geospatial analysis
3.4. Discussion of methodological value and limitations
The obtained results demonstrate the broader value of integrating satellite geodata, GIS, 3D modeling, and AI-assisted interpretation into a single workflow. The main strength of the framework is methodological integration: surface geospatial observations are not treated in isolation, but are transformed into a digital subsurface representation that can be explored visually and interpreted through Darcy-based filtration logic.
Another important strength is the use of open and widely accessible data sources and software environments. The reliance on MODIS, Landsat, Sentinel-2, GIS platforms, and Python-based visualization tools increases the practical reproducibility and affordability of the approach. For regions where high-cost proprietary subsurface datasets may be limited, such an integrated workflow can still provide meaningful exploratory support [16-19].
At the same time, the present study has limitations. First, the validation remains predominantly qualitative and is based on consistency with known geology rather than on a quantitative benchmark with formal error metrics. Second, the model simplifies real reservoir behavior by representing complex geological systems through a structured digital framework. Third, the AI component requires further validation on broader, multi-regional datasets to act as an independent predictive engine. These limitations should be acknowledged explicitly, because doing so will strengthen the scientific credibility of the paper rather than weaken it [10], [12], [13].
Finally, the results suggest that future work should focus on improving spatial resolution, integrating additional geological constraints, and developing more automated feature-recognition procedures for satellite imagery. This would allow the framework to evolve from a proof-of-concept modeling system toward a more quantitatively validated digital tool for oil and gas infrastructure analysis.
Therefore, the present results should be interpreted as a methodologically integrated and geologically plausible proof-of-concept rather than as a fully quantified operational forecasting system.
4. Conclusions
This study presented an integrated framework for advanced geospatial monitoring of oil and gas infrastructure based on satellite data, GIS-based analysis, three-dimensional geological reconstruction, and computational modeling of subsurface flow. In contrast to a purely descriptive interpretation of remote sensing products, the proposed approach combined MODIS, Landsat, and Sentinel-2 geodata with digital elevation models, lithological information, and a structured 3D representation of the subsurface in order to support a more physically meaningful analysis of geological conditions and infrastructure-related decision-making.
The results showed that the integration of satellite-derived geospatial information with digital modeling improves the visualization and interpretation of reservoir-related structures. In particular, the proposed framework made it possible to reconstruct the geometry of aquifer and hydrocarbon-bearing layers, represent low-permeability barriers, and analyze their influence on flow redistribution and local pressure accumulation. The Darcy-based formulation used in the model supported the interpretation of constrained migration pathways and zones where abnormal pressure behavior may occur. In this way, the study moved beyond general visualization and provided a geologically interpretable workflow for analyzing heterogeneous subsurface systems. The practical value of this result is that the generated 3D models can support better-informed drilling-site selection, may help identify zones requiring additional geological attention, and more environmentally responsible planning by reducing unnecessary exploratory actions. These advantages are consistent with the analytical logic already described in the Results section of the manuscript, where the model demonstrated visual representation of aquifers and semi-impermeable barriers, identification of pressure accumulation zones, and support for exploration planning.
An important contribution of the study is methodological integration. The framework does not treat satellite imagery, GIS interpretation, 3D modeling, and AI-assisted image analysis as isolated tools. Instead, these components are combined into a single workflow in which satellite data provide spatial coverage, GIS enables data fusion, 3D reconstruction represents structural heterogeneity, and machine learning methods assist image interpretation. This integrated organization better reflects the real complexity of oil and gas systems than fragmented digital approaches. In addition, the use of open and widely accessible data resources, including NASA Earthdata and the ESA Copernicus Open Access Hub, together with GIS platforms and Python-based visualization tools, makes the proposed methodology comparatively flexible, reproducible, and cost-efficient for applied geoscience tasks. The use of MODIS, Landsat, Sentinel-2, GIS applications, radar interferometry, CNN, and Random Forest as components of the methodological environment demonstrates the flexibility of the proposed workflow for applied geoscience tasks.
At the same time, the present study has several limitations that should be stated explicitly. First, the validation remains primarily qualitative and is based on consistency with known geological structures and model behavior rather than on a full quantitative benchmark with error metrics. Second, the geological system is represented through a structured digital abstraction, which cannot fully capture all natural complexities of real reservoirs. Third, the AI component in the current study plays a supportive interpretive role and requires further validation on broader, multi-regional datasets to act as an independent predictive engine. Recognizing these limitations strengthens the scientific credibility of the work and clarifies that the present paper should be understood as an integrated methodological and proof-of-concept study rather than as a fully field-calibrated operational platform.
Future work should therefore focus on three directions. First, the framework should be extended with quantitatively validated case studies using better-defined study-area parameters, spatial resolution settings, and numerical quality metrics. Second, additional geological constraints, such as borehole records, seismic interpretation, or field measurements, should be incorporated in order to improve model calibration. Third, AI-based identification of geological features in satellite imagery should be further automated and evaluated using explicit training and validation protocols. With these improvements, the proposed framework may evolve into a more robust digital decision-support tool for oil and gas infrastructure analysis, combining geospatial monitoring, reservoir-oriented interpretation, and sustainable planning within a single analytical environment. This applied orientation is also consistent with the broader need for environmentally responsible management of industrial territories and resource-related impacts in the region [22].
References
-
F. van der Meer, P. van Dijk, H. van der Werff, and H. Yang, “Remote sensing and petroleum seepage: A review and case study,” Terra Nova, Vol. 14, No. 1, pp. 1–17, Feb. 2002, https://doi.org/10.1046/j.1365-3121.2002.00390.x
-
Z. T. Riahi, K. Sarkarinejad, A. Faghih, B. Soleimany, and G. R. Payrovian, “Integration of remote sensing and geophysical data for structural lineaments analysis in the Rag-e-Sefid oil/gas field and surrounding areas, SW Iran,” Geosciences Journal, Vol. 27, No. 3, pp. 297–320, Mar. 2023, https://doi.org/10.1007/s12303-023-0003-z
-
S. Asadzadeh, W. J. Oliveira, and C. R. Souza Filho, “UAV-based remote sensing for the petroleum industry and environmental monitoring: State-of-the-art and perspectives,” Journal of Petroleum Science and Engineering, Vol. 208, p. 109633, Jan. 2022, https://doi.org/10.1016/j.petrol.2021.109633
-
G. Lassalle, S. Fabre, A. Credoz, D. Dubucq, and A. Elger, “Monitoring oil contamination in vegetated areas with optical remote sensing: A comprehensive review,” Journal of Hazardous Materials, Vol. 393, p. 122427, Jul. 2020, https://doi.org/10.1016/j.jhazmat.2020.122427
-
M. Fingas and C. Brown, “Review of oil spill remote sensing,” Marine Pollution Bulletin, Vol. 83, No. 1, pp. 9–23, Jun. 2014, https://doi.org/10.1016/j.marpolbul.2014.03.059
-
B. Adamu, K. Tansey, and B. Ogutu, “Remote sensing for detection and monitoring of vegetation affected by oil spills,” International Journal of Remote Sensing, Vol. 39, No. 11, pp. 3628–3645, Jun. 2018, https://doi.org/10.1080/01431161.2018.1448483
-
R. D.P. M. Scafutto, C. Lievens, C. Hecker, F. D. van der Meer, and C. R. Souza Filho, “Detection of petroleum hydrocarbons in continental areas using airborne hyperspectral thermal infrared data (SEBASS),” Remote Sensing of Environment, Vol. 256, p. 112323, Apr. 2021, https://doi.org/10.1016/j.rse.2021.112323
-
M. A. Adegboye, W.-K. Fung, and A. Karnik, “Recent advances in pipeline monitoring and oil leakage detection technologies: principles and approaches,” Sensors, Vol. 19, No. 11, p. 2548, Jun. 2019, https://doi.org/10.3390/s19112548
-
N. V. S. Korlapati, F. Khan, Q. Noor, S. Mirza, and S. Vaddiraju, “Review and analysis of pipeline leak detection methods,” Journal of Pipeline Science and Engineering, Vol. 2, No. 4, p. 100074, Dec. 2022, https://doi.org/10.1016/j.jpse.2022.100074
-
L. Schorpp, J. Straubhaar, and P. Renard, “Automated hierarchical 3D modeling of quaternary aquifers: the ArchPy approach,” Frontiers in Earth Science, Vol. 10, May 2022, https://doi.org/10.3389/feart.2022.884075
-
M. Tosta, G. P. Oliveira, B. Wang, Z. Chen, and Q. Liao, “APyCE: A Python module for parsing and visualizing 3D reservoir digital twin models,” Advances in Geo-Energy Research, Vol. 8, No. 3, pp. 206–210, Jun. 2023, https://doi.org/10.46690/ager.2023.06.07
-
M. F. Abu-Hashish, H. A. Wanas, and E. Madian, “3D geological modeling of the upper cretaceous reservoirs in GPT oil field, Abu Sennan area, Western Desert, Egypt,” Journal of Petroleum Exploration and Production Technology, Vol. 10, No. 2, pp. 371–393, Sep. 2019, https://doi.org/10.1007/s13202-019-00780-9
-
S. Asadzadeh and C. R. de Souza Filho, “Remote sensing analysis and numerical modeling of surface temperature anomalies over petroleum accumulations: A case study of the Alborz oilfield, Central Iran,” Journal of Petroleum Geology, Vol. 47, No. 2, pp. 215–230, 2024, https://doi.org/10.1111/jpg.12857
-
H. Shirmard, E. Farahbakhsh, R. D. Müller, and R. Chandra, “A review of machine learning in processing remote sensing data for mineral exploration,” Remote Sensing of Environment, Vol. 268, p. 112750, Jan. 2022, https://doi.org/10.1016/j.rse.2021.112750
-
P. Ma, Y. Zhuo, G. Chen, and J. G. Burken, “Natural gas induced vegetation stress identification and discrimination from hyperspectral imaging for pipeline leakage detection,” Remote Sensing, Vol. 16, No. 6, p. 1029, Mar. 2024, https://doi.org/10.3390/rs16061029
-
Landsat 8 Data Users Handbook. Reston, VA, USA: U.S. Geological Survey, 2019.
-
Sen2Cor 2.10.0 Software Installation and User Manual. European Space Agency, 2021.
-
P. Rapant, J. Struhár, and M. Lazecký, “Radar interferometry as a comprehensive tool for monitoring the fault activity in the vicinity of underground gas storage facilities,” Remote Sensing, Vol. 12, No. 2, p. 271, Jan. 2020, https://doi.org/10.3390/rs12020271
-
G. Fibbi, N. Landini, E. Intrieri, C. D. Ventisette, and M. D. Soldato, “Open-source InSAR data to detect ground displacement induced by underground gas storage reservoirs,” Earth Systems and Environment, Vol. 9, No. 4, pp. 3083–3100, Feb. 2025, https://doi.org/10.1007/s41748-025-00593-3
-
M. Talipov, “Computational modeling and analysis of mechanical power consumption in train assemblers’ work,” in International Conference on Applied Innovations in IT, Vol. 13, No. 2, pp. 419–426, 2025, https://doi.org/10.25673/120513
-
C. Sullivan and A. Kaszynski, “PyVista: 3D plotting and mesh analysis through a streamlined interface for the Visualization Toolkit (VTK),” Journal of Open Source Software, Vol. 4, No. 37, p. 1450, May 2019, https://doi.org/10.21105/joss.01450
-
Z. Bagova et al., “Processing of lead-containing industrial waste in Kazakhstan,” Open Engineering, Vol. 16, No. 1, Jan. 2026, https://doi.org/10.1515/eng-2025-0156
About this article

The authors have not disclosed any funding.
The datasets generated during and/or analyzed during the current study are available from the corresponding author on reasonable request.
Markhabo Shukurova: conceptualization, methodology, software, formal analysis, writing-original draft. Khamrokul Ruziev: investigation, data curation, validation, writing-review and editing. Miraziz Talipov: supervision, project administration, methodology, scientific editing, interpretation of results, writing-review and editing. Kamila Jurayeva: visualization, software support, validation, data interpretation, writing-review and editing.
The authors declare that they have no conflict of interest.

