Abstract
Smart grids generate large volumes of highly dynamic power measurement data, but existing integrity verification methods suffer from poor scalability and low efficiency. To address these challenges, this paper proposes a verification method based on a data middle platform and variable-block-size hash trees (VB-HTree). The data middle platform enables unified ingestion of multi-source heterogeneous data, anomaly correction, and distributed Kalman filter fusion, thereby enhancing data quality. Using VB-HTree, the method dynamically partitions hot and cold zones according to data access locality and varies block sizes to optimize hash tree depth and I/O overhead. Experiments on an IEEE 14-node system show that the proposed method achieves a data correction accuracy of 96.1 % and a data integrity verification success rate exceeding 99.5 %. The average verification time is approximately 46 % shorter than that of a fixed-block Merkle tree, offering an efficient and scalable solution for ensuring data integrity in power systems.

Highlights
- A data middle platform is developed to integrate multi-source heterogeneous power data, enabling anomaly correction and distributed Kalman filter fusion to improve measurement data quality and reliability.
- A variable-block-size hash tree (VB-HTree) is proposed, which dynamically adjusts data blocks based on access locality to reduce hash tree depth and I/O overhead for efficient integrity verification.
- Experiments on an IEEE 14-node system demonstrate that the proposed method achieves 96.1% data correction accuracy, over 99.5% verification success rate, and approximately 46% lower verification time than fixed-block Merkle trees.
1. Introduction
As smart grids evolve toward deeper digitalization and intelligence, the paradigm of power system operation and management is undergoing a fundamental transformation [1]. In this process, the scale, variety, and generation rate of power measurement data are growing exponentially, forming a quintessential big data environment in the power industry. These data are essential for grid situational awareness, operational risk warning, load dispatch optimization, and stability analysis of new power systems. Their integrity, consistency, and security also form the bedrock for all advanced applications and intelligent decision-making [2]. Comprehensive monitoring and efficient management of power big data are essential to achieving refined grid operation, intelligent decision-making, and enhanced system security. Power big data not only provide data support for core operational functions such as system-state awareness, fault warning, and accurate load forecasting, but their integrity and security also represent the lifeline for ensuring stable grid performance [3]. Traditional data-processing architectures often face challenges when dealing with massive, multi-source, heterogeneous, and real-time streaming data, including poor integration, processing delays, inconsistent data quality, and security vulnerabilities. These limitations make it difficult to meet the requirements of smart energy systems for high data-wide analytical capability, trustworthiness, and usability [4]. Performing integrity verification on power measurement data – i.e., confirming whether the data remain unchanged during storage or transmission - enables timely detection and correction of data errors, thereby ensuring data accuracy and reliability.
In recent years, numerous researchers have investigated methods to enhance the integrity verification of power measurement data. Nevertheless, existing approaches still exhibit significant shortcomings in scalability, accuracy, and support for dynamic updates. For instance, Khadse et al. [5] proposed a data integrity verification method based on quotient-difference and Merkle trees, which achieved integrity protection through data hiding and embedded verification bits. However, this method relied on complex hiding and extraction mechanisms, resulting in low processing efficiency for large-scale datasets and limited scalability. Babitha et al. [6] designed a dynamic key-based data integrity authentication model for cloud-fog computing environments. Although it provided a degree of security, its cumbersome key management process imposed a significant operational burden, rendering it unsuitable for high-concurrency scenarios. Maheswari et al. [7] employed multi-replication and consensus mechanisms for verification in distributed fog environments. While this approach could resist certain attacks, it incurred high overhead from data synchronization and replicated storage, led to low resource utilization, and remained susceptible to network latency. Akshay et al. [8] used dynamic lists to construct index tables that track data changes, enabling real-time inconsistency detection. However, the cost of index maintenance increased sharply with data volume and mutation frequency, resulting in poor system scalability. Khor et al. [9] designed a blockchain-based data protection protocol to achieve integrity protection on lightweight nodes. However, their evaluation scenario was limited and did not sufficiently consider adaptability to multiple sensor node types in complex power environments, which limited the representativeness of their findings. Li et al. [10] proposed a public verification mechanism based on public-key cryptography, which supported server-side verification without decryption. This approach, however, increased the server’s computational load and exhibited significant performance degradation in large-scale, multi-user data scenarios.
In summary, although existing methods for verifying the integrity of electricity consumption data each have their own focus, they generally share the following common issues:
1) Insufficient scalability: most are designed for static or small-scale datasets and struggle to adapt to the characteristics of continuously growing and dynamically updated power data.
2) Difficulty in balancing efficiency and security: some methods enhance security through complex key management or multi-replica consensus, but this significantly increases computational and storage overhead.
3) Failure to leverage data access locality: most verification structures (such as fixed-block Merkle trees) apply a uniform granularity to all data, ignoring the spatiotemporal locality characteristics of power systems, where recent data and data from critical nodes are accessed frequently while historical data is accessed infrequently, leading to I/O and verification path redundancy.
To address these gaps, this paper proposes a method for verifying the integrity of power measurement data based on a data middle platform and a variable-block-size hash tree (VB-HTree). Its innovation lies in the following two aspects:
(1) A collaborative architecture of “repair and verification” driven by the data middle platform (DMP). Unlike existing methods that focus solely on the verification phase, this paper utilizes a data middle platform to uniformly integrate multi-source, heterogeneous power measurement data. It incorporates sliding window, isolated forest, KNN clustering, and singular value threshold (SVT) algorithms to achieve high-precision missing data restoration. Furthermore, distributed Kalman filtering is employed to perform deep fusion of multi-source data, significantly enhancing data consistency and availability. This architecture improves data quality at the source, laying a reliable foundation for subsequent integrity verification.
(2) A lightweight integrity verification mechanism using a VB-HTree. To address the shortcomings of fixed-block hash trees in power big data scenarios - namely, large tree depth, long verification paths, and high I/O overhead - this paper dynamically divides data into hot zones (small blocks) and cold zones (large blocks) based on the access locality of power measurement data. Two hash trees of different depths are constructed, with the root nodes securely stored in a trusted zone. This method effectively shortens the average verification path and reduces storage and computational overhead while maintaining the same security level as traditional hash trees. It is particularly suitable for power system environments characterized by both high-frequency read/write operations and large-scale historical data.
The main contributions of this paper include: 1) proposing an integrity verification architecture that integrates a data middle platform with VB-HTree to achieve coordinated optimization of data ingestion, repair, fusion, and verification; 2) designing dynamic repair and multi-source fusion algorithms tailored for power measurement data; 3) verifying the superiority of the proposed method in terms of repair accuracy, verification success rate, and time efficiency through experiments on an IEEE 14-node system.
2. Integrity verification of power measurement data
2.1. Overall architecture
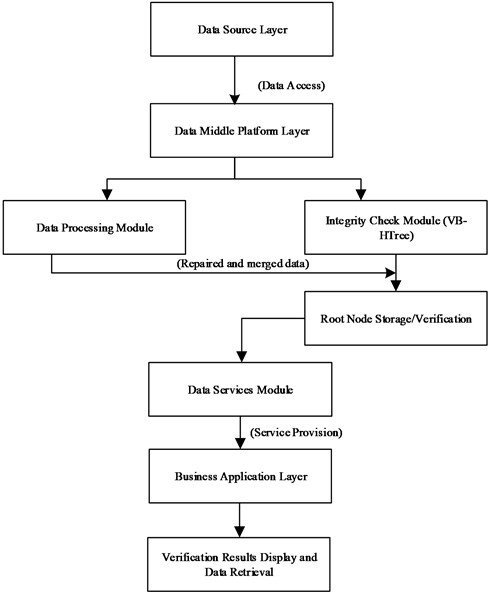
Ensuring data integrity is critical given the rapid growth and increasing complexity of power measurement data in modern power system applications. This paper proposes a data integrity verification architecture for power measurement data that combines a data middle platform with a VB-HTree, as illustrated in Fig. 1. The architecture leverages the core capabilities of the data middle platform and integrates the VB-HTree verification technique, forming a comprehensive framework that encompasses data collection, processing, storage, and verification. Through this architecture, comprehensive monitoring and efficient management of power big data can be achieved, thereby ensuring data integrity and security. The architecture is divided into three layers: the data source layer, the data middle platform layer, and the business application layer. This architecture can integrate power measurement data in various formats and from diverse sources, including traditional structured data, semi-structured data, and unstructured data. It also integrates data from different origins, enabling comprehensive and efficient data collection and integration. Additionally, it offers a high degree of customization, allowing flexible configuration and adaptation according to user needs and scenarios to meet personalized requirements [11].
Fig. 1Workflow for power measurement data integrity verification
(1) Data source layer.
The data source layer encompasses diverse sources of power measurement data, including data from various measurement terminals (e.g., smart meters, remote terminal units (RTUs)). These data are collected, integrated, and processed through management or monitoring systems such as energy management systems (EMS), distribution management systems (DMS), power plant monitoring systems, and customer information systems (CIS). These systems typically perform preliminary processing before transmitting data to the data middle platform layer. Processing steps include data format standardization (e.g., unified conversion to IEC 61850 or DL/T 860 protocols), timestamp synchronization (based on high-precision clock sources), preliminary outlier filtering (using threshold or gradient-based criteria), and data compression (applying lossy or lossless algorithms). This reduces network transmission load and enhances data quality. Raw measurement data are generally not uploaded directly beyond the data source layer. Raw data samples are retrieved only when required for integrity verification or in-depth analysis at the data middle platform layer [12].
(2) Data middle platform.
The data middle platform comprises the data access module, data processing module, integrity verification module, data service module, and data operation module.
a) The data access module is responsible for receiving and replicating data from the data source layer and rapidly supplying the required data to other modules.
b) The data processing module performs in-depth processing of incoming data, including data cleansing and format conversion, to ensure standardization and consistency, laying the groundwork for subsequent integrity verification. It also incorporates a power measurement data repair function, utilizing advanced algorithms to accurately repair abnormal or missing data after preprocessing, thereby improving data quality. The data repair process within this module is systematic. First, recent data are extracted via a sliding time window, and algorithms such as isolation forest are employed to remove obvious outliers. Subsequently, for terminals exhibiting data anomalies or missing values, a set of terminals with similar electricity consumption patterns is identified using K-nearest neighbors (KNN) clustering based on weighted correlation coefficients. Based on this set, a power measurement data matrix is constructed. This matrix undergoes low-rank approximation repair via the singular value thresholding (SVT) algorithm, thereby restoring missing or anomalous values. Supported by the distributed computing framework of the data middle platform, this entire process enables efficient and accurate repair of massive power measurement data. Additionally, this module supports multi-source data fusion. By effectively integrating data from different sources, it reveals more significant data characteristics, further enhances data integrity and usability, and provides comprehensive, reliable data support for constructing the VB-HTree in the integrity verification module.
c) The integrity verification module employs variable-block-size technology to dynamically adjust storage block sizes, improving data processing efficiency. Combined with the hash tree algorithm, a unique hash value is generated for each storage block, and data are stored in categorized groups based on their relationships. During integrity verification, the hash value of the root node for the current data is recalculated and compared with the stored value. If they match, the data are considered intact; otherwise, an alert is triggered.
d) The data service module serves as the platform’s unified entry point and is responsible for identity verification and data access control.
e) The data operation module handles platform task scheduling and resource management, including functions such as big data research and development, data portals, and data tag management.
(3) Business application layer.
The business application layer primarily includes the service management module, big data retrieval module, and system management module. The service management module provides users with an application interface for data integrity verification results and supports functions such as data query and report generation. The big data retrieval module offers efficient data retrieval services, enabling users to quickly locate required data. The system management module is responsible for system configuration, platform monitoring, and maintenance to ensure stable operation.
This power measurement data integrity verification architecture exhibits strong scalability, as the data middle platform can be adapted to power systems of varying sizes and complexities. The VB-HTree technology within the integrity verification module can dynamically adjust storage block sizes, reduce hash tree depth, and improve data processing efficiency. By applying the hash algorithm and comparing root node hash values, data integrity can be rapidly verified with high accuracy. Consequently, this method provides robust data protection for the secure and stable operation of power systems and supports the digital transformation and intelligent upgrading of the power industry.
2.2. Repairing power measurement data using a data middle platform
In the daily operation of power systems, power measurement data constitute an indispensable and valuable resource. However, various factors can lead to missing or abnormal data, which may threaten system stability and reliability. To address this challenge, the data preprocessing module of the data middle platform employs a data repair method to restore the integrity of the ingested power measurement data [13]. The algorithm first preprocesses the power measurement data, selects a subset via a sliding time window, and removes abnormal or duplicate entries while pre-filling missing values. Based on this, similarity among measurement terminals is defined, and terminals with comparable behavior are selected through clustering to construct a measurement data matrix of similar terminals. Finally, the SVT algorithm is applied to repair the constructed power measurement data matrix, after which the repaired dataset is returned.
2.2.1. Sliding window
Given the large volume and periodic nature of power system measurement data, a sliding time window of length is first constructed to extract a manageable subset from the extensive power measurement data. The selection of is primarily based on the periodic characteristics of the power load, which typically exhibits daily, weekly, and annual patterns. The window must be long enough to cover at least one complete cycle (such as multiple daily or seasonal cycles) to capture the inherent data patterns, yet not excessively long so as to avoid introducing excessive historical noise, obsolete patterns, or unnecessary computational overhead. With reference to common data lookback periods used in short-term load forecasting and state estimation in power systems, and considering the experimental analysis presented later in this paper, the range for is determined to be 70-110 days. This range captures sufficient periodic information while retaining sensitivity to recent changes, thereby achieving optimal repair performance.
After data preprocessing, to further improve the accuracy and efficiency of power measurement data repair, a combined approach of “isolation forest + K-NN clustering” is adopted. The design of this approach is based on the following considerations:
(1) Characteristics of power data and anomaly detection requirements: Power measurement data exhibits periodicity, correlation, and spatiotemporal dependence. However, outliers - such as sudden changes or gross errors-often occur due to equipment failures, communication interruptions, or human interference [14]. The isolation forest algorithm is well-suited for anomaly detection in high-dimensional data; it can efficiently identify and remove obvious outliers, providing a clean data foundation for subsequent clustering and restoration.
(2) Rationality and efficiency of cluster-based restoration: In power systems, measurement data from terminals with similar geographic locations and consumption patterns show high correlation. K-NN clustering identifies similar terminals for those with anomalies and constructs a low-rank data matrix, which can then be repaired using matrix completion methods such as the SVT algorithm. This strategy applies clustering only to anomalous terminals, avoiding global computation, significantly reducing complexity, and supporting online processing.
(3) Synergy of the combined solution: Isolation forest addresses “noise removal,” while K-NN clustering performs “similarity identification.” This combination improves the accuracy of anomaly detection while preserving data correlation during repair. Together, they form a complete “detection-localization-repair” workflow, enabling efficient and precise enhancement of data quality in power big data environments.
2.2.2. Clustering
To obtain power data with similar magnitudes and characteristics, it is necessary to cluster measurement terminals with comparable behavior, thereby minimizing discrepancies in the power measurement data that arise from variations in electricity consumption patterns among different terminals. For this purpose, the K-NN algorithm is employed to group similar measurement terminals.
The specific implementation of the K-NN clustering algorithm proceeds as follows: (1) Feature vector construction: the sequence of power measurement data (e.g., active power time series) from each measurement terminal within a sliding time window of length forms its feature vector. (2) Similarity calculation: the weighted Pearson correlation coefficient is adopted as the similarity metric. This metric distinguishes the reliability of raw observation data from that of interpolated data through weighting coefficients, thereby enhancing the accuracy of similarity assessment. The weighted correlation formula effectively reduces measurement bias introduced by data interpolation during missing-value handling. (3) Identifying nearest neighbors: for a target terminal exhibiting abnormal data, its similarity with all other terminals within the time window (or a larger candidate set) is calculated. The terminals with the highest similarity are selected as its nearest neighbors. The value of can be determined via cross-validation or predefined based on domain knowledge - for example, by referring to the number of terminals supplied by the same distribution transformer or those exhibiting similar electricity consumption patterns. (4) Constructing the similar terminal set: these K nearest neighbor terminals are grouped into a set of terminals similar to the target terminal. This set is subsequently used for data matrix construction and repair.
For each measurement terminal with abnormal data, similar terminals are identified through the above clustering process. The data from these similar terminals are then utilized to repair the abnormal measurements. This approach operates only on terminals with data anomalies, substantially reducing computational load in power big data processing. At the same time, it accommodates the real-time addition of measurement terminals in the power system, enabling online clustering capability.
In the similarity calculation, partially interpolated data are assigned lower weights, while accurately observed data receive higher weights. This weighting scheme is adopted because the linear interpolation method used in the data preprocessing stage is a relatively low-accuracy filling technique, whereas the originally collected data are considered fully accurate when assessing similarity between terminals. Weighting corrects the similarity metrics among terminals, yielding more accurate clustering results. Consequently, data from similar measurement terminals are used more effectively to repair abnormal power measurements, improving the completeness and accuracy of the power measurement dataset.
The power measurement data vectors for two terminals within a sliding time window are defined as and . Each measurement value or is assigned a weight coefficient . By calculating the weighting coefficient , the reliability of original observation data can be distinguished from that of interpolated data. The coefficient is defined as follows:
where, is a decay constant less than 1 used to reduce the weight assigned to interpolated data; it typically lies between 0.8 and 0.95 and can be adjusted according to data quality and application requirements. When a data point or is original observation data, = 1; when it is interpolated data, = 0. This weighting yields corrected power measurement data vectors and .
Based on the weighting coefficients defined above, the similarity between two measurement terminals is calculated using a form of the Pearson correlation coefficient:
where, denotes the covariance of and ; and are the standard deviations of and ; and and represent the means of and . The value of the correlation coefficient lies in the interval [−1, 1]; values closer to –1 or 1 indicate a stronger correlation between the two measurement terminals. Consequently, the similarity between two terminals is defined as:
where, is a value in the interval [0, 1]. The closer is to 0, the more similar the two measurement terminals are.
The K-NN algorithm selects a suitable number of measurement terminals that are similar to the terminal with missing data, using the corrected similarity measure defined above. This process generates a new power measurement data matrix, which is then used to repair the abnormal measurement data.
2.2.3. Anomaly detection
When power measurement data contain missing values or anomalies, the constructed power measurement data matrix will be incomplete. By analyzing the existing data to repair the missing entries, a complete power measurement dataset can be obtained, thereby better supporting the integrity verification of the data. Given the approximately low-rank nature of the power measurement data matrix, the SVT algorithm is adopted to address the data repair problem.
K-NN clustering identifies similar terminals for a target anomalous terminal. Let the sliding time window be days, with sampling points per day (e.g., 96 for 15-minute intervals). The resulting matrix has dimensions () × (). Each row holds the measurement sequence of one terminal (target or similar) over the entire window. Each column represents the corresponding measurement values of all () terminals at the same sampling time point. This matrix is typically low-rank or approximately low-rank because the electricity consumption behaviors of similar terminals are correlated, leading to linear dependencies among rows. This construction method unifies the time and terminal dimensions into a two-dimensional structure, facilitating global repair by exploiting the matrix’s low-rank property.
The SVT algorithm aims to leverage the low-rank property of the matrix to minimize its rank and recover the missing information. Its objective function is formulated as follows:
where, is the matrix after data repair; is the matrix to be repaired; denotes the nuclear norm of a matrix (i.e., the sum of its singular values); and is a projection operator representing orthogonal projection onto the set .
The objective function is solved via the SVT algorithm, as follows:
The operator in Eq. (4) preserves matrix elements only at the observed positions in the set , while setting all other entries to zero, thereby constraining the optimization to the known data.
Directly solving the constrained optimization problem in Eq. (4) is challenging. Therefore, a regularization parameter 0 is introduced to reformulate the original problem as the following unconstrained optimization problem, which is then solved using the SVT algorithm:
where, denotes the Frobenius norm of the matrix, which is the square root of the sum of the squares of all matrix elements; is the regularization parameter. This formulation combines nuclear-norm minimization with the minimization of observation errors, allowing to balance low-rank properties and data-fitting accuracy.
To solve Eq. (6), its augmented Lagrangian function is constructed:
where, is the Lagrange multiplier matrix.
The alternating direction method of multipliers (ADMM) is employed to minimize the augmented Lagrangian function, leading to the following iterative formulation:
where, denotes the iteration index; is a weight coefficient; and is the soft-thresholding operator. For a matrix , the operator is defined via its singular-value decomposition as:
where, the singular values of the matrix are denoted by , , and and are the left and right singular-vector matrices, respectively.
The SVT algorithm applies singular value decomposition to the power measurement data matrix, decomposing it into left and right singular matrices and a diagonal matrix of singular values. After soft-thresholding, the algorithm effectively suppresses the influence of noise and outliers while preserving the principal features of the data. The processed singular values together with the left and right singular matrices are then used to reconstruct the power measurement data matrix, yielding a repaired power measurement dataset.
2.3. Multi-source data fusion based on distributed Kalman filtering
The data middle platform can integrate power measurement data acquired from different measurement terminals. These data sources may cover multiple links in the power system, such as power plants, substations, distribution networks, and end-user terminals. Through the data middle platform, this distributed data can be centrally stored and managed [15], forming a unified data view. This not only improves data accuracy and consistency but also provides a solid foundation for subsequent integrity verification. To better fuse multi-source heterogeneous power measurement data, enhance data quality, and reveal more significant data characteristics, this paper introduces the concept of information pairs into the Kalman filter framework and constructs a distributed Kalman filter algorithm. Deep data integration is achieved by exchanging and fusing the repaired power measurement data with adjacent data sequences [16].
The information matrices and are crucial in the data fusion process because they, together with the state estimate and the posterior estimation covariance matrix , form the basis for fusing power measurement data, which is expressed as:
The recursive form of the distributed Kalman filter incorporates the covariance matrices of the system noise and the measurement noise, and , to accurately update the state estimate at each time step:
To improve the accuracy of local fusion of power measurement data, the complete measurement dataset is denoted as . Each sequence can transmit its local posterior covariance to an adjacent sequence and subsequently perform data fusion using the local posterior covariance matrix of sequence .
The fusion calculations are expressed as follows:
where, is a combined weighting coefficient that is positive and satisfies the condition for any node. The value of can be obtained from the following expression:
The procedure of the multi-source fusion algorithm for power-measurement data is summarized as follows:
(1) Data initialization: define the time series , , where represents the set of all power-measurement data sequences.
(2) Observation of local data: update the information pair of time series using the recursive form of the distributed Kalman filter.
(3) Information-pair transmission: transmit the information pair of time series to an adjacent time series . If the data of series are complete and secure, receive the information pair from series .
(4) Data fusion: using the local information pair and the information pair received from the adjacent series, perform data fusion according to Eq. (12) and (13) to obtain a fused information pair. This step ensures global consistency and accuracy of the power measurement data.
(5) Update of local filter quantities: based on the fused information pair, update the state estimate and the covariance matrix of the local time series.
(6) Iterative loop: return to step (2) and continue the cycle of data observation, information transmission, data fusion, and local-filter updates until a preset iteration count or convergence criterion is satisfied.
The multi-source fusion algorithm for power measurement data can efficiently integrate measurements from diverse sources, thereby improving data quality and providing robust support for subsequent integrity verification of power system measurement data.
The isolation forest, K-NN, and SVT algorithms integrated in this paper, while exhibiting non-negligible computational complexity in single-point processing, ensure real-time feasibility in large-scale scenarios through their deployment within a data middle platform architecture. First, data preprocessing and repair tasks can be executed in parallel within distributed computing frameworks (e.g., Spark). By partitioning massive smart-meter data for processing, the load per task is significantly reduced. Second, K-NN clustering is applied only to terminals exhibiting anomalies rather than to all terminals. The sliding time window mechanism limits the data volume processed per computation, avoiding the overhead of global similarity calculations. Furthermore, the data middle platform possesses elastic resource-scheduling capability, dynamically allocating resources based on computational load to support near-real-time processing demands for millions of smart meters.
2.4. Integrity verification based on VB-HTree
Power measurement data integrity verification can effectively validate power measurement data stored in untrusted storage within power systems, thereby detecting tampering with such data [17]. Traditional Merkle hash trees use fixed-size data blocks (e.g., 4 KB per block) to construct complete binary trees, treating all storage areas equally. However, access to power measurement data exhibits significant spatio-temporal locality: recently collected data, measurements from critical nodes (such as hub substations), and frequently accessed statistical analysis data are accessed frequently (referred to as “hot data”), while historical archived data is rarely verified (referred to as “cold data”). In fixed-block hash trees, both hot and cold data are treated with the same small-block granularity, leading to two serious issues [18]:
1) Large tree depth and long verification paths. For massive amounts of power data, the number of leaf nodes in fixed-block structures is extremely large, and the hash tree depth can reach dozens of levels. Each integrity check requires hashing upward from the leaf nodes to the root node, generating a large number of I/O operations and computational delays.
2) Mismatch between storage overhead and access patterns. Cold data occupies small-block storage and corresponding intermediate hash nodes, yet is verified with extremely low frequency, resulting in wasted storage resources; while small-block partitioning of hot data facilitates rapid updates, it cannot be further optimized due to the fixed block size.
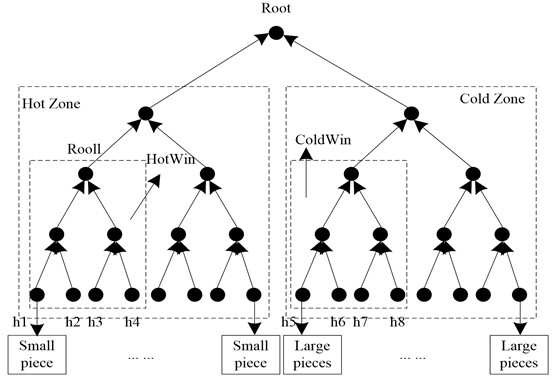
To address this, this paper proposes the VB-HTree, which dynamically adjusts block sizes based on data access frequency: small blocks are used in hot regions to support low-latency, high-frequency checks, while large blocks are used in cold regions to reduce the total number of nodes and tree depth, thereby achieving joint optimization of verification efficiency and resource utilization. The basic structure of VB-HTree is shown in Fig. 2.
In Fig. 2, the entire protected storage space is divided into a hot zone (dashed box on the left) and a cold zone (dashed box on the right). The hot zone consists of multiple smaller, fixed-size data blocks, corresponding to a deep “hot hash tree”; the cold zone consists of larger data blocks (typically integer multiples of the hot block size), corresponding to a shallow “cold hash tree”. The root nodes of the two trees (Root_Hot and Root_Cold) are securely stored in a trusted storage area (such as on-chip cache).
VB-HTree is an optimization designed to address the high performance overhead of traditional fixed-block-size Merkle hash trees in scenarios involving frequent access. Its core mechanism involves dynamically partitioning data based on access frequency and constructing hash trees with different block sizes for different regions. The region storing electricity consumption data is divided into hot and cold zones. The hot zone contains multiple smaller data blocks of equal size, used for frequent access; the cold zone contains multiple larger data blocks of equal size (typically an integer multiple of the hot zone block size), used for less frequent access scenarios. By constructing two hash trees - a hot hash tree and a cold hash tree-corresponding to the data structures of the hot and cold zones, respectively, a verification system is formed comprising these two trees. The roots of the hot and cold hash trees are placed in the on-chip cache to ensure their security (preventing tampering). In this system, the root nodes of the hot hash tree and the cold hash tree are securely stored in the on-chip cache to prevent unauthorized tampering.
Fig. 2Structure of the VB-HTree
Integrity Verification Process: during integrity checking, similar to the traditional hash tree method, power measurement data are read from the leaf nodes, hash values are calculated, and the computation proceeds level by level until the root node is reached. Because small data blocks in the hot zone are accessed frequently at low cost, while large data blocks in the cold zone are accessed infrequently at higher cost, this division strategy reduces the average access cost and improves verification efficiency.
Determination of Hot and Cold Zones: for power measurement data integrity verification, hot and cold zones can be identified using a counter-based method. Specifically, each block storing power measurement data is assigned a counter to record its access count, and a threshold is set (based on the actual application scenario). Initially, all counters are zero. Whenever a data block is accessed, its counter is incremented. After a period, data blocks whose counter values exceed the threshold are considered hot blocks and assigned to the hot zone; otherwise, they are treated as cold blocks and placed in the cold zone.
Analysis of VB-HTree Advantages: traditional fixed-block hash trees, while structurally simple and easy to implement, show notable limitations in power big-data environments. For example, access to power measurement data exhibits strong spatiotemporal locality: recent data and critical node data are accessed frequently, whereas historical data are accessed less often. Fixed block sizes force the same verification granularity regardless of data “temperature”, causing frequent access to small blocks to incur the same hash computation and storage overhead as large blocks – a clear resource waste. Moreover, with massive data volumes, fixed block sizes lead to numerous leaf nodes and deep hash tree structures [19]. Each integrity check requires sequential hash calculations from leaves to the root, resulting in long verification paths and high I/O overhead, which hinders meeting the high real-time demands of power systems. In contrast, the VB-HTree proposed in this paper partitions storage into hot zones (small blocks) and cold zones (large blocks) based on access frequency. Small blocks in hot zones accelerate response for high-frequency accesses, while large blocks in cold zones reduce leaf node count and tree depth, significantly shortening the average verification path. Combined with dynamic monitoring and adjustment mechanisms such as counters, VB-HTree adapts to changing access patterns. While maintaining the same hash chain and root node verification mechanisms as traditional hash trees, VB-HTree substantially improves verification efficiency and resource utilization while ensuring data integrity and security, making it particularly suitable for power measurement data scenarios with pronounced access locality. However, the VB-HTree design is based on the principle of program access locality. Under typical access patterns (where hot-zone accesses dominate), its average verification efficiency exceeds that of traditional fixed-block hash trees. In extreme scenarios where cold-zone requests become exceptionally frequent, overall system verification latency may increase. Nevertheless, in practical power measurement data integrity verification, routine data access and verification operations are concentrated on recent or critical measurement data (corresponding to hot zones). Moreover, the system can dynamically adjust hot/cold zone distributions by monitoring access patterns to maintain efficient operation. This design achieves an optimized balance between storage and computational resources while guaranteeing secure verification capability.
To further improve verification efficiency, the concepts of hot access windows (HotWin) and cold access windows (ColdWin) can be introduced. In the hot zone, a smaller access sub-region is called a hot access window; in the cold zone, a smaller access sub-region is called a cold access window. A hot or cold zone may contain one or more access windows. The width of an access window should be chosen by balancing multiple factors: a smaller width better suits small, discretely distributed memory accesses and can yield better system performance, but may require more access windows to cover clustered access areas, and changes in access clusters may cause more hot-window movements, degrading performance. A larger width has the opposite effect. Therefore, a suitable access window width should be determined through simulation experiments or relevant analytical calculations. In terms of security, because VB-HTree is an enhancement of the hash tree verification method, its verification logic - from leaf node to the root node in the secure area - remains the same. Thus, VB-HTree offers the same security level as the hash tree method and can effectively prevent various attacks that compromise data integrity, including replay attacks.
The rules and algorithms for VB-HTree-based power measurement data integrity verification are as follows. To ensure efficient operation of the VB-HTree model, the following rules are defined:
(1) The access window width is fixed, and the entire protected storage space must be an integer multiple of the window width.
(2) An access window can only shift horizontally in steps equal to the window width as the access area changes.
(3) Multiple HotWin and ColdWin may exist. HotWin can be distributed continuously to cover a larger access-cluster area, or discretely to correspond to multiple non-contiguous access-cluster areas.
(4) The storage block sizes corresponding to leaf nodes in HotWin and ColdWin differ; blocks in ColdWin are usually larger.
Based on these rules, the integrity verification process for power measurement data proceeds as follows:
(1) Split the access area (create access windows).
For the hot zone: calculate the hot zone size using the counter method, then split the power measurement data in the current hot zone into multiple equal-sized HotWins. If a single HotWin cannot cover the entire hot zone, multiple HotWins may be created. The number of HotWins is computed using the following formula:
where, HotSpace denotes the memory space corresponding to the hot zone, and HWSpace denotes the storage space corresponding to a single HotWin.
Partitioning the cold zone: The remaining memory space requiring protection (i.e., the cold zone) is divided into equally sized, larger ColdWins. The number of ColdWins is obtained from the following expression:
where, AllSpace denotes the total protected memory space, HotSpace is the size of a data block in the hot zone, and ColdSpace is the size of a data block in a ColdWin.
(2) Initialize the hash tree.
Based on the above partition, the hot hash tree and the cold hash tree are initialized separately. Specific steps include: computing the hash value of each data block to obtain leaf node values; then combining adjacent leaf node values and computing their hash values; and proceeding recursively until a complete hash tree is constructed. Finally, the internal nodes of the hash tree are cached, and the root nodes are stored in trusted storage (the root nodes of the hot hash tree and the cold hash tree are stored separately).
(3) Verify nodes in the access window.
Read the data of the target node and its sibling nodes, concatenate them, compute the hash value, and compare the result with the corresponding parent node. If they match, continue verification upward until reaching the root of the hash tree [20].
(4) Update nodes in the access window.
When updating the power measurement data of a node, first replace its data with the new value, then concatenate the data of the node and its siblings, compute the hash, and use the new hash result to update the parent node. This process is repeated recursively until the root node of the hash tree is updated.
(5) Translation of the hot access window.
When the hot access window needs to be shifted, it is moved to a new location in steps that are integer multiples of the window width. Subsequently, the steps of partitioning the access area and initializing the hash tree are repeated to adapt to the new access pattern.
By following these rules and algorithms, the VB-HTree model can efficiently perform integrity verification of power measurement data.
This paper focuses primarily on integrity verification during data storage and transmission. To further enhance system security, data-source authentication can be incorporated by integrating digital signatures with an identity management system. Specifically, each measurement terminal can be assigned a unique digital certificate to sign the raw data or its digest during collection, with the signatures uploaded together with the data to the data middle platform. Beyond verifying data integrity, the integrity verification module can also authenticate the source and legitimacy of the data by validating the digital signatures. When combined with VB-HTree, this mechanism establishes an end-to-end trusted data chain, defending against threats such as data forgery and man-in-the-middle attacks, thereby ensuring the credibility of power measurement data from its origin.
3. Experimental analysis
To evaluate the performance of the proposed method, experiments are conducted using an IEEE 14-bus power system as a test case; its schematic is shown in Fig. 3. The operation of this power system is modeled using PowerWorld simulation software. PowerWorld is a widely adopted commercial tool for power-flow calculation, stability analysis, short-circuit calculation, and visual simulation of power systems. It accurately simulates steady-state operating parameters, including nodal voltages and phase angles, as well as active and reactive power in each branch. The software supports user-defined measurement configurations and disturbance injection, making it a common choice in power system research and education. In this experiment, its power-flow and dynamic simulation capabilities are primarily used to generate continuous, realistic power measurement data sequences that emulate the data output from actual EMS/DMS systems. An IEEE 14-bus system model is built in PowerWorld. The measurement configuration is listed in Table 1. The power measurement data provided by the simulated EMS, DMS, power plant monitoring system, CIS, and other sources include active power, reactive power, voltage, current, etc. A data middle platform is established to store, manage, and process measurement data from these different systems. A VB-HTree structure is employed to verify data integrity. For each measurement point in the system, 400 samples are collected. Bad data-including abrupt changes and gross errors - are artificially injected into each measurement to simulate anomalies that occur in real power systems.
Fig. 3IEEE 14-bus power system
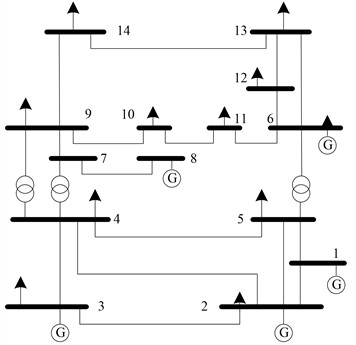
Table 1Measurement configuration
Measurement number | Measurement type | Starting node | Terminal node | Measurement number | Measurement type | Starting node | Terminal node |
1 | 6 | 1 | 2 | 18 | 4 | 10 | 11 |
2 | 6 | 1 | 5 | 19 | 4 | 12 | 13 |
3 | 4 | 2 | 3 | 20 | 4 | 13 | 14 |
4 | 6 | 2 | 4 | 21 | 2 | 1 | – |
5 | 6 | 2 | 5 | 22 | 2 | 2 | – |
6 | 6 | 3 | 4 | 23 | 2 | 3 | – |
7 | 4 | 4 | 5 | 24 | 2 | 4 | – |
8 | 6 | 4 | 7 | 25 | 2 | 5 | – |
9 | 6 | 4 | 9 | 26 | 2 | 6 | – |
10 | 4 | 5 | 6 | 27 | 2 | 7 | – |
11 | 6 | 6 | 11 | 28 | 2 | 8 | – |
12 | 4 | 6 | 12 | 29 | 2 | 9 | – |
13 | 4 | 6 | 13 | 30 | 2 | 10 | – |
14 | 6 | 7 | 8 | 31 | 2 | 11 | – |
15 | 4 | 7 | 9 | 32 | 2 | 12 | – |
16 | 4 | 9 | 10 | 33 | 2 | 13 | – |
17 | 6 | 9 | 14 | 34 | 2 | 14 | – |
Note: Measurement type = 2 denotes a nodal injection measurement; measurement type = 4 denotes a branch-flow measurement on the from-bus side; measurement type = 6 denotes a branch-flow measurement on the to-bus side | |||||||
The method effectively utilizes the data middle platform to complete the preprocessing of power measurement data in the power system. During the repair of power measurement data, the choice of the sliding time window length significantly affects both the repair time and the accuracy of the restored data, owing to variations in data complexity. To further investigate the influence of the sliding time window on data repair, experiments are conducted with different window sizes. A randomly selected set of power measurement data from bus 6 is used for repair tests while keeping the bad-data rate constant. The effectiveness of data repair is evaluated via the matrix Frobenius norm error , which quantifies the repair accuracy; it is calculated as follows:
where, is the matrix after data repair; is the matrix to be repaired.
Active power, reactive power, voltage, and current measurement data from bus 6 of the power system are selected as test data. A statistical summary of the repair results for each type of measurement is presented in Fig. 4.
Fig. 4Statistical summary of repair results for different measurement quantities
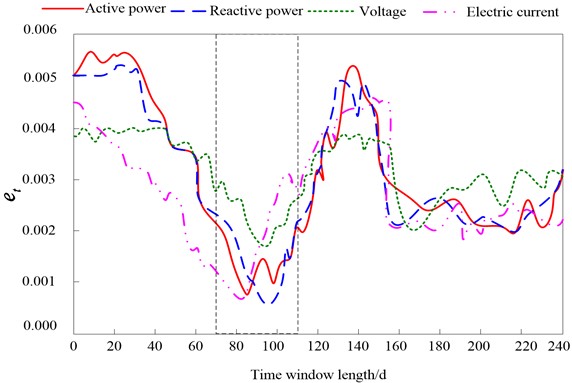
As shown in the power measurement data restoration curves in Fig. 4, all four curves exhibit a first decreasing and then increasing trend within the 70-110-day time window, and the restoration error reaches its minimum within this window length range. This interval balances the short- to medium-term cyclical characteristics of power load with sensitivity to recent data. It supplies enough historical patterns for low-rank matrix restoration while avoiding noise or outdated patterns from excessively long windows. At the same time, the restoration error curve for active power is the flattest and has the lowest value, indicating that it has the strongest periodicity and correlation and is easiest to restore using a similar terminal matrix; the errors for voltage and current are slightly higher, rising notably especially when the window is too short (< 50 days) or too long (> 130 days), reflecting that they are more affected by instantaneous disturbances and are more sensitive to the choice of window length. These results confirm that power data exhibit strong short- to medium-term cyclical correlations and demonstrate that the sliding time window mechanism proposed in this paper possesses optimal information capture and noise suppression capabilities in data restoration. This is attributed to the alignment between the window length and the periodic characteristics of the data; the 70-110-day range roughly corresponds to a time span of approximately one quarter, effectively covering seasonal load variations in the power system while avoiding the introduction of uncorrelated patterns spanning multiple years. Furthermore, the data volume within this range is moderate, satisfying the data scale requirements of low-rank matrix recovery algorithms while avoiding model degradation caused by excessive data. Therefore, this method selects [70 d-110 d] as the sliding time window size to perform power measurement data recovery and improve the accuracy of power system measurement data. In practical applications, the window length can be dynamically adjusted based on the characteristics of historical load curves (such as daily/monthly load factors, peak-to-valley ratios, and seasonal indices). For example, during summer peak load periods, the window can be appropriately shortened (e.g., to 70 days) to improve responsiveness to recent fluctuations; during periods of stable load, the window can be extended (e.g., to 110 days) to fully leverage historical periodicity. Furthermore, for larger-scale power grids (such as provincial or regional grids), window parameters can be adaptively configured across different zones by combining subsystem partitioning with parallel computing strategies, thereby improving overall processing efficiency while ensuring the accuracy of data restoration.
This paper applies the proposed method to perform multi-source fusion of active- and reactive-power measurement data at different power system buses. The correlation coefficient and the consistency coefficient are selected as metrics to evaluate the effectiveness of the multi-source fusion performed by the data middle platform introduced in this work. The correlation coefficient measures the linear relationship between two variables. For multi-source data fusion, the correlation coefficients between the fused data and each original source can be computed to assess their agreement. A value closer to 1 indicates stronger consistency; closer to 0 indicates weaker consistency; and a value near –1 implies a negative correlation. The consistency coefficient is a statistic specifically designed to quantify data agreement. In multi-source fusion, the consistency coefficients between the fused result and each source can be calculated to measure their degree of alignment. The results of the multi-source fusion of measurement data using the proposed method are presented in Table 2.
Table 2Multi-source fusion results of measurement data using the proposed method
Node | Active power | Reactive power | ||
Correlation coefficient | Consistency coefficient | Correlation coefficient | Consistency coefficient | |
Node 1 | 0.987 | 0.976 | 0.965 | 0.954 |
Node 2 | 0.972 | 0.961 | 0.958 | 0.947 |
Node 3 | 0.991 | 0.985 | 0.976 | 0.968 |
Node 4 | 0.983 | 0.972 | 0.962 | 0.951 |
Node 5 | 0.978 | 0.969 | 0.959 | 0.949 |
Node 6 | 0.993 | 0.988 | 0.981 | 0.973 |
Node 7 | 0.98 | 0.968 | 0.955 | 0.943 |
Node 8 | 0.975 | 0.963 | 0.952 | 0.94 |
Node 9 | 0.986 | 0.977 | 0.967 | 0.957 |
Node 10 | 0.979 | 0.967 | 0.956 | 0.945 |
Node 11 | 0.982 | 0.971 | 0.96 | 0.948 |
Node 12 | 0.990 | 0.984 | 0.975 | 0.966 |
Node 13 | 0.984 | 0.974 | 0.963 | 0.952 |
Node 14 | 0.976 | 0.964 | 0.953 | 0.941 |
As shown in Table 2, the correlation coefficients for active power at all nodes range from 0.972 to 0.993, while those for reactive power range from 0.952 to 0.981. This indicates that the fused data maintains a very high linear correlation with the original data from each source, demonstrating that the distributed Kalman filter fusion algorithm does not distort the trend characteristics of the original data. The active power consistency coefficients are ≥ 0.961, and the reactive power consistency coefficients are ≥ 0.941, further proving that the fusion results are highly consistent with the original data in terms of statistical distribution. In particular, the consistency coefficients for nodes 3, 6, and 12 exceed 0.98, reflecting the high measurement quality of these nodes and the sufficient redundancy of multi-source data. These results demonstrate that the distributed Kalman filter fusion algorithm proposed in this paper possesses excellent integration capabilities and can maintain high consistency and accuracy in a multi-source heterogeneous data environment. Particularly in power systems, where data from different measurement terminals and system sources often suffer from issues such as time asynchrony and inconsistent accuracy, the method proposed in this paper effectively enhances the global consistency and reliability of the data through information exchange and covariance fusion mechanisms. This is because the method achieves iterative convergence from local estimates to global optimality through the exchange of posterior covariances between adjacent sequences; furthermore, by correcting anomalies and missing data prior to fusion, it provides high-quality input for the fusion process, thereby avoiding the “garbage in, garbage out” problem.
This method employs a VB-HTree to verify the integrity of power measurement data in the power system. Using the active power measurement data from each bus as an example, the integrity verification results are presented in Table 3.
Table 3Integrity verification results of measurement data
Node number | Index of measurement data | Original hash value | Calculate hash value | Verification results |
Node 1 | 100 | d41d8cd98f00b204e9800998 | d41d8cd98f00b204e9800998 | Verification passed |
Node 2 | 50 | 50ab56b367d0193e58966f14 | 50ab56b367d0193e58966f14 | Verification passed |
... | ... | ... | ... | ... |
Node 6 | 43 | 3e25960a79dbc69b674cd4ec | 3e25960a75dbc69b374cd4bh | Verification failed |
Node 7 | 150 | a94a8fe5ccb19ba61c4c0873 | a94a8fe5ccb19ba61c4c0873 | Verification passed |
Node 8 | 220 | 2e0d6bc3d4e2404030f0b29e | 2e2d6be3d4e4604030f0b38e | Verification failed |
... | ... | ... | ... | ... |
Node 14 | 440 | e3b0c44298fc1c149afbf4c8 | e3b0c44298fc1c149afbf4c8 | Verification passed |
Analysis of the data in Table 3 shows that all buses except bus 6 and bus 8 pass verification, indicating that their data remain unchanged during storage. The hash values for bus 6 and bus 8 do not match, which triggers a verification-failure alert. This result confirms the high sensitivity and reliability of the VB-HTree in data integrity verification, enabling precise detection of tampered or corrupted data blocks. It also demonstrates the method’s effective anti-tampering capability in practical scenarios. The verification failures at bus 6 and bus 8 are not incidental; they are intentionally configured to simulate potential data anomaly conditions in real systems, thereby further proving the system's practical deployment value. This capability is realized through the hot-cold partitioning and variable-block-size mechanism proposed in this work. By distinguishing frequently accessed hot data from infrequently accessed cold data, the storage structure and verification paths of the hash tree are optimized, which improves overall verification efficiency. At the same time, the root nodes of both the hot and cold zones are stored in a trusted storage area, preventing potential tampering with the root nodes. Moreover, the irreversibility of the hash chain ensures that any modification to leaf-node data alters all hash values along its path, ultimately propagating to the root node. This guarantees that tampering attempts cannot be concealed.
To comprehensively assess the overall performance of the proposed data middle platform and VB-HTree method for power measurement data integrity verification, a series of comparative experiments are conducted. The proposed method is compared with a fixed-block hash tree (Merkle tree) and a single-source K-NN data repair approach under the same dataset and experimental conditions. The experiments quantitatively evaluate the strengths and weaknesses of each method using three core metrics: data recovery accuracy rate, integrity verification success rate, and time efficiency. Multi-source power measurement data - simulating outputs from EMS, DMS, and power plant monitoring systems - are used, including active power, reactive power, voltage, and current. Randomly injected anomalies comprise 10 % missing data, 5 % outliers, and gross errors. Under identical datasets and experimental settings, the performance of each method across the key metrics is summarized in Table 4.
Table 4Performance comparison of different methods
Method | Data recovery accuracy rate (%) | Integrity validation success rate (%) | Average verification time (ms) | Storage overhead reduction (%) |
Fixed-Length Merkle Tree (FL-Merkle) | – | 92.3 | 120.5 | 0 (Baseline) |
Single-Source KNN Repair (Single-KNN) | 85.2 | – | – | – |
Proposed Method (VB-HTree + Data Middle Platform) | 96.1 | 99.5 | 64.8 | 28.5 |
As shown in Table 4, the experimental results demonstrate that the proposed method exhibits significant advantages in multiple dimensions. First, the data recovery accuracy rate of 96.1 % represents a substantial improvement over the single-source K-NN method (85.2 %). This improvement is mainly due to the combined “isolation forest + K-NN + SVT” strategy and the multi-source data foundation provided by the data middle platform. High recovery accuracy is essential for downstream applications, as it directly increases the precision of state estimation and the reliability of fault diagnosis while reducing the risk of misjudgments caused by poor data quality. It therefore serves as a cornerstone for building trustworthy AI models in power systems.
Second, in terms of integrity verification, the proposed method not only achieves a high success rate of 99.5 % but also reduces the average verification time to 64.8 ms - approximately 46 % faster than the fixed-block Merkle tree (120.5 ms). This performance improvement has considerable practical value: shorter verification times allow the system to support more frequent periodic or trigger-based integrity audits, enabling near-real-time monitoring and alerts for data tampering. At the same time, the increased processing speed directly lowers the computational resource consumption during verification, freeing resources for core operational computations and thereby enhancing overall system efficiency.
Finally, the experiment also quantifies storage overhead. Benefiting from VB-HTree’s design, which dynamically adjusts block sizes according to data access frequency, it consolidates infrequently accessed “cold data”, effectively reducing the total number of hash tree nodes. Experimental estimates show that, for the same data volume, the hash tree structure of the proposed method reduces storage overhead by approximately 28.5 % compared with a fixed-small-block Merkle tree. This reduction not only lowers hardware storage costs but, more importantly, decreases the amount of node data that must be loaded from storage media during verification. Combined with the I/O optimizations mentioned earlier, this contributes significantly to the reduction in verification time. This characteristic makes the proposed method particularly suitable for edge-computing scenarios with constrained storage and computational resources, or for centralized platforms that need to process massive historical datasets.
From a measurement engineering perspective, the methodology presented in this paper offers notable improvements in the following respects:
Enhancing measurement system reliability: Through multi-source fusion and repair mechanisms, it effectively mitigates the impact of single-point data anomalies on the overall system, strengthening the robustness of power data in complex environments.
Optimizing measurement process efficiency: The VB-HTree structure adapts to the access locality of power data, achieving the design goal of “fast verification for hot data and resource-efficient processing for cold data,” which aligns with the smart grid requirement for real-time data processing.
Improving data traceability: By integrating digital signatures (as a scalable extension) with integrity verification, an end-to-end trusted data chain can be established. This supports rapid identification and tracing of data tampering, thereby elevating the security and operational reliability of power systems.
This approach not only enhances the quality and security of power measurement data across the entire “acquisition-transmission-storage-application” chain but also provides a scalable, efficient, and highly trustworthy data integrity assurance solution for the digital transformation of power systems.
4. Discussion
The application of the method described in this paper in actual power systems has the following significance:
1) By uniformly integrating multi-source, heterogeneous measurement data through a data middle platform and combining it with repair and fusion algorithms, the method significantly improves the availability and consistency of power measurement data, providing a high-quality data foundation for advanced applications such as state estimation and fault diagnosis.
2) The dynamic partition verification mechanism of VB-HTree adapts to the spatio-temporal locality of power data access, enabling rapid verification of high-frequency data without compromising security, thereby helping to meet the real-time requirements of smart grids.
3) The proposed architecture possesses horizontal scalability and can be adapted to scenarios of varying scales, ranging from distribution grids to transmission grids.
However, the method also has certain limitations. First, regarding computational overhead: isolation forest, K-NN clustering, and SVT matrix restoration are all computationally intensive operations. Although the distributed framework of the data middle platform can alleviate this burden, in scenarios involving the concurrent restoration of millions of smart meters, delays on the order of minutes may still occur, requiring further optimization for protection-class applications with extremely high real-time requirements. Second, regarding dependence on platform infrastructure: the data middle platform requires stable network communication, sufficient storage, and computing resources. For distribution grid nodes in remote areas or with weak communication, model simplification is still needed for lightweight edge deployment. Furthermore, the length of the sliding time window is currently determined based on experimental optimization (70-110 days) and has not yet been fully automated; the thresholds for hot/cold zones and the window width in VB-HTree also rely on empirical parameters, which may require recalibration in regions with different power load characteristics.
While these limitations do not diminish the effectiveness of the method described in this paper for conventional power data quality management scenarios, they do point to areas for improvement in practical engineering deployments.
5. Conclusions
This paper proposes a method for verifying the integrity of power measurement data using a data middle platform and a VB-HTree. The main contributions are:
An integrated “repair-fusion-verification” framework is constructed, utilizing a data middle platform to achieve unified access, cleansing, and distributed processing of multi-source heterogeneous data.
A combined “isolation forest + K-NN + SVT” repair strategy and a distributed Kalman filter fusion algorithm are designed, achieving a data repair accuracy rate of 96.1 % and a multi-source fusion correlation coefficient exceeding 0.97.
This paper proposes the VB-HTree structure, which dynamically partitions hot/cold zones and variable-block-size blocks based on access locality. While maintaining the same security level as traditional hash trees, it achieves a 99.5 % integrity verification success rate, reduces average verification time by approximately 46 %, and lowers storage overhead by 28.5 %.
However, the method in this paper also has certain limitations. For instance, it relies heavily on data middle platform infrastructure, and computation-intensive operations may introduce latency under large-scale concurrency; the sliding window length and hot/cold zone thresholds are currently set empirically and are not yet fully adaptive. Future work will focus on developing online adaptive algorithms for window length and partitioning thresholds, verifying scalability on larger-scale systems such as the IEEE 118-node system, and exploring lightweight deployment solutions for edge environments.
References
-
M. Singh, S. Ahmed, S. Sharma, S. Singh, and B. Yoon, “BSEMS-a blockchain-based smart energy measurement system,” Sensors, Vol. 23, No. 19, p. 8086, Sep. 2023, https://doi.org/10.3390/s23198086
-
J. P. Mahato, Y. K. Poudel, R. K. Mandal, and M. R. Chapagain, “Power loss minimization and voltage profile improvement of radial distribution network through the installation of capacitor and distributed generation (DG),” Archives of Advanced Engineering Science, Vol. 3, No. 4, pp. 265–273, Feb. 2024, https://doi.org/10.47852/bonviewaaes42022031
-
T. Sobot, V. Stankovic, and L. Stankovic, “Human in the loop active learning for time-series electrical measurement data,” Engineering Applications of Artificial Intelligence, Vol. 133, p. 108589, Jul. 2024, https://doi.org/10.1016/j.engappai.2024.108589
-
C. L. Zulu and O. Dzobo, “Real-time power theft monitoring and detection system with double connected data capture system,” Electrical Engineering, Vol. 105, No. 5, pp. 3065–3083, May 2023, https://doi.org/10.1007/s00202-023-01825-3
-
D. B. Khadse and G. Swain, “Data hiding and integrity verification based on quotient value differencing and merkle tree,” Arabian Journal for Science and Engineering, Vol. 48, No. 2, pp. 1793–1805, Jul. 2022, https://doi.org/10.1007/s13369-022-06961-9
-
M. N. Babitha and M. Siddappa, “An approach for data integrity authentication and protection in fog computing,” Multiagent and Grid Systems, Vol. 18, No. 2, pp. 87–105, 2022, https://doi.org/10.3233/mgs-220210
-
K. U. Maheswari, S. M. S. Bhanu, and N. Savarimuthu, “Clustering-based data integrity verification approach for multi-replica in a fog environment,” The Journal of Supercomputing, Vol. 80, No. 3, pp. 3089–3113, 2023, https://doi.org/10.1007/s11227-023-05576-7
-
A. Kc and B. Muniyal, “Dynamic list based data integrity verification in cloud environment,” Journal of Cyber Security and Mobility, Vol. 11, No. 3, pp. 433–460, Jul. 2022, https://doi.org/10.13052/jcsm2245-1439.1134
-
J. H. Khor, M. Sidorov, M. T. Ong, and S. Y. Chua, “Public blockchain-based data integrity verification for low-power IoT devices,” IEEE Internet of Things Journal, Vol. 10, No. 14, pp. 13056–13064, Jul. 2023, https://doi.org/10.1109/jiot.2023.3259975
-
W. Li, W. Susilo, C. Xia, L. Huang, F. Guo, and T. Wang, “Secure data integrity check based on verified public key encryption with equality test for multi-cloud storage,” IEEE Transactions on Dependable and Secure Computing, Vol. 21, No. 6, pp. 5359–5373, Nov. 2024, https://doi.org/10.1109/tdsc.2024.3375369
-
R. Buyya, S. Ilager, and P. Arroba, “Energy‐efficiency and sustainability in new generation cloud computing: a vision and directions for integrated management of data centre resources and workloads,” Software: Practice and Experience, Vol. 54, No. 1, pp. 24–38, Aug. 2023, https://doi.org/10.1002/spe.3248
-
V. Veeramsetty, A. Dhanush, A. Nagapradyullatha, G. R. Krishna, and S. R. Salkuti, “Power quality disturbances classification using autoencoder and radial basis function neural network,” International Journal of Emerging Electric Power Systems, Vol. 25, No. 6, pp. 817–842, Dec. 2024, https://doi.org/10.1515/ijeeps-2023-0143
-
S. Sheehan and A. Rakow, “Evolving a data center into a microgrid: industry perspectives and lessons learned,” IEEE Electrification Magazine, Vol. 11, No. 3, pp. 16–25, Sep. 2023, https://doi.org/10.1109/mele.2023.3291193
-
H. J. Guo et al., “A two-stage CP-Copula algorithm for clearing abnormal data of wind turbine,” (in Chinese), Computer Simulation, Vol. 39, No. 11, p. 85, 2022, https://doi.org/10.3969/j.issn.1006-9348.2022.11.017
-
A. Akinnubi, M. Alassad, R. Amure, and N. Agarwal, “Kg-cfsa: a comprehensive approach for analyzing multi-source heterogeneous social network knowledge graph,” Social Network Analysis and Mining, Vol. 14, No. 1, pp. 1–18, Aug. 2024, https://doi.org/10.1007/s13278-024-01320-y
-
M. Z. Kamil, F. Khan, P. Amyotte, and S. Ahmed, “Multi-source heterogeneous data integration for incident likelihood analysis,” Computers and Chemical Engineering, Vol. 185, No. Jun., p. 108677, Jun. 2024, https://doi.org/10.1016/j.compchemeng.2024.108677
-
A. Kc, B. Muniyal, and V. Parashar, “Optimizing data retrieval for enhanced data integrity verification in cloud environments,” Open Engineering, Vol. 14, No. 1, pp. 1–29, Aug. 2024, https://doi.org/10.1515/eng-2024-0058
-
J. Stanly Jayaprakash, K. Balasubramanian, R. Sulaiman, M. Kamrul Hasan, B. D. Parameshachari, and C. Iwendi, “Cloud data encryption and authentication based on enhanced merkle hash tree method,” Computers, Materials and Continua, Vol. 72, No. 1, pp. 519–534, 2022, https://doi.org/10.32604/cmc.2022.021269
-
S. Lakshmanan, B. Manimozhi, and V. Ramachandran, “An efficient and secure data sharing scheme for cloud data using hash based Quadraplet wavelet permuted cryptography approach,” Concurrency and Computation: Practice and Experience, Vol. 34, No. 27, pp. e7324.1–e7324.17, 2022, https://doi.org/10.1002/cpe.7324
-
G. Sujatha and R. Jeberson Retnaraj, “An efficient enhanced prefix hash tree model for optimizing the storage and image deduplication in cloud,” Concurrency and Computation: Practice and Experience, Vol. 34, No. 23, pp. e7199.1–e7199.19, 2022, https://doi.org/10.1002/cpe.7199
About this article

The authors have not disclosed any funding.
The datasets generated during and/or analyzed during the current study are available from the corresponding author on reasonable request.
Chao Liu: conceptualization, formal analysis. Jing Chen: methodology. Zengwei Zhang investigation. Zhuang Cui: writing-original draft preparation.
The authors declare that they have no conflict of interest.

