Abstract
To enhance the convenience of measuring unbalanced vibrations in rotating equipment and meet the on-site operation and maintenance requirements, a portable vibration and dynamic balance measurement system was designed and tested. The system, with the STM32F407VGT6 chip as its core, mainly consists of data detection module, data processing and transmission module, and terminal control and display module. The data detection module includes photoelectric sensors and vibration sensors. The data processing and transmission module incorporates optocoupler isolation, A/D conversion, and multiple communication modules. The terminal control and display module enables human-computer interaction and remote management. In terms of hardware design, circuits such as tracking band-pass filters and programmable gain amplifiers were developed to optimize signal acquisition quality. At the software level, fundamental frequency extraction algorithms including DFT were integrated to ensure accurate extraction of vibration characteristics. Experimental verification shows that the system can achieve high-precision acquisition of vibration signals and calculation of unbalance within the rotational speed range of 0-3000 rpm. The coincidence degree of fundamental frequency extraction results between the STM32 hardware terminal and the MATLAB software terminal exceeds 95 %, and data interaction and remote monitoring can be accomplished through multiple communication methods. This system meets the requirements of on-site portable operation and maintenance, providing reliable technical support for dynamic balance correction of rotating machinery.
Highlights
- The designed vibration and dynamic balance measurement system is portable and integrates vibration data detection, signal processing and transmission, and intelligent analysis.
- A signal processing solution combining multi-algorithm fusion with hardware adaptability is applied.
- Adaptive filtering and high-precision signal conditioning circuits are designed to address the key limitations of traditional fixed-frequency filters, enabling stable capture of unbalanced vibration signals at variable speeds.
1. Introduction
Rotating machinery is a core equipment in industries such as energy, chemical engineering, manufacturing and power generation [1]. During extended service periods, factors such as non-uniform rotor materials, assembly discrepancies, wear-induced deformation, and medium erosion render the rotor highly susceptible to imbalance issues [2, 3]. Approximately 40 %-50 % of vibration-related malfunctions in rotating machinery can be attributed to imbalance, a proportion significantly exceeding that of other fault types, including bearing failures, misalignments, and looseness. The cyclic centrifugal inertial force generated by imbalance can trigger equipment vibrations, thereby precipitating a series of cascading problems. Excessive vibration amplitudes can expedite the fatigue failure of vulnerable components such as bearings and seals, potentially reducing the meantime between failures of the equipment by 30 %-50 %. Unbalance in rotating machinery refers to the uneven mass distribution of a rotor relative to its rotational axis, which gives rise to unbalanced centrifugal forces during operation. Such centrifugal forces are proportional to the square of the rotational speed and generate periodic vibrations, leading to equipment wear, noise, and even structural damage over time. As a dynamic defect distinct from static eccentricity, its effects intensify with an increase in rotational speed, making it the primary source of low-frequency vibrations in rotating components. High-frequency vibrations may give rise to secondary issues, such as base loosening and leakage at pipeline connections, and in severe cases, can even culminate in catastrophic events like rotor cracking and causing rupture. Many scholars have engaged in extensive and profound research within the realm of vibration or dynamic balance measurement. Regarding system development and implementation approaches, some representative examples are as follows: Wang [4] proposed a method to improve the accuracy of unbalance identification measurement, which can use controllable electromagnets to generate controllable electromagnetic forces, synchronously attenuate unbalance vibrations, and avoid vibration signals exceeding the linear range. Duran [5] proposed a different method to evaluate the contribution of resolution to the dynamic calibration of acquisition cards, which can improve measurement uncertainty in dynamic measurements such as preliminary calibration of vibration sensors. Saarinen [6] proposed a dynamic testing method for elastic bolts, which includes a broadband exciter, two planar load blocks suspended from a heavy ceiling, vibration and force sensors, and a dual channel real-time analyzer, which can be used to predict the performance of multi-layer structures. Das [7] proposed a non-contact vibration measurement system based on laser triangulation, which uses position sensitive detectors and verifies experimental results using uniaxial and piezoelectric accelerometers. Huang [8] analyzed the prospects of high-precision absolute gravity dynamic measurement and identified the mechanisms and suppression methods of the main error sources in dynamic measurement, such as vibration noise, accelerometer drift, and carrier dynamic effects. Chinnapat [9] conducted real-time vibration measurements on an important axisymmetric brick and stone pagoda, and based on the measured vibration data, proposed reverse analysis to determine its damping and natural period in reverse. The dynamic parameters determined by the proposed method are consistent with previous research results using finite element analysis. Larsson [10] proposed a micro-roller dynamic balance testing system based on micro-electromechanical system (MEMS) accelerometers in response to the problems of existing roller testing systems. For the research on the hardware and algorithms of different detection systems, it is generally necessary to select different sensors, signal processing algorithms, and accuracy levels according to specific requirements. Table 1 presents a comparison of the parameters of two typical detection systems. It can be seen that the integration of hardware and the adaptability of signal algorithms are key factors determining system performance.
With the progression of intelligent manufacturing, the on-site operation and maintenance domain has an escalating need for portable, intelligent, and integrated testing equipment. Firstly, the equipment should feature a compact design, enabling easy transportation to confined working environments, such as equipment machine rooms and adjacent to underground mining equipment. It should also be lightweight (with a weight not exceeding 5 kg) and possess a long battery life, capable of continuous on-site operation for at least 4 hours. Secondly, it is essential to integrate vibration testing and dynamic balance correction capabilities, thereby eliminating the need for cumbersome operations involving the switching of multiple devices. Thirdly, the equipment should be equipped with intelligent functions, such as automated data analysis and the generation of fault diagnosis reports, to reduce the reliance on the operator’s professional expertise. Against this backdrop, the development of a portable vibration and dynamic balance measurement system that caters to on-site requirements emerges as a pivotal solution to address the challenges associated with the operation and maintenance of rotating machinery. The primary innovations of the research methodology are manifested in the following aspects:
(1) The designed vibration and dynamic balance measurement system is portable and integrates vibration data detection, signal processing and transmission, and intelligent analysis. It effectively solves the long-standing problems of cumbersome operation and low testing efficiency when switching between multiple traditional devices.
(2) A signal processing solution combining multi-algorithm fusion with hardware adaptability is applied. The advantage of the Discrete Fourier Transform (DFT) algorithm in fundamental frequency extraction is verified, which is more in line with the computational capacity limitations of embedded hardware.
(3) Adaptive filtering and high-precision signal conditioning circuits are designed to address the key limitations of traditional fixed-frequency filters, enabling stable capture of unbalanced vibration signals at variable speeds. Additionally, by integrating a 16-bit ADS8509 analog-to-digital converter (ADC) with a programmable gain amplifier, high-precision acquisition of weak vibration signals is achieved, significantly improving the signal-to-noise ratio (SNR), and outperforming traditional signal acquisition devices in terms of performance.
Table 1Comparison of key parameters across different detection systems
Literature | Core functionality | Signal processing algorithms | Sensors and accuracy levels | Limitations |
[11] | The control of the system relies on the digital signal output of the STM32 microcontroller and the signal processing of external modules such as DACs and power amplifiers. The conversion from electrical energy to mechanical energy (vibration drive) is achieved through the inverse piezoelectric effect of piezoelectric ceramics, which act as actuators rather than sensors | The core algorithm is derived from the instruction set, such as the arm_sin_f32 function, which is used to generate sine waveforms. It relies on mathematical calculations rather than pre-stored data tables, thereby optimizing the utilization of computational resources | The DAC8311 module supports a resolution of 14 bits, a sampling rate of 225 kHz, and a gain error of 0.15 % | The system relies on specialized chips such as STM32 for its functionality. Although the hardware structure has been simplified, it still requires multi-module coordination, and the integration level needs to be improved. Without a sensor feedback loop (such as real-time monitoring of vibration displacement and frequency), the control accuracy may be affected by factors such as environmental temperature and load variations |
[12] | The system, centered around the STM32F4, integrates an improved P-wave pickup algorithm with dynamic environmental thresholds, enabling the continuous acquisition of vibration data. During data storage, only relevant vibration signals are retained, minimizing the storage of irrelevant data and thus enhancing work efficiency | The core algorithm is an improved P-wave picking algorithm based on environmental dynamic thresholds, which can enhance anti-interference capability and avoid the dependence of the traditional STA/LTA algorithm on trigger threshold selection | The moving-coil geophone has a natural frequency ranging from 4.5 Hz to 100 Hz (with an error of ±2.5% to ±10%) and an open-circuit sensitivity of 28.8 V/m/s to 150 V/m/s (with an error of ±5 %) | It is difficult to verify the adaptability of the algorithm to extremely complex environments (such as strong background noise and atypical seismic waves), and the dynamic threshold adjustment strategy has insufficient stability in long-term continuous monitoring |
2. The overall design plan of the measurement system
2.1. Analysis of working principle
For vibrations with small displacements, supporting components such as bearings and bases exhibit linear characteristics, that is, they follow Hooke’s law. Therefore, the rotor-support system is assumed linear, meaning its vibration response satisfies the superposition principle. The total response to multiple excitations (unbalances) equals the sum of responses to each excitation individually. The schematic diagram of the unbalanced shaft support system is presented in Fig. 1. For linear systems, vibration amplitude is proportional to the unbalance force. Thus, the vibration from (Plane 1) and (Plane 2) can be summed directly.
Suppose that and are respectively the equivalent unbalance amounts on the two correction surfaces of the rotor. When the rotor rotates at a specific speed, the vibration amplitudes and at the two support points can be measured respectively. Based on the assumption of a linear system and the principle of superposition, it can be concluded as followed:
where and respectively represent the vibration caused by the unit unbalance quantity of the correction plane 1 on the left and right supports, and and respectively represent the vibration caused by the unit unbalance quantity of the correction plane 2 on the left and right supports.
To better represent linear features, Eqs. (1-2) can be expressed in matrix form as follows:
The core objective of rotor dynamic balancing is to solve for the unbalance values and . By performing an inverse operation on the aforementioned matrix relationship, it can be expressed as:
Fig. 1Schematic diagram of the unbalanced shaft support system
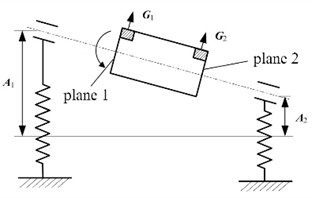
Fig. 2Schematic diagram of dynamic balance positioning
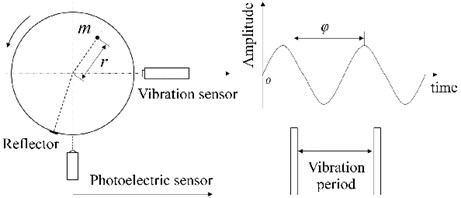
The double-sided balancing principle decomposes the rotor unbalance into two well - defined correction planes. By measuring the fundamental frequency signals of the two support pendulum frames, the magnitude of the unbalance mass on the correction planes can be computed. The vibration signal acquired by the vibration sensor solely contains amplitude information. To fully solve for the phase of the vibration signal, it is necessary to further determine a reference signal. In the dynamic balancing test, the reference signal is captured by a photoelectric sensor [13, 14]. A reflective patch is affixed to a specific location on the rotor. Each time the photoelectric sensor irradiates the reflective patch, a response is generated. This response is output from the sensor's output line in the form of a pulse signal. The digital processor utilizes the obtained pulse signal as the reference signal to facilitate subsequent calculations. The generation of each reference signal indicates one full rotation of the rotor. By calculating the time interval of the reference signals, the rotational speed of the rotor can be determined. The schematic diagram of this principle is presented in Fig. 2. The frequency of the reference signal is not only equivalent to the rotational speed frequency but also identical to the vibration frequency of the supporting pendulum frame. Thus, the reference signal can be employed to calculate the rotor’s rotational speed and serves as a crucial foundation for determining the phase of the vibration signal.
The simple harmonic vibration in the horizontal direction mirrors the circular motion of the unbalanced mass position of the rotor over time during rotation [15, 16]. Based on the actual installation location of the vibration sensor, when the unbalanced mass rotates to the horizontal position, the displacement of the pendulum frame reaches its maximum value, and the vibration signal of the displacement sensor attains its peak. If, at this moment, the installation location of the photoelectric sensor coincides with that of the displacement sensor, after the reflective patch on the rotor is detected by the photoelectric sensor and a reference signal is generated, the phase formed by the vibration signal of the displacement sensor relative to the reference signal represents the actual phase of the unbalance.
The position selection of the reflective patch should be determined based on ensuring the accuracy of rotational speed and phase detection, adapting to on-site operating conditions, and facilitating calibration and maintenance. The selection should prioritize a smooth, uniform area on the rotor’s cylindrical surface without structural defects, avoiding welds, and regions with concentrated unbalanced mass. It is critical to ensure that the rotational trajectory of the reflective patch falls within the effective detection range of the photoelectric sensor with an appropriate distance maintained between them. Meanwhile, the reflective patch should be aligned with the vibration sensors on the same radial plane to improve the accuracy of phase calculation and minimize interference with the rotor’s inherent unbalance state.
2.2. System functions and components
The portable vibration and dynamic balance measurement system is composed of three modules, as shown in Fig. 3. The data detection module, as the perception front-end, includes a photoelectric sensor and a vibration sensor. The photoelectric sensor uses a non-contact measurement method to avoid interfering with the operation of the rotor and can quickly and accurately capture the speed and phase information of rotating machinery, providing a benchmark for dynamic balance phase analysis, and is suitable for dynamic parameter collection of high-speed rotating equipment. The vibration sensor (such as an acceleration type) is very sensitive to vibration changes and can collect analog vibration signals of the equipment. Since vibration is a direct manifestation of mechanical imbalance, these signals can provide raw data for subsequent imbalance calculation, so sensors that can accurately restore vibration characteristics are selected. The photoelectric sensor emits a light beam of a specific wavelength that continuously irradiates the rotor surface. As the rotor rotates, the reflective patch rotates with it and reflects the light beam back to the sensor once per revolution. Upon receiving the reflected light, the sensor outputs a pulse signal, which serves as the reference signal. The rotational speed of the rotor can be obtained by calculating the time interval of the pulse signals, and the vibration phase can be determined by the timing relationship between the pulse signals and vibration signals. Throughout the entire process, an air gap is maintained between the photoelectric sensor and the rotor at all times, with no mechanical contact whatsoever.
Fig. 3Composition of functional modules of the measurement system
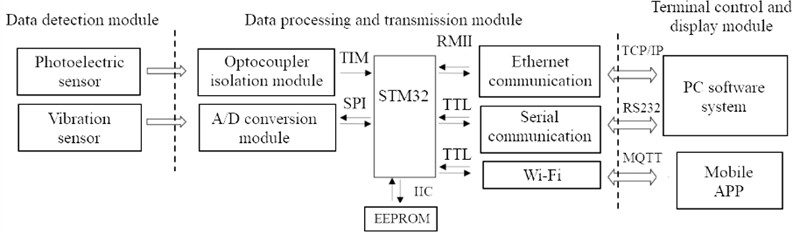
The data processing and transmission module is the core of calculation and communication, centered on the STM32 main control chip, and matched with an optocoupler isolation module, an A/D conversion module, multiple communication modules and EEPROM. The optocoupler isolation module performs electrical isolation on the digital signal of the photoelectric sensor to block external electromagnetic interference and ensure the transmission accuracy of speed and phase signals. The optocoupler isolation technology is adopted to enhance the anti-interference ability of digital signals and prevent timing distortion caused by clutter. The A/D conversion module can convert the analog signal of the vibration sensor into digital signal. Because the STM32 needs to perform algorithm operations such as DFT and imbalance calculation based on digital signals, an A/D converter with high resolution and high sampling rate is selected to accurately quantify vibration details and restore the real vibration state. It should be noted that high resolution is not a vague description but is based on specific hardware parameters and performance metrics. The STM32 chip relies on high-performance computing power, rich peripheral interfaces (TIM, SPI, IIC, etc.) and low-power characteristics to efficiently coordinate data collection, calculation and multi-module communication, and becomes the core of the embedded system. The terminal control and display module serves as the interaction hub of the system. It connects upper-level applications through multiple communication protocols to achieve data visualization, remote control, and intelligent analysis. This module consists of a PC software system and a mobile APP, which interact with the data processing and transmission module through three types of communication protocols. Ethernet communication (TCP/IP) is used to connect to the PC software system, supporting high-speed and large-bandwidth data transmission, and is suitable for big data analysis in laboratory scenarios (such as vibration signal spectrum analysis and historical data storage). Serial communication (RS232) is compatible with traditional industrial control equipment, meeting the connection requirements of legacy systems and ensuring compatibility with the dynamic balance testing of existing rotating equipment. Wi-Fi communication (MQTT) is used to connect to the mobile APP, enabling wireless and mobile on-site operations (such as real-time viewing of vibration amplitudes and remote start/stop of tests), and is well-suited for portable maintenance scenarios in industrial environments. Besides, EEPROM is connected to the STM32 through the IIC interface to store key parameters such as sensor calibration coefficients and equipment configurations, and the data is not lost when the power is off, ensuring the consistency of parameters every time the system starts. Therefore, EEPROM with persistent storage capability is selected. In the portable vibration and dynamic balancing measurement system, the requirements for the EEPROM are mainly reflected in its durable storage capacity, which is dedicated to storing key system parameters to ensure parameter consistency throughout the entire power cycle. In addition, no data loss occurs when the system is powered off. This ensures that the system can directly call the pre-stored calibration coefficients and configuration parameters each time it is started.
2.3. Digital signal processing algorithms
To adapt to different testing conditions, the system needs to integrate different processing algorithms for vibration signals. In the unbalanced vibration signal from the sensor, the effective component is mainly the fundamental frequency signal [17]. To facilitate the theoretical analysis of the extraction algorithm, the fundamental frequency signal is simplified to a sine signal. Its expression is as:
where represents the amplitude of the vibration signal, represents the angular frequency, represents the phase angle. The purpose of the extraction algorithm is to accurately calculate the values of the amplitude and the phase angle.
(1) Integration method.
The integral method utilizes the integral characteristics of sine signals within specific time intervals. By performing integral operations in two different intervals, it constructs a system of binary equations to solve for parameters. Its core advantage lies in its low computational complexity and compatibility with embedded hardware, such as STM32. It is suitable for low-noise, stable vibration scenarios. However, its limitation is its sensitivity to noise, which can easily lead to interference and error amplification.
The principle of the integration method is to perform integration in two different intervals. Select two non-overlapping half-period intervals, and integrate them separately as follows:
Assuming , after substituting it into the integral formula, the following formula can be derived:
According to the relationship between period and frequency, it can be concluded:
Using the same method, in the interval [/4, 3/4], it can be integrated to obtain:
The solution can be obtained as follows:
(2) Correlation method.
As an efficient technical method for separating and extracting target useful signals in a strong noise environment, the core applicable premise of the cross-correlation analysis method lies in the assumption that the rotor and support system satisfy linear characteristics. Given the unique frequency preservation law of linear systems, namely that the vibration response generated by the system under the action of excitation at a specific frequency only retains signal components consistent with the excitation frequency and does not derive new frequency components, relevant operations can be carried out accordingly. By calculating the cross-correlation function between the vibration excitation source signal and the system's vibration response signal, it is possible to accurately lock in the amplitude parameters and phase information of the vibration response, while greatly weakening the interference of irrelevant noise, and ultimately achieving the pure extraction of useful signals.
Assume that the expressions of a standard sine wave and a cosine wave within the range [0, ] are respectively as:
The relevant function can be expressed as:
According to the trigonometric identity:
Let , , it can be derived as followed:
Using the same method, it is also derived that:
The amplitude and phase of the sine signal can be solved to be:
(3) DFT method.
The DFT (Discrete Fourier Transform) method is a core technology for converting discrete time-domain signals to the frequency domain for analysis. It is widely used in scenarios such as spectrum analysis of vibration signals and extraction of frequency components. It is especially suitable for identifying the fundamental frequency and harmonic components from noisy vibration signals.
The definition of the DFT of an -point sequence can be expressed as:
Define the rotation factor as:
Let represent the fundamental frequency component of the DFT, which can be expressed as:
According to Euler’s formula:
It can be further obtained that:
It is written in the standard complex form as:
If is a periodic continuous-time function with a period of , then the periodic signal can be expanded as a Fourier series as follows:
Suppose is the sampling interval, and let , then it can be concluded that:
In the vibration and dynamic balance testing system, the effective unbalanced vibration signal to be extracted is the fundamental wave. The solution results of the amplitude and phase of the fundamental wave are:
In order to simulate the actual vibration signal more accurately, it is assumed that the general expression form of the vibration signal is:
where represents the DC component, and respectively represent the amplitude and phase of the fundamental frequency component, and respectively represent the amplitude and phase of the 2nd harmonic, and respectively represent the amplitude and phase of the 3rd harmonic, represents random noise.
Let 3 mm, 9 mm, 30°, 3 mm, 20°, 3 mm, 20°, then the extraction results of the amplitude and phase of the fundamental frequency under different signal processing algorithms can be obtained as shown in Table 2. It can be seen that under this vibration condition, the DFT algorithm has better control over detection accuracy. When the DFT algorithm solves the amplitude and phase, it only needs to calculate the fundamental wave instead of points, which can greatly reduce the calculation time and effectively suppress high-frequency interference. In practical test applications, it is found that when the number of sampling points is an integer multiple of the signal period, the calculation accuracy can be improved, but it will also greatly increase the requirements for hardware.
Table 2Composition of functional modules of the measurement system
Processing algorithm | Extracted amplitude / mm | Extracted phase / ° | Amplitude deviation / % | Phase deviation / % |
Integration method | 9.488 | 32.871 | 5.33 | 9.57 |
Correlation method | 8.956 | 31.036 | 0.49 | 3.45 |
DFT method | 9.012 | 30.173 | 0.13 | 0.58 |
3. Design of key hardware circuit
3.1. The main control unit
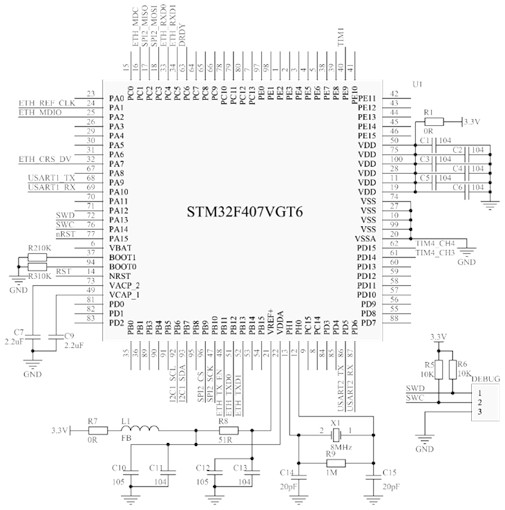
The STM32F407VGT6 chip acts as the main control unit in the portable vibration and dynamic balance measurement system, exhibiting excellent performance in function, application scenarios, and reliability. The schematic diagram of the minimum system is shown in Fig. 4. In terms of function, it is built on the Cortex-M4 core with an FPU (Floating-Point Unit) and can reach a main frequency of up to 168 MHz, delivering robust computing capabilities. For vibration and dynamic balance measurement, it efficiently manages multi-sensor data acquisition and complex algorithms: it can cooperate with high-speed ADCs (either external high-precision AD modules or its own ADC with enhanced precision) to rapidly sample analog signals from vibration sensors; for speed and phase signals from photoelectric sensors, it accurately captures and counts them via timers (TIM), providing a reference for phase analysis in dynamic balance. Meanwhile, it integrates abundant peripherals like SPI, I2C, Ethernet, and USB, which can flexibly connect to A/D conversion modules and communication modules (Ethernet, serial port, Wi-Fi) to enable efficient data transmission to PCs or mobile terminals.
For application scenarios, portable vibration and dynamic balance measurement demands devices to be compact, low-power, and have sufficient computing power. Compared with some dedicated DSPs, such as the TMS320 series, it has lower power consumption, making it fit for battery-powered portable devices; at the same time, its computing power is better than that of traditional 8-bit/16-bit microcontrollers, such as C8051F and MSP430. It can run algorithms like FFT (Fast Fourier Transform) in real time to conduct spectrum analysis on vibration signals and quickly calculate the amplitude and phase of unbalance, meeting the needs of on-site rapid diagnosis and instant correction. In terms of reliability, STM32 series chips have strong anti-interference ability, which allows them to work stably in the electromagnetic interference environment of industrial sites. The chip is equipped with a complete power management and protection mechanism. Together with peripheral power filtering and decoupling capacitors, such as the power conditioning part composed of capacitors and inductors in the circuit, it can further improve power stability and ensure the accuracy of data acquisition and calculation. In addition, rich error detection and processing mechanisms, such as watchdog and bus fault tolerance, can reduce system crashes caused by abnormalities, ensuring that portable devices can operate reliably for a long time in various environments such as outdoors and workshops.
Fig. 4The schematic diagram of the minimum system of main control unit
3.2. Signal conditioning and filtering circuits
To address the common issues in different application scenarios, such as high-frequency effective signals being contaminated by low-frequency interference, low-frequency core signals being drowned out by high-frequency interference, and effective signal frequency deviation caused by rotational speed changes, the active high-pass filter circuit, second-order active low-pass filter circuit, and tracking band-pass filter circuit were designed.
The schematic diagram of the active high-pass filter circuit is shown in Fig. 5. It is composed of an operational amplifier, a coupling capacitor , and a resistor , with the operational amplifier connected as a voltage follower. The capacitive reactance of the capacitor varies with the signal frequency: the higher the frequency, the smaller the capacitive reactance; the lower the frequency (including direct current), the larger the capacitive reactance. Therefore, the high-frequency vibration components in the input signal can be coupled to the non-inverting input terminal of the operational amplifier through , while low-frequency interference or DC drift will be blocked due to the large capacitive reactance of . As a voltage follower, the operational amplifier can maintain the signal amplitude unchanged, and it has extremely high input impedance and extremely low output impedance, playing a role in buffering and isolation to stably drive the subsequent circuit. In the portable vibration and dynamic balance test system, the vibration caused by mechanical unbalance is mostly high-frequency signals, and the low-frequency interference and DC drift existing in the test process will interfere with the measurement. By virtue of its high-pass characteristic, this circuit filters out effective high-frequency vibration signals, suppresses low-frequency components, improves the signal-to-noise ratio of the signal, and makes the subsequent analysis of key parameters such as vibration amplitude, frequency, and phase more accurate, thereby ensuring the reliability of the dynamic balance test. The cut-off frequency of the active high pass filter is less than 1Hz, and the operational amplifier uses OP07CP with a matching resistor 100 kΩ and coupling capacitor 1.6 μF. The operational amplifier is connected in a voltage follower structure. The effective signal of unbalanced vibration (fundamental frequency 0-50 Hz, high-order harmonics ≤ 150 Hz) is the core and needs to be preserved intact. The selection logic is that the cutoff frequency of 1 Hz is lower than the lowest fundamental frequency (100 rpm corresponds to a fundamental frequency of ≈ 1.7 Hz) to avoid effective signal attenuation. At the same time, it should be higher than the low-frequency interference frequency to ensure interference attenuation of ≥ 20 dB.
Fig. 5Active high-pass filter circuit
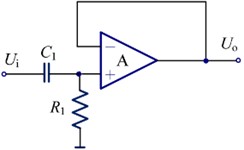
Fig. 6Second-order active low-pass filter
The principle of the second-order active low-pass filter is shown in Fig. 6. It is composed of an operational amplifier, resistors (such as , , ) and capacitors (such as , ), adopting a structure that combines a two-stage RC low-pass network with an operational amplifier. The operational amplifier is connected in a non-inverting amplification configuration and forms a negative feedback network through and . The capacitive reactance of the capacitor changes with the signal frequency: the lower the frequency, the larger the capacitive reactance, and the smaller the obstruction to low-frequency signals; the higher the frequency, the smaller the capacitive reactance, and the larger the obstruction to high-frequency signals. In the input signal , the low-frequency vibration components have extremely small attenuation in the two-stage RC network due to the large capacitive reactance of and , and can be smoothly transmitted to the non-inverting input terminal of the operational amplifier, then output after being amplified by the operational amplifier. The high-frequency interference components are greatly attenuated in the RC network due to the small capacitive reactance, and it is difficult for them to be effectively input to the operational amplifier, so they are suppressed.
To accurately suppress high-frequency noise, the cut-off frequency of the second-order active low-pass filter is set to 300 Hz, with resistors 10 kΩ and capacitors 5.3 nF. The filter adopts a structure composed of two-stage RC low-pass networks and a non-inverting amplification circuit, and a negative feedback network is formed by and . For 1 kHz high-frequency interference, the attenuation of the filter is no less than 40 dB, and the amplitude distortion in the passband is no more than 0.2 %. The selection rationale is that the 300 Hz cut-off frequency covers the entire effective signal bandwidth, the attenuation rate of the second-order structure reaches –40 dB/decade, and the cut-off frequency is far lower than the Nyquist frequency of the ADC, thus preventing signal aliasing.
In the portable vibration and dynamic balance testing system, the vibration caused by mechanical unbalance is mostly low-frequency signals, such as the fundamental frequency vibration of rotating components, whose frequency matches the rotational speed, while there are high-frequency interferences in the testing process, such as electromagnetic noise and high-frequency mechanical clutter. This filter allows the low-frequency vibration signals related to dynamic balance to pass smoothly through its low-pass characteristic, while greatly attenuating high-frequency interferences, thereby purifying the useful low-frequency vibration signals. The steep filtering characteristic of the second-order structure can further suppress high-frequency noise, improve the signal-to-noise ratio of the signal, make the subsequent analysis of key parameters such as vibration amplitude, frequency, and phase more accurate, provide a reliable basis for dynamic balance calculation, and ultimately ensure the accuracy of dynamic balance testing and correction.
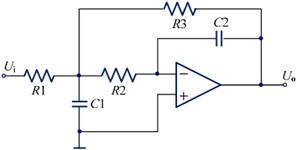
The schematic diagram of the tracking band-pass filter circuit applied to the vibration and dynamic balance testing system is shown in Fig. 7. Its principle is based on an active filtering structure and dynamic frequency tuning technology, and its functions are usually realized through a switched capacitor network or a specialized frequency tracking module. The circuit can real-time monitor the characteristic frequency of mechanical vibration (such as the fundamental frequency of unbalanced vibration related to rotational speed) and dynamically adjust the center frequency of the band-pass filter through a control signal, so that the center frequency is always consistent with the target characteristic frequency. At the same time, the frequency selection network of the circuit is composed of resistors, capacitors, operational amplifiers, etc., allowing only signals within a specific bandwidth near the center frequency to pass through, and effectively attenuating non-target signals such as low-frequency noise and high-frequency electromagnetic interference that deviate from this range. In vibration and dynamic balance testing, the rotational speed of mechanical rotating components often changes, causing the characteristic frequency of vibration caused by unbalance to change accordingly. Traditional band-pass filters with fixed center frequencies are difficult to stably capture target signals. This tracking band-pass filter circuit dynamically tracks changes in the characteristic frequency to ensure that vibration signals related to dynamic balance are always within the passband, completely retaining key information such as signal amplitude and phase; at the same time, it greatly suppresses irrelevant interference, significantly improves the signal-to-noise ratio of the signal, provides high-quality signals for subsequent vibration parameter analysis and dynamic balance calculation, and ensures the accuracy and stability of testing and calibration.
Fig. 7The schematic diagram of the tracking band-pass filter circuit
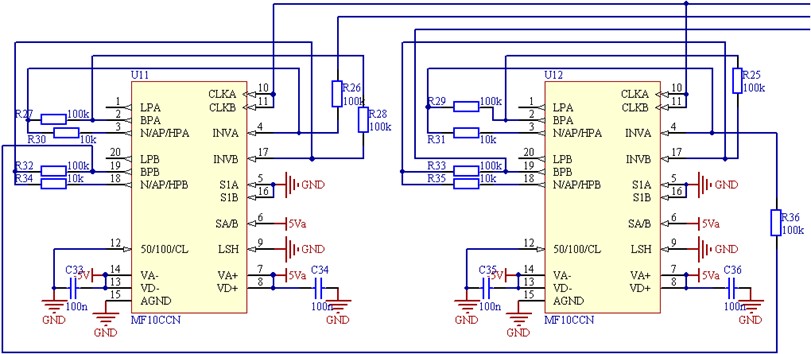
The center frequency tracking range of the tracking band-pass filter is 0-50 Hz, which achieves real-time synchronization with the fundamental frequency of the rotor. The core chip is the switched-capacitor filter MF10CCN, with the matching capacitors as 100 nF. The ratio of the clock frequency to the center frequency is set to 100:1. When the rotational speed changes, non-target frequency interferences (e.g., the resonant frequencies of other components) may intersect with the fundamental frequency, which tends to cause signal loss in fixed-bandwidth filters. The selection rationale is that the center frequency is calculated in real time based on the rotational speed fed back by the photoelectric sensor (the STM32 microcontroller controls the clock frequency of the MF10CCN), realizing full synchronization with the fundamental frequency. This design not only ensures no signal loss but also suppresses interferences at adjacent frequencies.
3.3. Sampling and amplification circuit
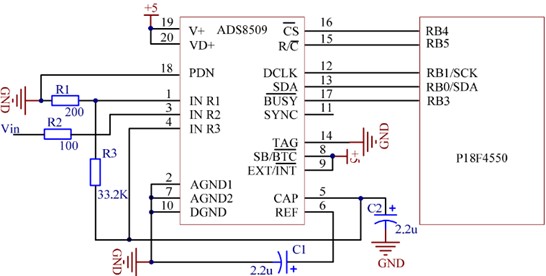
Since dynamic balance testing requires high-precision capture of weak vibration signals, the ADS8509 model analog-to-digital converter (ADC) is selected for the data processing module. The 16-bit resolution of the ADS8509, combined with its ±2 LSB integral nonlinearity (INL), can accurately quantify subtle differences in vibration signals. Its 88 dB signal-to-noise ratio (SNR) effectively suppresses circuit noise and environmental interference, preventing weak vibration characteristics from being drowned out by noise. The ADS8509 supports a programmable input range, allowing direct connection to sensor outputs without the need for additional signal attenuation/amplification circuits. This reduces the number of peripheral components, which is crucial for portable systems. With a sampling rate of 250 kSPS, the ADS8509 can meet the real-time acquisition requirements of high-frequency vibration signals (e.g., below 100 kHz), ensuring that transient characteristics of vibration signals (such as step-like amplitude changes and frequency shifts) are not missed when rotational speed changes abruptly. When combined with the tracking band-pass filter circuit in the system, it can efficiently capture dynamically changing target vibration frequencies, ensuring continuous testing over a wide rotational speed range.
The conditioned analog vibration signal is input to the ADS8509, with the wiring diagram shown in Fig. 8. The microcontroller sends control signals via the SPI interface to start the conversion. The input analog vibration signal undergoes attenuation/voltage division through a resistor network, so that the signal amplitude adapts to the programmable input range of the ADS8509 (such as single-ended 0~5V or differential mode). This ensures that the analog vibration signal can be effectively acquired by the ADC, avoiding conversion errors caused by over-range or under-range. The ADS8509 communicates with the P89C550 microcontroller via the SPI protocol, enabling the process of starting conversion and reading data. DCLK is provided with the SPI clock by RB1/SCK of the P89C550, synchronizing the ADC's conversion and data transmission. SDI sends control commands (such as channel selection and conversion mode configuration) to the ADS8509 via the microcontroller. SDI can serially output the digital conversion results to the microcontroller. SYNC is controlled by RB3 of the P89C550, used to synchronously start the ADC conversion and ensure the timing consistency of vibration signal acquisition.
Fig. 8Interface circuit diagram of ADS8509
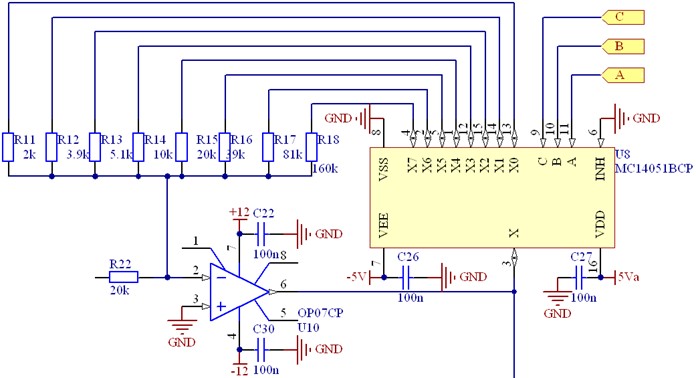
The programmable gain amplifier circuit, as shown in Fig. 9, consists of a high-precision operational amplifier OP07CP, a multi-channel analog switch MC14051BCP, and a resistor network. The operational amplifier forms an inverting amplification structure, and the input vibration signal is sent to the inverting input terminal of the operational amplifier through a resistor. The multi-channel analog switch can select the resistor connected to the feedback loop through control signals; when different resistors are switched, the amplification gain changes accordingly, thereby achieving multi-level gain adjustment. In vibration and dynamic balance testing, due to the large dynamic range of vibration signal amplitude, this circuit can adaptively switch gain levels according to the strength of the signal. It amplifies weak vibration signals to an appropriate amplitude, or adjusts large-amplitude signals to a range collectible by the analog-to-digital converter, avoiding signal under-sampling or overload and improving acquisition accuracy. At the same time, it can adapt to different sensors and testing conditions only through software control without replacing hardware, enhancing the system's versatility. Moreover, the high-precision characteristics of the operational amplifier can ensure that key characteristics of the vibration signal such as amplitude and phase are not damaged during amplification, providing an accurate signal basis for subsequent dynamic balance analysis.
The rated real-time performance of the system mainly covers the data acquisition and signal processing stages. Time calculation is based on the system's maximum load (rotational speed: 3000 rpm, fundamental frequency: 50 Hz) to ensure that real-time performance requirements are met under all operating conditions. The ADC sampling rate is 250 kSPS, and the DFT algorithm requires an integer number of sampling points within a single signal period; a fundamental frequency of 50 Hz corresponds to a period of 20 ms. With 1024 sampling points selected, the calculated data acquisition time is 4.096 ms (approximately 4.1 ms). Given that the core frequency of the STM32F407 is 168 MHz and the FPU takes about 8 clock cycles to process one complex multiplication and addition operation, the signal processing time (total clock cycles/core frequency) is approximately 0.488 ms (about 0.5 ms). The maximum rotational speed of 3000 rpm corresponds to a fundamental frequency period of 20 ms, and the total response time (4.6 ms) is much shorter than one signal period, resulting in no phase lag and satisfying the requirements for real-time correction of dynamic balance.
Fig. 9Programmable gain amplifier circuit
The minimum hardware specifications of the system are as follows: a processor speed of no less than 50 MHz (based on a Cortex-M4 or higher core with an FPU), a RAM capacity of no less than 64 KB, and a ROM capacity of no less than 512 KB. In this system, the STM32F407VGT6 is adopted, which features a 168 MHz core frequency, 192 KB of RAM and 1 MB of ROM. Its performance far exceeds the minimum requirements, thus ensuring the stable operation of the system under complex operating conditions.
3.4. Ethernet communication circuit
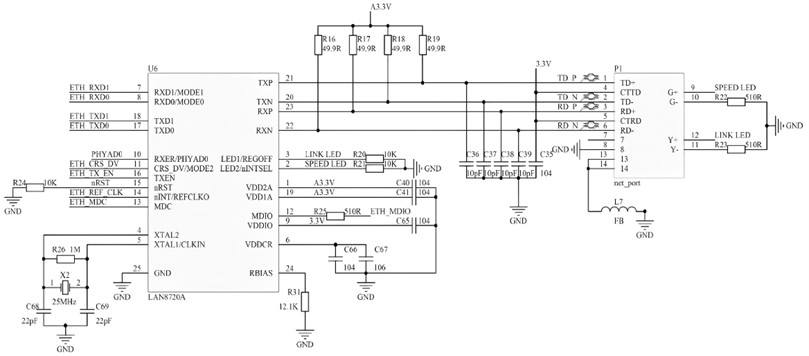
Ethernet communication, as one of the key communication solutions of the system, mainly works through the collaboration of an Ethernet controller, a network transformer, and an RJ45 interface. Vibration data collected by the system (such as amplitude, frequency, phase, etc.) is encapsulated into Ethernet data packets. After being processed by the Ethernet controller, these packets are transmitted to the network transformer via differential signals (TX+/TX-, RX+/RX-), achieving signal isolation, common-mode interference suppression, and differential impedance matching, and then sent to the external Ethernet network through the RJ45 interface, as shown in Fig. 10. At the same time, external control commands (such as test parameter configuration, start-stop commands) can also be transmitted back to the system via Ethernet, enabling bidirectional data interaction.
In the vibration and dynamic balance testing system, the Ethernet communication circuit enables high-speed data interaction between the system and external networks [18]. It can transmit on-site vibration data in real-time to remote computers, servers, or cloud platforms, supporting collaborative analysis across multiple devices and centralized data storage, and facilitating remote monitoring of the dynamic balance status of distributed rotating equipment. By receiving remote commands via Ethernet, test parameters can be adjusted without on-site operation, improving the operational convenience and intelligence level of the portable system in complex environments and adapting to unattended or remote operation and maintenance scenarios. Since Ethernet is a mainstream communication standard in the industrial field, this circuit allows the testing system to seamlessly connect to the factory Ethernet, interact with different industrial systems, integrate into the industrial automation system, and facilitate collaborative control of vibration monitoring and production processes. In addition, it provides a transmission channel for big data analysis of vibration data and AI-based fault diagnosis [19-21]. Massive on-site data can be uploaded to the cloud, and complex dynamic balance algorithm optimization and fault prediction can be carried out using cloud computing power, breaking through the limitations of the local computing power of portable devices and expanding the application depth and scenarios of the system.
Fig. 10Schematic diagram of Ethernet communication circuit
4. System testing and data analysis
4.1. The setting of system test conditions
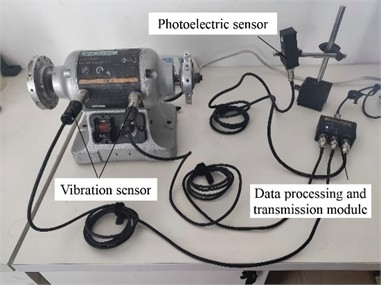
To verify the reliability of the designed measurement system, vibration characteristic detection and dynamic balance analysis are conducted on rotating machinery, as shown in Fig. 11. The vibration sensor is installed at the bearing seat of the rotating machinery to collect vibration signals during the operation of the equipment. The photoelectric sensor is aimed at marks on the rotor (such as reflective spots), which is used to measure the rotor speed and can also determine the phase of vibration, providing phase reference for dynamic balance analysis. The data processing and transmission module can receive signals from the vibration sensor and photoelectric sensor, perform processing such as amplification and filtering, and then transmit data for subsequent analysis, thereby determining the source of vibration and the distribution of unbalance.
Table 3Experimental test conditions and parameters
Parameter | Speed range (r/min) | Acceleration range (g) | Speed measurement accuracy (r/min) | Phase resolution (degree) |
Value | 0-3000 | 0-20 | 1 | 0.5 |
Experimental test conditions and parameters are shown in Table 3. The measurement range of the vibration sensor covers the possible vibration range of the equipment, and its frequency response range is 0-10 kHz, which can ensure capturing vibration in the entire frequency band. The sampling frequency satisfies the Nyquist sampling theorem, that is, the sampling frequency is greater than or equal to twice the highest vibration frequency.
As the sensing front-end of the data detection module, the photoelectric sensor and vibration sensor undertake the core task of collecting key operational data of the rotor, and their functionalities are complementary and targeted to ensure accurate and stable signal acquisition. The photoelectric sensor is mainly used to capture the pulse signals generated by the reflective patch on the rotor, with its core characteristics including a fast response speed, strong anti-interference capability, and high signal stability. It operates based on the photoelectric induction principle: as the reflective patch rotates with the rotor, the sensor rapidly detects changes in reflection, converts mechanical rotation information into electrical pulse signals in real time, and features a high response frequency to adapt to different rotational speeds of the rotor, ensuring no pulses are missed or falsely triggered even at high rotational speeds. The vibration sensor is typically an accelerometer mounted on the rotor’s bearing housing, which is characterized by high sensitivity, a wide measurement range, and strong compatibility with vibration analysis. It has extremely high sensitivity to the rotor’s micro-vibrations and can capture subtle vibration changes caused by rotor unbalance, misalignment or wear, converting mechanical vibration quantities into high-precision measurable electrical signals. In addition, it exhibits excellent environmental adaptability, being able to resist the effects of on-site electromagnetic interference and temperature fluctuations, and output continuous and stable vibration data.
Fig. 11Installation diagram for dynamic balance testing. Photo by Jianhua Liu at the Vibration Balance Laboratory on September 11, 2025
4.2. Fundamental frequency extraction based on MCU
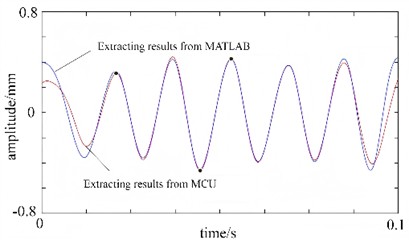
A segment of the vibration time-domain waveform of the motor spindle under actual operating conditions is captured, with a time span from 0 to 0.1 seconds, as shown in Fig. 12. The waveform contains both periodic fundamental frequency vibrations caused by rotor imbalance, superimposed with harmonic components generated by mechanical friction and random noise from electromagnetic interference, presenting complex non-stationary characteristics overall. This also highlights the technical challenge of extracting pure fundamental frequency from mixed signals. To verify the reliability of the system test, the fundamental frequency extraction results from MATLAB and the MCU are compared, as shown in Fig. 13. It can be seen that the two are highly consistent in overall trend, but local details still reflect the characteristics of different algorithms. When MATLAB uses the EMD algorithm, it first adaptively decomposes the original signal into multiple IMF components and reconstructs the signal by screening IMF components containing fundamental frequency energy. Therefore, the curve shows smoother peak transitions at periodic nodes such as 0.02 seconds and 0.04 seconds, which can better fit the nonlinear tiny fluctuations of the fundamental frequency component in the original signal. This benefits from EMD’s adaptability to non-stationary signals. When the MCU uses the DFT algorithm, it converts the time-domain signal to the frequency domain through fast Fourier transform, locks the spectral peak corresponding to the fundamental frequency, and then inverts it to obtain the time-domain waveform. The curve has higher sharpness at the peaks because DFT has better frequency resolution for stationary periodic signals and can accurately capture the periodic amplitude changes of the fundamental frequency.
Although the implementation paths of the two algorithms are different, the extracted fundamental frequency signals have almost no difference in period and amplitude range. Especially in the stable segment from 0.01 seconds to 0.09 seconds, the coincidence degree of the two curves exceeds 95 %. Meanwhile, the slight attenuation of the fundamental frequency amplitude at 0.07 seconds is synchronously reflected in both curves, indicating that the system has consistent capture ability for dynamic changes of the fundamental frequency. The DFT algorithm achieves a balance between real-time performance and stability on the hardware side, and the two collaboratively verify the accuracy of fundamental frequency feature extraction. It can be seen that both laboratory offline analysis and industrial on-site online monitoring can stably output credible fundamental frequency features, providing a reliable basis for the calculation and correction of rotor unbalance.
Fig. 12Time-domain waveform of the motor spindle vibration
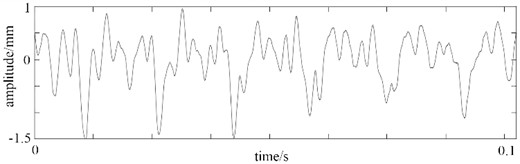
Fig. 13The fundamental frequency extraction results from MATLAB and the MCU
4.3. The test of the dynamic balancing system
One accelerometer-type vibration sensor is fixed at each support point on both sides of the rotor (e.g., the bearing housing), which serve as the physical sources of the vibration signals labeled A1 and A2. The sensors are rigidly connected to the support points to ensure accurate capture of the vibration responses of the support points during rotor rotation. A photoelectric sensor is aligned with the reflective patch on the rotor; each time the rotor rotates past the reflective patch, the photoelectric sensor outputs a pulse signal, and the STM32 main control chip calculates the actual rotational speed of the rotor based on the pulse interval. The mechanical vibrations at the support points are converted into weak analog electrical signals by the sensors, which are amplified to an appropriate amplitude by the programmable gain amplifier (PGA) built-in to the system. The signals then pass through a tracking band-pass filter to eliminate electromagnetic interference and high-frequency clutter, reserving the fundamental frequency vibration signal corresponding to the rotational speed. The main control chip performs frequency domain analysis on the digitized signals via the Discrete Fourier Transform (DFT) algorithm to lock onto the fundamental frequency component consistent with the rotational speed of the rotor. Finally, the peak detection algorithm is used to extract the peak value of the fundamental frequency vibration waveform, which corresponds to the vibration amplitudes A1 (left support) and A2 (right support) at the respective support points.
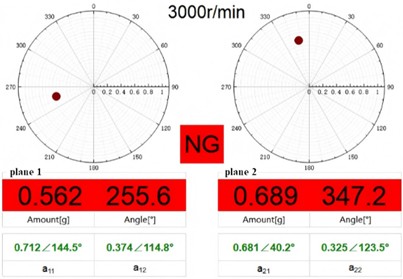
The interface of the dual-plane analysis system for rotor dynamic balance testing is shown in Fig. 14. The measurement object is the unbalance state of the motor spindle under the working condition of 3000 r/min. The system presents the unbalance vector information of two correction planes (plane 1 and plane 2) in the form of a combination of polar coordinate diagrams and numerical panels. The radial distance in the polar coordinate diagram corresponds to the amplitude of the unbalance, and the angular position corresponds to the phase of the unbalance. The unbalance amplitude of plane 1 is 0.562 with a phase of 255.6°, and the unbalance amplitude of plane 2 is 0.689 with a phase of 347.2°. At the same time, the system outputs the trial weight parameters for the two correction planes, such as 0.712∠144.5° and 0.374∠114.8° for plane 1. These parameters are obtained by the influence coefficient method and used to guide the actual counterweight operation. This system has the capability of multi-plane balance analysis, which can detect and correct the unbalance of two correction planes simultaneously. It is suitable for complex unbalance scenarios of multi-support rotors and can effectively eliminate static unbalance and couple unbalance. The multi-dimensional result presentation method combining polar coordinates and numerical values ensures the intuitiveness and accuracy of the calculation results. The dynamic display of polar coordinates facilitates the intuitive tracking of changes in the unbalance vector during the balancing process. The NG mark in the interface clearly indicates that the current rotor is in an unbalanced over-limit state.
Fig. 14The interface of the dual-plane analysis system
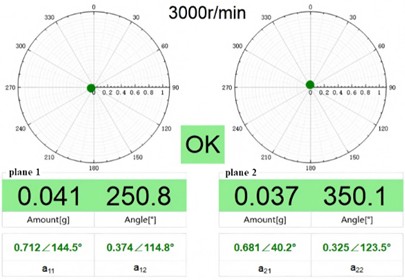
The measurement results of the motor shaft after dynamic balance correction are shown in Fig. 15. In terms of unbalance amplitude, after correction, plane 1 decreases to 0.041 and plane 2 decreases to 0.037, with an amplitude reduction of more than 90 %. This indicates that after the counterweight operation, the rotor unbalance is greatly suppressed and has been within the engineering acceptable balance accuracy range.
From the perspective of phase and vector distribution, before correction, the red dots in the polar coordinate diagrams of the two planes deviated significantly from the center, indicating significant unbalance. After correction, the dots are almost at the center of the polar coordinate diagrams. Although the unbalance vectors still have phases (250.8° for plane 1 and 350.1° for plane 2), their amplitudes are extremely small, and the centrifugal force interference of the rotor is effectively eliminated. The OK mark in the interface clearly indicates that the rotor is balanced and qualified. Combined with the trial weight parameters (such as 0.712∠144.5° and 0.374∠114.8° for plane 1), it can be seen that the system accurately designs the counterweight scheme by means of the influence coefficient method, and the actual counterweight operation is effective. In the unbalance detection stage, the system can accurately capture the unbalance amplitudes and phases of multiple planes. In the effect verification stage, the dual feedback of polar coordinates and numerical values intuitively shows the balance accuracy, ensuring that the vibration of the motor spindle under this working condition meets the engineering requirements.
Fig. 15The measurement results after dynamic balance correction
To further ensure the reliability of the system test, dynamic balance correction was performed on 15 different main shafts, and the results are presented in Table 4. It can be seen that each test and treatment can reduce the unbalanced vibration by more than 85 %, achieving good measurement results.
Table 4Comparison of dynamic balance correction results
Experiment number | Unbalanced vibration quantity / g | Vibration quantity after correction / g | Reduction rate of unbalanced vibration / % |
1 | 0.368 | 0.049 | 86.7 |
2 | 0.155 | 0.012 | 92.3 |
3 | 0.207 | 0.024 | 88.4 |
4 | 0.191 | 0.019 | 90.1 |
5 | 0.324 | 0.041 | 87.3 |
6 | 0.178 | 0.025 | 86.0 |
7 | 0.286 | 0.035 | 87.8 |
8 | 0.142 | 0.018 | 87.3 |
9 | 0.347 | 0.048 | 86.2 |
10 | 0.235 | 0.029 | 87.7 |
11 | 0.189 | 0.022 | 88.4 |
12 | 0.312 | 0.039 | 87.5 |
13 | 0.258 | 0.032 | 87.6 |
14 | 0.126 | 0.015 | 88.1 |
15 | 0.379 | 0.050 | 86.8 |
Table 5Overall statistical analysis of stability testing
Statistical indicators | Initial unbalanced vibration / g | Vibration after correction / g | Unbalanced vibration reduction rate / % |
Mean | 0.243 | 0.031 | 87.6 |
Standard deviation (SD) | 0.082 | 0.011 | 1.8 |
95 % confidence interval (CI) | 0.243±0.045 | 0.031±0.006 | 87.6±0.98 |
Repeatability coefficient (RC = 2.83×SD) | 0.232 | 0.031 | 5.1 |
Based on the above data, core statistical parameters (95 % confidence level) were calculated to evaluate the overall repeatability and stability of the system, as shown in Table 5. The Repeatability Coefficient (RC), in accordance with ISO 5725-2, characterizes the maximum allowable deviation of the system in repeated tests under identical conditions. The analysis results show that the RC of the system’s reduction rate is only 5.1 % with a standard deviation (SD) of 1.8 %, which is far lower than the 10 % allowable threshold for industrial dynamic balancing equipment, indicating the system exhibits high accuracy in repeated tests.
5. Conclusions
1) A portable integrated measurement system with the STM32F407VGT6 chip as the core is designed, in which the functions of data detection (photoelectric sensors and vibration sensors), signal processing and transmission (optoelectronic isolation, A/D conversion and multi-communication modules), and terminal control and display are integrated. The pain points of traditional devices, such as cumbersome operation and the need for multi-device switching, are addressed, and the requirements for on-site portable operation and maintenance (light weight, long endurance and adaptability to confined spaces) are satisfied.
2) A signal processing scheme integrating multi-algorithm fusion and hardware adaptation is proposed, and the advantages of the DFT algorithm in fundamental frequency extraction are verified, with its amplitude and phase deviations reduced to as low as 0.13 % and 0.58 % respectively. The algorithm is compatible with the computing power of embedded hardware. Meanwhile, adaptive circuits such as the tracking band-pass filter and programmable gain amplifier are designed, and combined with the 16-bit ADS8509 ADC, the limitations of traditional fixed-frequency filters are overcome. Thus, the stable acquisition of unbalanced vibration signals under variable speeds and the high-precision collection of weak signals are achieved.
3) Multiple communication modes including Ethernet, RS232 serial port and Wi-Fi (MQTT) are supported, and connectivity to both PC and mobile terminals is realized, enabling the achievement of data visualization, remote monitoring and intelligent analysis. Through experimental verification, it is demonstrated that the consistency of fundamental frequency extraction between the hardware module and MATLAB software reaches over 95 % within the rotational speed range of 0-3000 rpm. After dynamic balance correction, the unbalanced vibration is reduced by more than 85 %. Therefore, reliable technical support is provided for the dynamic balance correction of rotating machinery.
4) In the future, technical iteration and application expansion can be realized from multiple dimensions. In terms of function expansion, multi-dimensional monitoring parameters such as temperature, pressure and wear can be integrated to construct a full-state health assessment system for rotating machinery. Meanwhile, the adaptive range of rotational speed can be expanded to cover more types of rotating equipment including ultra-high-speed spindles, micro-motors and large wind turbine blades. This design can meet the differentiated demands of various fields such as energy, chemical engineering, automotive manufacturing and intelligent manufacturing, and facilitate the upgrading of industrial automation and intellectualization.
References
-
R. Akoumeh et al., “Advances in fabrication techniques and performance optimization of polymer membranes for enhanced industrial oil-water separation: A critical review,” Journal of Environmental Chemical Engineering, Vol. 12, No. 6, p. 114411, Dec. 2024, https://doi.org/10.1016/j.jece.2024.114411
-
G. Li, Q. Liu, Z. Chen, Y. Cheng, M. Wei, and D. Wu, “Intelligent fault diagnosis of rotating machinery driven by physical information and contrastive learning under extreme sample imbalance conditions,” Measurement Science and Technology, Vol. 36, No. 10, p. 106132, Oct. 2025, https://doi.org/10.1088/1361-6501/ae1159
-
Z. Guo, W. Du, C. Li, X. Guo, and Z. Liu, “Fault diagnosis of rotating machinery with high-dimensional imbalance samples based on wavelet random forest,” Measurement, Vol. 248, No. 15, p. 116936, May 2025, https://doi.org/10.1016/j.measurement.2025.116936
-
Q. Wang, Z. Wu, D. Wang, and X. Fu, “Study of measurement method for large imbalance evaluation based on dynamic electromagnetic force,” Measurement, Vol. 104, pp. 142–150, Jul. 2017, https://doi.org/10.1016/j.measurement.2017.03.020
-
M. A. Gonzalez Duran and A. Ruiz Rueda, “Dynamic calibration of acquisition cards used in vibration measurements, contribution of the theoretical and real resolution in the uncertainty budget,” Measurement: Sensors, Vol. 38, p. 101761, May 2025, https://doi.org/10.1016/j.measen.2024.101761
-
P. Saarinen, J. Keränen, and V. Hongisto, “Dynamic properties of resilient studs used in soundproof multilayer constructions – Measurement method and database,” Construction and Building Materials, Vol. 433, No. 28, p. 136629, Jun. 2024, https://doi.org/10.1016/j.conbuildmat.2024.136629
-
S. Das, S. Khatri, and A. Saha, “Position sensitive detector based non-contact vibration measurement with laser triangulation method utilizing Gabor Transform for noise reduction,” Journal of Vibration and Control, Vol. 30, No. 9-10, pp. 1984–1994, May 2023, https://doi.org/10.1177/10775463231173842
-
C. Huang, A. Li, and F. Qin, “Research progress of dynamic measurement technology of atom gravimeter,” Applied Sciences, Vol. 13, No. 15, p. 8774, Jul. 2023, https://doi.org/10.3390/app13158774
-
C. Buachart et al., “Real time vibration measurement and inverse analysis for dynamic properties of an axisymmetric masonry structure,” Journal of Asian Architecture and Building Engineering, Vol. 22, No. 4, pp. 2237–2246, Jul. 2023, https://doi.org/10.1080/13467581.2022.2145212
-
E. B. Larsson, “Low-power portable vibration monitoring and balancing system for automotive powertrains,” Sensors, Vol. 23, No. 15, pp. 6789–6789, Aug. 2023.
-
Y. Dai, M. Jie, and Y. Zhang, “STM32-based piezoelectric ceramic control system,” Frontiers in Computing and Intelligent Systems, Vol. 12, No. 1, pp. 150–156, Apr. 2025, https://doi.org/10.54097/7w0am849
-
Y.-L. Lin, T.-T. Yang, Y.-Q. Guo, S. Chen, and J.-B. Li, “Study on hybrid test control system based on MATLAB-STM32,” Instruments and Experimental Techniques, Vol. 65, No. 2, pp. 218–231, Apr. 2022, https://doi.org/10.1134/s0020441222020191
-
J. O. Persson, “Portable multi-axis dynamic balancing measurement system for marine propulsion shafts,” Ocean Engineering, Vol. 281, No. 1, pp. 114650–114650, Apr. 2024.
-
L. Zhang, H. Li, and H. Qi, “Application of photoelectric sensors in the design of hydrologic remote sensing measurement system,” Hydrology Research, Vol. 56, No. 4, pp. 341–351, Apr. 2025, https://doi.org/10.2166/nh.2025.165
-
H. Li, T. Bao, C. Gu, and B. Chen, “Vibration feature extraction based on the improved variational mode decomposition and singular spectrum analysis combination algorithm,” Advances in Structural Engineering, Vol. 22, No. 7, pp. 1519–1530, Dec. 2018, https://doi.org/10.1177/1369433218818921
-
Y. Wang, V. Jagota, M. E. Makhatha, and P. Kumar, “Vibration signal acquisition and computer simulation detection of mechanical equipment failure,” Nonlinear Engineering, Vol. 11, No. 1, pp. 207–214, Jun. 2022, https://doi.org/10.1515/nleng-2022-0026
-
Y. Jia and Y. Hu, “Research on fault signal detection method of mechanical vibration based on Kalman filtering algorithm,” International Journal of Information and Communication Technology, Vol. 1, No. 1, pp. 272–289, Jan. 2022, https://doi.org/10.1504/ijict.2022.10044157
-
Y. Huang, Z. Shen, Q. Xie, and F. Jiang, “Vibration fault detection of vehicle transmission gearbox based on time-frequency analysis of non-stationary signals,” International Journal of Vehicle Design, Vol. 89, No. 1/2, p. 145, Jan. 2022, https://doi.org/10.1504/ijvd.2022.10053063
-
J. Huchtkoetter and A. Reinhardt, “A study on the impact of data sampling rates on load signature event detection,” Energy Informatics, Vol. 2, No. S1, pp. 1–12, Sep. 2019, https://doi.org/10.1186/s42162-019-0096-9
-
Yao Fei, C. Yimin, and C. Guangyu, “Wavelet packet analysis of shotcrete-rock structures using the impact-echo method,” Russian Journal of Nondestructive Testing, Vol. 57, No. 1, pp. 43–54, Apr. 2021, https://doi.org/10.1134/s106183092101006x
-
K. Wang, G. Su, L. Liu, and S. Wang, “Wavelet packet analysis for speaker-independent emotion recognition,” Neurocomputing, Vol. 398, No. 1, pp. 257–264, Jul. 2020, https://doi.org/10.1016/j.neucom.2020.02.085
About this article

The paper is supported by provincial scientific research projects (62874155).
The datasets generated during and/or analyzed during the current study are available from the corresponding author on reasonable request.
The authors declare that they have no conflict of interest.
