Abstract
The vibrating wire instrument is a magneto-inductive sensor capable of measuring various physical quantities such as temperature, stress, and displacement. It is widely used in geotechnical engineering safety monitoring due to its excellent long-term stability. The measurement process of this instrument involves two main stages: excitation and pickup, with an intermediate transition process. Traditional measurement methods follow a sequential step-by-step procedure, which results in relatively long measurement times, typically ranging from fractions of a second to several seconds, making it difficult to meet the requirements for dynamic measurement. This paper, based on the operational characteristics of the instrument, introduces a negative feedback excitation mechanism during the measurement of the frequency parameter f, in accordance with the dynamic monitoring requirements. This innovation allows for precise excitation and rapid output tracking of the vibrating wire. Additionally, the integration of high-speed AD acquisition cards and FFT signal analysis techniques overcomes the time bottleneck associated with traditional methods, thus enabling dynamic monitoring capabilities and expanding the engineering applications of the instrument.
1. Introduction
The vibrating wire instrument is a type of sensor widely used in aerospace and civil infrastructure safety monitoring, measuring temperature, stress, strain, and displacement. Available as single-coil (more prevalent) or dual-coil, this paper focuses on the single-coil configuration. Its operation involves excitation, transition, and pickup stages; traditional ‘excitation-transition-pickup’ cycles (0.1 – several seconds) suit static but not dynamic monitoring.
During sudden events such as earthquakes or other dynamic disturbances, static monitoring alone cannot capture the rapid structural responses required for accurate assessment. Therefore, there is a practical need for vibrating wire instruments that can perform both long-term static monitoring and high-speed dynamic measurements. To meet this need, the development of a new measurement technology that overcomes the time-delay bottleneck in traditional vibrating wire instruments and enables real-time dynamic monitoring has become a research topic of significant engineering importance. A negative feedback excitation mechanism during the measurement of the frequency parameter f is introduced in accordance with the dynamic monitoring requirements. The innovation overcomes the time bottleneck associated with traditional methods, thus enabling dynamic monitoring capabilities and expanding the engineering applications of the instrument, such as wind-induced aeroelastic response.
2. Fundamental working principle of the vibrating wire instrument
The vibrating wire instrument is a magneto-inductive sensor composed of a positioning bracket pare, a coil (with a permanent magnet), a steel wire, and an external protective casing [1-2]. It can be mechanically modeled as a homogeneous steel wire fixed and stretched at both ends, as illustrated in Fig. 1. Eq. (1) serves as the mathematical foundation describing the basic working principle of the vibrating wire instrument:
where is the applied tension, is the total wire length s is the cross-sectional area of the wire; is the volumetric density of the wire ( = /); is the elongation of the wire under tension, is the elastic modulus, and is the stress applied to the wire. Compared with Carlson instrument that uses resistance as the output signal, the vibrating wire instrument takes frequency as the output signal can achieve better anti-interference performance and accuracy.
Fig. 1Structural composition diagram and mechanical equivalent physical model diagram of vibration wire instrument
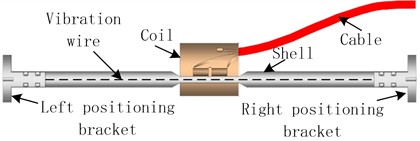
a) Structural composition diagram of vibration wire instrument
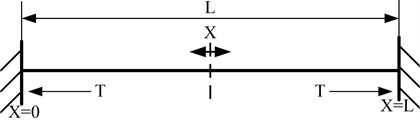
b) Mechanical equivalent physical model diagram of vibration wire instrument
3. Measurement methods of the vibrating wire instrument
3.1. Static measurement method
To measure the standing-wave frequency parameter of a vibrating wire instrument, a “excitation-then-pickup” strategy is typically employed to complete the measurement of the standing-wave frequency .
The steel wire is placed within the electromagnetic field formed by the measuring coil and the permanent magnet. Under a time-division multiplexing mechanism, an alternating voltage signal is first applied to the measuring coil, which generates a corresponding current in the circuit. Under the influence of the magnetic field, an alternating electromagnetic force is produced, causing the wire to vibrate mechanically and form a standing-wave mode. This stage is referred to as the excitation process.
Once a stable standing-wave mode has been established, the alternating voltage applied to the coil is suspended. Due to mechanical inertia, the wire continues to oscillate with a gradually decaying amplitude. The higher-order harmonics in the wire’s mechanical vibration decay much faster than the fundamental frequency component, which effectively provides a self-selecting frequency mechanism, leaving only the fundamental vibration mode with frequency .
As the vibrating wire moves through the magnetic field, it cuts the magnetic flux lines, thereby inducing a small electromotive force (EMF) in the measuring coil. The variation of this EMF follows the same temporal pattern as the mechanical vibration of the wire – that is, the induced voltage and the mechanical vibration share the same frequency. Therefore, by measuring the induced voltage signal of the coil, the natural vibration frequency of the wire can be indirectly determined. This stage is referred to as the pickup process.
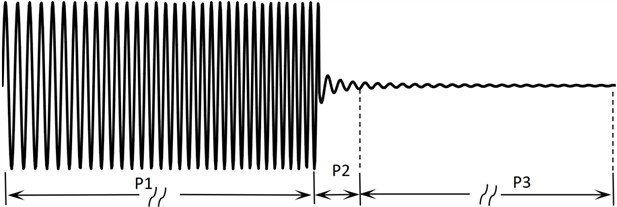
Fig. 2 illustrates the waveform of the measuring coil signal obtained during a single static measurement of the standing-wave frequency parameter of the vibrating wire instrument, following the “excitation-then-pickup” strategy. This signal waveform comprehensively reflects the working mechanism involved in the measurement of the standing-wave frequency .
In Fig. 2, three distinct stages – P1, P2, and P3 – can be clearly identified:
P1 (Excitation phase): Corresponds to the excitation process, during which an alternating voltage signal with a peak-to-peak amplitude of approximately 10-12 V is applied to the measuring coil. The excitation frequency is chosen to be close to the theoretically calculated standing-wave frequency .
P2 (Transition phase): Represents the attenuation and frequency-selection stage. In this phase, the higher-order harmonics decay rapidly, allowing the wire to establish a mechanical vibration mode dominated by the fundamental frequency .
P3 (Pickup phase): Corresponds to the induced signal generated as the vibrating wire cuts through the magnetic flux lines of the permanent magnet. This produces a sinusoidal induced voltage at the standing-wave frequency, typically with an amplitude ≤ 50 mV and a duration of less than one second.
The induced EMF signal obtained during the pickup phase is amplified, filtered, and shaped. The standing-wave frequency can then be determined either through digital frequency measurement circuits [6-10] or by performing Fast Fourier Transform (FFT) analysis on the signal after high-speed analog-to-digital conversion (ADC).
Fig. 2The electrical signal waveform of the coil during measurement process
3.2. Technical route for dynamic measurement of the vibrating wire instrument
According to the static measurement principle of the vibrating wire instrument, the process of measuring the frequency parameter involves three main stages: excitation, stabilization of the standing wave, and pickup. If this procedure is followed strictly, a complete measurement cycle typically requires from several tenths of a second to several seconds to complete, which makes it unsuitable for dynamic measurement applications. Therefore, achieving dynamic measurement with vibrating wire instruments necessitates innovation in the measurement approach.
Dynamic monitoring of the vibrating wire instrument requires data acquisition at a specified sampling rate. For instance, at a sampling frequency of 200 Hz, each data acquisition cycle must be completed within 5 ms. Through an in-depth study of the mechanical vibration mechanism of the wire, it has been found that employing same-frequency or near-frequency excitation can significantly shorten the time required for the establishment of a steady-state vibration.
Based on this technical insight, the following innovative measurement route is proposed:
During the measurement of the frequency parameter , a negative feedback excitation mechanism is actively introduced to achieve precise near-resonant excitation of the vibrating wire.
Simultaneously, a high-speed analog-to-digital (AD) acquisition card and a digital signal processor (DSP) equipped with Fast Fourier Transform (FFT) analysis are employed to realize real-time frequency computation.
Through the integration of these technologies, the duration of a single data acquisition cycle can be reduced to the millisecond level, effectively meeting the requirements for dynamic measurement and real-time monitoring.
3.3. Prototype system: hardware and software implementation
3.3.1. Hardware design
The hardware of the vibrating wire instrument’s dynamic measurement device is built according to the block diagram in Fig. 3.
Fig. 3Hardware design block diagram of dynamic measurement device: a) vibration wire; b) signal acquisition module; c) FFT signal processing module based on DSP; d) output of measurement results. All photographs were taken by the authors in Nanjing, China, on Feb.17, 2025
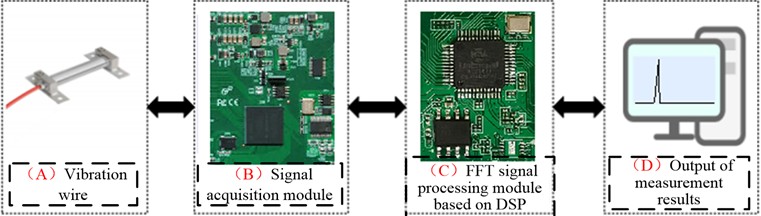
The dynamic measurement circuitry consists of three major parts: a signal acquisition module, a DSP-based FFT digital signal processing module, and a measured-value output module. The signal acquisition module comprises the excitation circuit, the pickup circuit, and the power supply circuit. The excitation circuit includes the feedback excitation circuit, a two-to-one high-speed switch, and a power amplifier; the pickup circuit includes an amplifier, a band-pass filter, a wave-shaping stage, and a high-speed ADC. Consequently, the high-speed ADC acquisition and the feedback excitation circuit are the focal points of the hardware design.
To ensure dynamic measurement performance, a high conversion rate is required of the ADC. Considering the output frequency range of the vibrating wire sensor, the AD9240 is selected as the high-speed ADC chip, providing a sampling rate of 10 MSPS with 14-bit resolution. The ADC time for a single conversion is 0.1 µs. To improve data accuracy in light of the sensor’s frequency characteristics, the average of 14 consecutive conversions is taken as one sample point. A total of 1024 sample points are collected, resulting in an overall acquisition time of 1.434 ms. The DSP then completes a 1024-point FFT in 0.489 ms, giving a total of 1.923 ms, which satisfies the < 2 ms requirement.
The key to the feedback excitation hardware lies in the signal playback circuit [3-5], implemented by combining a DSP with a 16-bit high-speed DAC. The DSP generates the playback numerical sequence based on the previously measured result and streams it continuously to the DAC. In this design, the DAC3283 is adopted, offering 16-bit precision and an 800 MSPS conversion rate, thus delivering high-speed and high-accuracy DAC performance.
3.3.2. Software design
The key aspect of the software design lies in enabling the DSP to execute the FFT algorithm accurately and in real time. Based on the spectral characteristics of the vibrating wire instrument’s signal, a well-established radix-2 FFT algorithm model [11-15] is adopted. To achieve an optimal balance between computational efficiency and measurement precision, the DSP implements a fixed-point FFT algorithm with 1024 points.
In the time domain, the sampled signal sequence is recursively decomposed into two sub-sequences containing the even and odd indexed samples, respectively, as follows:
where is the twiddle factor in the FFT computation.
To verify the performance of the implemented FFT algorithm, the BGK4150 vibrating wire strain gauge was selected as the test object. Some dynamic measurement experiment was carried out. It can be observed that the dominant frequency component in the frequency-domain spectrum precisely corresponds to the vibration frequency visible in the time-domain waveform. This confirms that the FFT computation results can accurately determine the measured frequency of the vibrating wire instrument.
The core idea of this experimental setup is to feed the output signal back to the sensor excitation, which may provide reference for other types of sensors.
4. Experimental verification
To evaluate the performance of the proposed technical approach, a comparative experiment was specifically designed and conducted. The experimental setup consisted of an electro hydraulic servo test system, a combined strain-gauge/vibrating-wire dynamic measurement device, a data acquisition and analysis computer, the test specimen, a power supply, and connecting cables, as shown in Fig. 4.
Fig. 4Comparison test of dynamic response performance between strain gauges and vibration wire strain gauge. The photograph was taken by the authors in Nanjing, China, on Feb.17, 2025
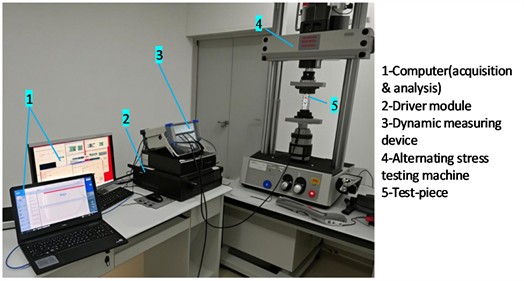
The comparative experiment focused on the frequency parameter . During the test, the electro-hydraulic servo system was configured to generate alternating stress corresponding to a strain amplitude of 2000 με (±1000 με), while the excitation frequency of the sinusoidal stress was sequentially adjusted to 50 Hz, 100 Hz, and 200 Hz. Both the strain gauge system and the vibrating wire dynamic measurement device acquired data synchronously. From the experimental data analysis, using the strain gauge measurements as the reference, the vibrating wire strain gauge demonstrated a consistent and accurate representation of the specimen’s dynamic strain response across all tested frequencies. However, the measurement error of the vibrating wire strain gauge was observed to increase with frequency, being approximately ±2.2 %, ±4.7 %, and ±11.7 % at 50 Hz, 100 Hz, and 200 Hz, respectively. When the dynamic frequency reached 200 Hz, the relative error became more pronounced, approaching the upper limit of acceptable accuracy for dynamic measurement. The limitation at high frequencies is mainly due to the excitation time constraint of maintaining wire’s oscillation.
5. Conclusions
The application of the negative feedback excitation technique in the dynamic measurement of vibrating wire instruments represents both an innovation in measurement methodology and a valuable exploration in engineering practice. The design and implementation of the prototype system verified the feasibility and practicality of the proposed approach. It should be noted, however, that although the negative feedback excitation technique substantially improves the dynamic measurement performance, it remains constrained by the alternating “excitation-pickup” operation mechanism. For further research, on the one hand, some attempts to increase the power amplification of the negative feedback excitation circuit may be carried out to further shorten the sustained oscillation time and raise the upper limit of the frequency response of the vibrating wire instruments. On the other hand, pilot tests in practical engineering projects beyond the laboratory should be taken in action in order to obtain valuable engineering promotion and application in the near future.
References
-
T. L. Deng, T. L. Bai, J. T. Ma, L. N., and Xu, “Single coil current type vibrating wire sensor,” (in Chinese), Transducer and Microsystem Technologies, Vol. 19, No. 4, pp. 22–25, 2000, https://doi.org/10.13873/j.1000-97872000.04.008
-
L. M. Mao, W. S. Wang, and X. S. Shen, “The application of the vibrating wire sensor and its network automatic measuring unit in the monitoring system for bridges,” (in Chinese), Chinese Journal of Sensors and Actuators, No. 1, pp. 73–76, 2002, https://doi.org/10.3969/j.issn.1004-1699.2002.01.017
-
W. G. Wang, “Design and research of signal acquisition system for vibrating string sensor,” (in Chinese), Chang’an University, Xi’an, P. R. China, 2023.
-
S. Y. Mao, Y. W. Huang, and Y. Y. Li, “Research on adaptive excitation strategy of vibration wire sensor based on spectrum feedback information,” (in Chinese), Chinese Journal of Sensors and Actuators, Vol. 36, No. 4, pp. 522–528, 2023, https://doi.org/10.3969/j.issn.1004-1699.2023.04.004
-
J. Z. Chen, Y. Zhang, and W. Xie, “Design and research of vibration wire sensor monitoring system,” (in Chinese), Automation Application, No. 6, pp. 1–3, 2020, https://doi.org/10.19769/j.zdhy.2020.06.001
-
J. W. Sun, L. Wang, B. W. Chang, and R. G. Wang, “Design and analysis of complex electromagnetic environment acquisition and playback system,” (in Chinese), Technology Innovation and Application, Vol. 14, No. 11, pp. 19–22, 2024, https://doi.org/10.19981/j.cn23-1581/g3.2024.11.005
-
Y. J. Luo and Q. Xu, “Data Acquisition and playback system based on AD9361,” (in Chinese), Instrument Technique and Sensor, No. 11, pp. 89–95, 2023, https://doi.org/10.3969/j.issn.1002-1841.2023.11.016
-
C. Sun, “Design of secondary surveillance radar data display and playback system,” (in Chinese), Software, Vol. 41, No. 6, pp. 222–224, 2020, https://doi.org/10.3969/j.issn.1003-6970.2020.06.045
-
M. W. Shi and L. Ren, “Design of flight test monitoring and playback system for communication testing,” (in Chinese), Modern Navigation, Vol. 10, No. 3, pp. 191–194, 2019.
-
C. Luo, “Design of the IF signal acquisition and playback module based on PXI-e,” (in Chinese), University of Electronic Science and Technology, Chengdu, P. R. China, 2018.
-
L. Chen, P. Ye, H. Z. Yang, and K. J. Yang, “Fast spectrum sensing method based on sparse FFT,” (in Chinese), Journal of University of Electronic Science and Technology of China, Vol. 54, No. 2, pp. 274–279, 2025, https://doi.org/10.12178/1001-0548.2024071
-
L. M. Zhai and X. K. Zhang, “InSAR phase unwrapping algorithm based on 4-FFT and multi grid optimization,” (in Chinese), Journal of Microwaves, Vol. 40, No. S1, pp. 334–337, 2024.
-
B. Huang, N. J. Hou, and L. W. Mao, “Analysis of FFT algorithm complexity and hardware implementation,” (in Chinese), Computer Programming Skills and Maintenance, Vol. 1, No. 10, pp. 13–16, 2024, https://doi.org/10.16184/j.cnki.comprg.2024.10.020
-
Z. Z. Chen, Z. K. Zhou, and C. Zhao, “Design and implementation of S-Band radar signal processing unit based on split-radix FFT,” (in Chinese), Electronic Measurement Technology, Vol. 47, No. 17, pp. 1–9, 2024, https://doi.org/10.19651/j.cnki.emt.2416065
-
H. L. Xiao et al., “Design and implementation of FPGA hardware structure optimization based on R22FFT algorithm,” (in Chinese), Journal of Computer Applications, Vol. 45, No. 8, pp. 2637–2645, 2025, https://doi.org/10.11772/j.issn.1001-9081.2024071010
About this article

This work was supported by the Research Startup Funding for High-Level Talent at NJJIT (Grant No. JG2523), the Natural Science Foundation of the Higher Education Institutions of Jiangsu Province, China (Grant No. 23KJB460020), and the NJJIT Scientific Research Program in Natural Science (Grant No. JZ2405). The authors would also like to thank all colleagues who provided assistance during the experiments and manuscript preparation.
The datasets generated during and/or analyzed during the current study are available from the corresponding author on reasonable request.
The authors declare that they have no conflict of interest.
