Abstract
Rising groundwater and recurrent flooding in Uzbekistan accelerate moisture infiltration and salt leaching in saline foundation soils, which may significantly reduce stiffness and shear strength. This study investigates coupled effects of moisture, salinity, and filtration on the strength parameters of saline loam and sandy loam using a controlled laboratory program. The methodology includes baseline geotechnical and chemical characterization, one-dimensional filtration and diffusion leaching, and repeated mechanical testing to obtain cohesion (), internal friction angle (), and deformability indicators. The results demonstrate a monotonic decrease in soluble salt content with increasing leaching degree () and a pronounced reduction of cohesion after leaching (e.g., from 25 to 1.5 kPa for a representative gypsum-bearing loam case), while exhibits a soil-dependent trend under extended exposure. Empirical relationships and observed trends are used to characterize strength degradation under groundwater-rise scenarios. The novelty of the study lies in quantifying the hydro-chemical degradation of strength parameters and providing engineering-relevant trends applicable to foundation assessment in saline areas.
1. Introduction
The construction of buildings and civil engineering structures in Uzbekistan is frequently performed under complex engineering–geological conditions, particularly in regions characterized by saline soils. Such soils are widely distributed across the country, including Bukhara, Jizzakh, Syrdarya, Fergana, Khorezm, and large areas of the Republic of Karakalpakstan. Due to their formation environment and chemical composition, saline soils present significant challenges for foundation design and long-term structural stability, especially when subjected to moisture infiltration and groundwater rise [1], [2].
Saline foundation soils in Uzbekistan include a wide range of deposits that differ in salt composition, concentration, and solubility. These deposits are typically formed in topographic depressions such as lowlands, desert basins, saline lake margins, and foothill zones, where mineralized groundwater is located close to the ground surface, often at depths of 2-4 m. Limited natural drainage combined with high evaporation rates exceeding precipitation creates favorable conditions for salt accumulation within the soil profile. As a result, these soils often contain both easily soluble salts and poorly soluble compounds (e.g., gypsum), which influence soil fabric and apparent cementation.
Numerous studies and practical experience indicate that the physical and mechanical properties of saline soils are highly sensitive to changes in moisture conditions. Prolonged water infiltration caused by flooding, irrigation, or groundwater rise leads to the dissolution and migration of salts, altering soil structure, consistency, and load-bearing capacity. These processes may result in excessive settlements, loss of shear strength, and damage to buildings and structures [3], [4], with similar degradation trends reported for saline and gypsum-bearing soils under soaking/leaching exposure [7-10]. Analyses of structural distress and emergency conditions observed at several facilities in Uzbekistan confirm that insufficient consideration of moisture-induced degradation of saline soils is a major contributing factor [3], [4].
In this study, saline loam and sandy loam soils typical of the Dostlik district of the Jizzakh region, where intensive civil and industrial construction is underway, were selected as the object of investigation. Controlled laboratory experiments were carried out to reproduce moisture infiltration and filtration-induced salt leaching and to assess changes in soil consistency, compressibility, and shear resistance. Based on the experimental findings, empirical dependencies describing the evolution of strength and stability parameters were identified, providing a scientific basis for assessing the long-term performance of saline foundation soils under groundwater-rise scenarios [5], [6], [11].
Research gap and contributions. Although the influence of wetting on saline soils is recognized, engineering-geological investigations often lack a controlled coupling between salt removal mechanisms (filtration vs. diffusion leaching) and quantified changes in the key design parameters (, , and deformability indicators). This study addresses this gap by: (1) reproducing groundwater-rise conditions in laboratory using staged filtration gradients and diffusion exposure; (2) measuring strength degradation through repeated mechanical testing; and (3) identifying empirical dependencies between leaching degree () and strength parameters for practical use in foundation assessment.
Paper structure. Section 2 presents the methodology and experimental program; Section 3 reports the results; Section 4 discusses engineering implications and limitations; and Section 5 summarizes the main conclusions.
2. Research methodology
Loam and sandy loam soils were sampled from representative construction sites in the Dostlik district of the Jizzakh region to evaluate changes in salinity and mechanical behavior under prolonged water influence. The study area is characterized by saline sediments, shallow mineralized groundwater, and intensive construction activity, making it suitable for assessing moisture-related degradation of foundation soils. Sampling locations were selected to reflect typical stratigraphic and hydrogeological conditions relevant to local foundations.
The study follows a controlled laboratory design combining: (i) field sampling at foundation depth, (ii) baseline geotechnical and chemical characterization, (iii) staged hydro-chemical exposure via one-dimensional filtration and diffusion leaching, (iv) repeated shear/compression testing after exposure, and () empirical analysis of the relationships between salinity/moisture changes, strength parameters (cohesion , internal friction angle ), and deformability indicators.
2.1. Sampling strategy
Soil material was collected from active construction zones within the Dostlik district where saline sediments and shallow mineralized groundwater are widespread. Sampling depth corresponded to typical foundation levels (approximately 1.5-2.5 m). Two specimen categories were prepared: undisturbed monoliths for deformation and shear testing, and disturbed bulk samples for physical and chemical analyses. Immediately after extraction, specimens were sealed to preserve natural structure, moisture, and salt composition.
2.2. Initial laboratory characterization
Before water exposure, baseline parameters were determined using standard geotechnical procedures. The testing program included natural moisture content (), bulk and dry density , particle density (), porosity () and void ratio (), Atterberg limits , plasticity index (), shear strength parameters , deformation modulus (), relative settlement under pressures of 0.1-0.3 MPa, and initial yield pressure. The measured reference parameters are summarized in Table 1.
To improve reproducibility, the laboratory equipment and typical measurement accuracy are listed:
– Moisture content (): drying oven + electronic balance (temperature ±2 °C; mass ±0.01 g).
– Density : density rings + electronic balance (volume ±1 cm3; mass ±0.01 g).
– Particle density (): pycnometer + electronic balance (mass ±0.01 g).
– Atterberg limits: Casagrande/cone device (water content ±0.5 %).
– Direct shear : shear box apparatus (normal load ±1 %; displacement ±0.01 mm).
– Oedometer / compressibility (): oedometer frame + dial gauge (vertical deformation ±0.01 mm).
– Filtration gradients (): sealed filtration cell + head control (head ±1 mm; filtrate volume ±1 mL).
– Dry residue / TDS: gravimetric method (temperature ±2 °C; mass ±0.01 g).
– Ion composition: titration (burette reading ±0.05 mL).
– pH: pH meter (±0.01 pH).
Note: if specific instrument models were not recorded, standard laboratory equipment was used; the listed accuracies represent typical values for the applied methods.
Table 1Reference properties of saline soils used in the study
Property | Unit | Measured values | |
Loam | Sandy loam | ||
Bulk density | t/m3 | 1.64 | 1.68 |
Dry density | t/m3 | 1.23 | 1.18 |
Particle density | t/m3 | 2.52 | 2.43 |
Porosity | % | 42.8 | 41.7 |
Void ratio | dimensionless | 0.869 | 0.863 |
Natural moisture content | (–) | 0.175 | 0.234 |
Degree of saturation | dimensionless | 0.54 | 0.72 |
Liquid limit | (–) | 0.261 | 0.261 |
Plastic limit | (–) | 0.180 | 0.212 |
Plasticity index | (–) | 0.081 | 0.049 |
Liquidity index | dimensionless | < 0 | 0.46 |
Cohesion, | (kPa) | 18 | 8.0 |
Internal friction angle | (degree) | 25 | 26 |
Deformation modulus in natural-moisture condition | MPa | 5.0 | 5.0 |
Deformation modulus in wet condition | MPa | 4.0 | 4.0 |
Relative settlement: 0.1 MPa 0.2 MPa 0.3 MPa | dimensionless | 0.007 0.013 0.017 | 0.009 0.015 0.020 |
Initial yield pressure | MPa | 0.15 | 0.12 |
2.3. Chemical analysis of soluble salts
Water extracts were prepared using controlled solid–liquid ratios. Total dissolved salts (dry residue) and ionic composition were determined by titration and gravimetric methods. Dry residue and ion contents are reported per mass of dry soil (mg/kg) based on the water-extract procedure. The quantitative chemical characteristics are presented in Table 2 and were considered the initial salinity state prior to hydro-chemical impact.
These values were considered the initial salinity state prior to hydraulic influence.
Table 2Quantitative chemical analysis of soil salts using titration in water extracts
Soil type | Dry residue, mg/kg | Ion content, mg/kg | pH | |||||
HCO3⁻ | Cl⁻ | SO42⁻ | Ca2⁺ | Mg2⁺ | Na⁺ + K⁺ | |||
Loam | 12585 | 203 | 580 | 7900 | 3185 | 465 | 580 | 7.8 |
Sandy loam | 12965 | 158 | 860 | 8070 | 2955 | 375 | 595 | 7.8 |
2.4. Controlled filtration experiment
To reproduce groundwater seepage, a vertical one-dimensional filtration scheme was applied [2]. Undisturbed samples were installed in a sealed filtration cell, and the side surfaces were isolated to prevent lateral flow. Distilled water was introduced gradually under hydraulic gradients 10, 30, 60, and 100, where is the hydraulic gradient. Effluent was collected at each stage, and the salt concentration in the filtrate was determined analytically. Leaching continued until the difference in salt concentration between successive stages became negligible. For each soil type, 3 replicate specimens were tested at each hydraulic gradient stage, and the reported values represent the mean values of the replicates. The reduction in soluble salt content was calculated as:
where is the decrease in soluble salt content (mg/kg), is the initial soluble salt content before leaching (mg/kg), and is the residual soluble salt content after a given filtration stage (mg/kg).
2.5. Diffusion leaching
For low-permeability samples, salt migration under concentration-gradient conditions was examined without external hydraulic pressure. The specimens were immersed in distilled water, which was periodically renewed. The leaching degree was evaluated as:
where is the leaching degree (%), is the initial soluble salt content (mg/kg), is the soluble salt content after exposure time (mg/kg), and is the exposure duration.
2.6. Mechanical testing after hydro-chemical impact
After each filtration or diffusion-leaching stage, the mechanical properties were re-determined by direct shear and compression testing. Strength degradation was quantified in terms of cohesion loss and friction-angle change as and , where and are the initial strength parameters before hydro-chemical exposure, and and are the corresponding values after leaching.
2.7. Data processing and modeling
Experimental results were analyzed to identify relationships between salinity decrease, moisture increase, and variation of mechanical parameters. The obtained empirical relationships support the engineering interpretation of deformation growth and bearing-capacity reduction of saline loam and sandy loam soils under prolonged groundwater exposure.
3. Results
3.1. Changes in soluble salt content during leaching
In this section, denotes the soluble salt content expressed as a percentage of dry soil mass, denotes cohesion (kPa), denotes the internal friction angle (degrees), and denotes the leaching degree (%). Figs. 1-3 and Tables 3-8 summarize the variation of , , and with increasing leaching degree.
The experimental results demonstrate a consistent reduction in soluble salt content (, %) with increasing leaching degree for all tested soil states (Tables 3 and 6). The decrease is monotonic and becomes more pronounced at higher , indicating active salt removal under prolonged water exposure and filtration/diffusion mechanisms. This confirms that groundwater rise and recurrent wetting can substantially reduce the salinity-related cementing effects in foundation soils. Figs. 1-3 visualize the dependence of , cohesion , and friction angle on the leaching degree .
Fig. 1Soluble salt content Dsol (%) versus leaching degree β (%) for gypsum-bearing loam (Table 6)
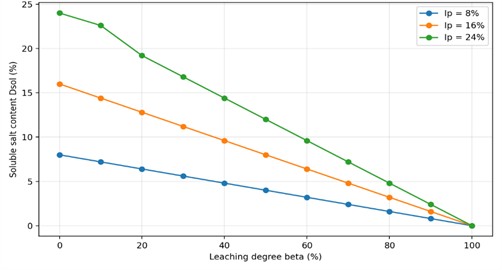
Fig. 2Cohesion c (kPa) versus leaching degree β (%) for gypsum-bearing loam (Table 7)
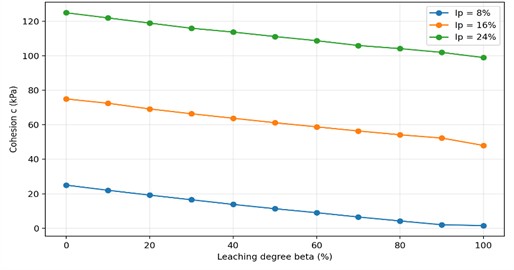
Table 3Soluble salt content (Dsol, %) vs. leaching degree β (%)
Preliminary plasticity, % | Leaching degree , % | 0 | 10 | 20 | 30 | 40 | 50 | 60 | 70 |
10 | , % | 10 | 9.1 | 8.1 | 7.2 | 6.2 | 5.3 | 4.3 | 3.4 |
20 | , % | 20 | 18.1 | 16.2 | 14.4 | 12.5 | 10.6 | 8.7 | 6.8 |
30 | , % | 30 | 27.2 | 24.3 | 21.5 | 18.7 | 15.9 | 13.1 | 10.3 |
40 | , % | 40 | 36.2 | 32.5 | 28.7 | 25 | 21.2 | 17.5 | 13.7 |
50 | , % | 50 | 45.3 | 40.6 | 35.9 | 31.2 | 26.5 | 21.8 | 17.1 |
3.2. Cohesion response to leaching
Cohesion (, kPa) decreases with increasing for both datasets (Tables 4 and 7). For the gypsum-bearing loam series (Table 7), cohesion degradation is particularly strong at low initial plasticity: for example, at preliminary plasticity 8 %, c decreases from 25 kPa ( 0) to 1.5 kPa ( 100). This suggests that initial bonding and apparent cementation contributed by soluble salts/gypsum are progressively lost during leaching, leading to significant reduction in shear resistance. Similar leaching-driven strength degradation has been reported for saline and gypsum-enriched soils under soaking/leaching exposure [7-10].
Table 4Cohesion (c, kPa) vs. leaching degree β (%)
Preliminary plasticity, % | Leaching degree , % | 0 | 10 | 20 | 30 | 40 | 50 | 60 | 70 |
10 | , kPa | 3 | 2.5 | 2.1 | 1.74 | 1.4 | 1.2 | 1.1 | 1 |
20 | , kPa | 7 | 6.3 | 5.7 | 5.2 | 4.8 | 4.5 | 4.3 | 4.1 |
30 | , kPa | 11 | 10.1 | 9.4 | 8.7 | 8.2 | 7.8 | 7.4 | 7.2 |
40 | , kPa | 15 | 13.9 | 13.1 | 12.3 | 11.6 | 11.1 | 10.6 | 10.3 |
50 | , kPa | 20 | 17.8 | 16.7 | 15.8 | 15.1 | 14.3 | 13.8 | 13.4 |
3.3. Internal friction angle response is soil-dependent
The internal friction angle shows a soil-dependent trend. In the loam-series dataset (Table 5), increases moderately with , which can be associated with particle rearrangement and increased interlocking after partial salt removal. In contrast, for gypsum-bearing loam under extended leaching (Table 8), decreases with increasing (e.g., at preliminary plasticity 8 %, decreases from 28° to 24° for 0 → 100). This indicates that, in gypsum-bearing soils, progressive loss of cementation and fabric disturbance may dominate over interlocking effects, resulting in overall weakening of frictional resistance at high leaching degrees [7], [9], [10].
Table 5Friction angle (φ, degree) vs. leaching degree β (%)
Preliminary plasticity, % | Leaching degree , % | 0 | 10 | 20 | 30 | 40 | 50 | 60 | 70 |
10 | , degree | 28 | 28.4 | 28.86 | 29.29 | 29.7 | 30.15 | 30.58 | 31.01 |
20 | , degree | 30 | 30.02 | 30.77 | 31.32 | 31.2 | 32.28 | 32.46 | 33.42 |
30 | , degree | 32 | 32.8 | 32.21 | 33.29 | 33.48 | 34.07 | 34.33 | 35.1 |
40 | , degree | 34 | 34.43 | 34.54 | 35.79 | 36.1 | 36.43 | 36.64 | 37.83 |
50 | , degree | 36 | 36.33 | 36.89 | 37.27 | 37.72 | 38.29 | 38.62 | 39.41 |
Fig. 3Variation of internal friction angle φ with leaching degree β: comparison of the loam-series dataset (Table 4) and the gypsum-bearing loam dataset (Table 7)
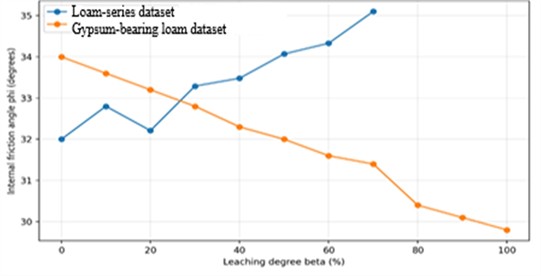
Fig. 3 highlights a soil-dependent response: increases moderately in the loam-series dataset (Table 5), while it decreases in gypsum-bearing loam under extended leaching (Table 8). This indicates competing mechanisms of particle interlocking and cementation loss during prolonged wetting.
Tables 6-8 present the salinity levels and property variations of gypsum-bearing loam at different leaching degrees. These tables summarize changes in soluble salt content (, %), cohesion (, kPa), and friction angle (, degrees) as functions of leaching degree (, %) and preliminary plasticity. The results provide a basis for evaluating the influence of leaching on both mineralization and the mechanical behavior of gypsum-bearing loam. Tables 7-9 provide the full numerical dataset used to build Figs. 1-3 and to interpret the long-term leaching trend.
Table 6Soluble salt content (Dsol, %) vs. leaching degree β (%)
Preliminary plasticity, % | Leaching degree , % | 0 | 10 | 20 | 30 | 40 | 50 | 60 | 70 | 80 | 90 | 100 |
8 | , % | 8 | 7.2 | 6.4 | 5.6 | 4.8 | 4 | 3.2 | 2.4 | 1.6 | 0.8 | 0 |
12 | , % | 12 | 10.8 | 9.6 | 8.4 | 7.2 | 6 | 4.8 | 3.6 | 2.4 | 1.2 | 0 |
16 | , % | 16 | 14.4 | 12.8 | 11.2 | 9.6 | 8 | 6.4 | 4.8 | 3.2 | 1.6 | 0 |
20 | , % | 20 | 18 | 16 | 14 | 12 | 10 | 8 | 6 | 4 | 2 | 0 |
24 | , % | 24 | 22.6 | 19.2 | 16.8 | 14.4 | 12 | 9.6 | 7.2 | 4.8 | 2.4 | 0 |
Table 7Cohesion (c, kPa) vs. leaching degree β (%)
Preliminary plasticity, % | Leaching degree , % | 0 | 10 | 20 | 30 | 40 | 50 | 60 | 70 | 80 | 90 | 100 |
8 | , kPa | 25 | 22 | 19.2 | 16.5 | 13.8 | 11.3 | 9 | 6.5 | 4.2 | 2 | 1.5 |
12 | , kPa | 50 | 47 | 44.2 | 41.4 | 38.8 | 36.2 | 33.8 | 31.4 | 29.2 | 27 | 25 |
16 | , kPa | 75 | 72.5 | 69.2 | 66.4 | 63.8 | 61.2 | 58.8 | 56.4 | 54.2 | 52.3 | 48 |
20 | , kPa | 100 | 97.2 | 94.2 | 91.4 | 88.8 | 86.2 | 83.8 | 81.4 | 79.2 | 77.3 | 74 |
24 | , kPa | 125 | 122 | 119 | 116 | 113.8 | 111.2 | 108.8 | 106 | 104.2 | 102 | 99 |
Table 8Friction angle (φ, degree) vs. leaching degree β (%)
Preliminary plasticity, % | Leaching degree , % | 0 | 10 | 20 | 30 | 40 | 50 | 60 | 70 | 80 | 90 | 100 |
8 | , degree | 28 | 27.6 | 27.2 | 26.8 | 26.4 | 26 | 25.6 | 25.2 | 24.8 | 24.4 | 24 |
12 | , degree | 30 | 29.7 | 29.3 | 28.6 | 28.2 | 28.1 | 27.3 | 27 | 26.4 | 26.1 | 26 |
16 | , degree | 32 | 31.8 | 31.4 | 30.8 | 30.4 | 30.2 | 29.5 | 29.2 | 28.8 | 28.2 | 28 |
20 | , degree | 34 | 33.6 | 33.2 | 32.8 | 32.3 | 32 | 31.6 | 31.4 | 30.4 | 30.1 | 29.8 |
24 | , degree | 36 | 35.4 | 35.1 | 34.6 | 34.4 | 34.2 | 33.6 | 33.1 | 32.7 | 32.4 | 32 |
4. Discussion
The monotonic decrease of with confirms that soluble salts are removed under both filtration and diffusion exposure, which aligns with common laboratory leaching approaches for saline soils [2]. The associated reduction of cohesion implies that salts and gypsum-related cementation contribute to apparent bonding in the initial state; leaching weakens these bonds and reduces shear strength. The contrasting behavior between Tables 5 and 8 suggests that different mechanisms dominate depending on soil fabric and gypsum content: moderate leaching may increase interparticle interlocking, while extended leaching in gypsum-bearing loam leads to loss of cementation, softening, and fabric degradation. From an engineering perspective, these results indicate that engineering-geological investigations in saline areas should include not only baseline salinity/gypsum characterization, but also an assessment of leaching potential, since long-term groundwater rise can cause substantial strength loss and increased settlement risk.
5. Conclusions
1) Prolonged water exposure causes a consistent reduction in soluble salt content () in both datasets, regardless of initial plasticity and leaching degree (Tables 3 and 6).
2) Salt leaching is accompanied by a significant decrease in cohesion c for all tested soil states (Tables 5 and 7), indicating progressive loss of salt/gypsum-related bonding under long-term wetting.
3) The internal friction angle exhibits a soil-dependent response: it increases moderately with in the loam-series dataset (Table 5), but decreases under extended leaching in gypsum-bearing loam (Table 8), reflecting competing mechanisms of particle rearrangement and cementation loss.
4) The findings emphasize the necessity of pre-design evaluation of salinity, gypsum content, and leaching potential at foundation depth, as neglecting these factors may lead to overestimation of long-term soil strength and bearing capacity in saline areas. The study also provides experimentally grounded trends that can be used in engineering-geological assessment of saline foundations exposed to prolonged wetting and leaching.
References
-
A. Kayumov, O. Zafarov, and D. Kayumov, “Changes of mechanical properties in humidification saline soil based in builds and constructions,” in AIP Conference Proceedings, Vol. 2789, No. 1, p. 040086, Jan. 2023, https://doi.org/10.1063/5.0145759
-
R. Hudaykulov, D. Makhmudova, D. Kayumov, and O. Zafarov, “Filter leaching of salt soils of automobile roads,” E3S Web of Conferences, Vol. 264, p. 02032, Jun. 2021, https://doi.org/10.1051/e3sconf/202126402032
-
Z. Maxkamov, O. Zafarov, J. Xudoyberdiyev, E. Urishbayev, and J.R. Ravshanov, “Conducting engineering and geological research on the design and construction of buildings and structures in saline areas,” in AIP Conference Proceedings, Vol. 2789, No. 1, p. 040080, Jan. 2023, https://doi.org/10.1063/5.0145757
-
O. Zafarov, D. G.’Ulomov, and Z. Murodov, “Conducting engineering-geological researches on bridges located in our country and diagnosing their super structures, methods of eliminating identified defects,” in AIP Conference Proceedings, Vol. 2789, No. 1, p. 040079, Jan. 2023, https://doi.org/10.1063/5.0145756
-
R. Bobojonov, O. Zafarov, and J. Yusupov, “Soil composition in the construction of engineering structures, their classification, assessment of the impact of mechanical properties of soils on the structure,” in AIP Conference Proceedings, Vol. 2789, No. 1, p. 040081, Jan. 2023, https://doi.org/10.1063/5.0145758
-
A. Qayumov, B. Tovboyev, O. Zafarov, and X. Ergashev, “Assessment of influence of strength and deformation properties of saline soils on foundations of structures distributed in Uzbekistan (in example of Pakhtakor district of Jizzakh Region),” in AIP Conference Proceedings, Vol. 3317, No. 1, p. 030007, Jan. 2025, https://doi.org/10.1063/5.0267152
-
S. S. Razouki and D. Kuttah, “Improving strength by increased compaction of gypsum-enriched soil under long-term soaking conditions,” Geotechnics, Vol. 4, No. 2, pp. 415–429, Apr. 2024, https://doi.org/10.3390/geotechnics4020023
-
Y. Song, H. Li, Y. Geng, L. Xia, and R. Yan, “Study of ion adsorption and shear strength of red clay under leaching action,” Sustainability, Vol. 15, No. 2, p. 959, Jan. 2023, https://doi.org/10.3390/su15020959
-
W. Geng, W. Han, J. Yin, and Z. Lu, “Salinity effects on the strength and morphological indices of soft marine clay,” Scientific Reports, Vol. 12, No. 1, Nov. 2022, https://doi.org/10.1038/s41598-022-22627-w
-
S. Zhang, S. Shao, S. Shao, H. Wu, Z. Wang, and X. Zhu, “Investigation of the mechanical behavior of saline loess using unsaturated true triaxial tests and a constitutive framework,” KSCE Journal of Civil Engineering, Vol. 30, No. 4, p. 100447, Apr. 2026, https://doi.org/10.1016/j.kscej.2025.100447
-
M. Talipov, “Computational modeling and analysis of mechanical power consumption in train assemblers’ work,” in Proceedings of the International Conference on Applied Innovation in IT, Vol. 13, No. 2, pp. 419–426, Feb. 2025, https://doi.org/10.25673/120513
About this article

The authors have not disclosed any funding.
The datasets generated during and/or analyzed during the current study are available from the corresponding author on reasonable request.
The authors declare that they have no conflict of interest.
