Abstract
To tackle the challenges existing in point cloud segmentation for transmission tower components-specifically, weak small-target perception, blurred boundaries, poor cross-scene adaptability, and insufficient real-time performance-this study develops a real-time recognition model by integrating LiDAR-IMU with UniSeg3D. The core contribution lies in formulating a systematic solution architecture. First, to address the issues of small targets and boundary ambiguity, a multi-scale boundary-aware module is designed. By jointly optimizing classification and boundary losses, it substantially strengthens feature extraction for small components (e.g., insulators) and enhances localization accuracy along boundary regions. Second, to mitigate the reliability degradation of single-sensor systems under complex conditions (such as vegetation occlusion or illumination variation), a vision-inertial bimodal fusion strategy is introduced. High-frequency motion data from the IMU are employed to dynamically compensate for the spatial sparsity of LiDAR point clouds, thereby improving the model’s robustness across diverse scenes. Third, to meet the real-time demands of engineering applications, a feature contribution screening mechanism is incorporated. This enables structured pruning and model lightweighting-reducing processing time per single tower to within 3 seconds-while maintaining accuracy. Experimental results demonstrate that, through the synergistic integration of these techniques, the proposed model achieves an average F-score of 0.853 across six core component categories, with particularly notable advantages in small-target recognition and complex-scene adaptability compared to existing approaches. This model has realized high-precision real-time identification of components in complex scenarios, which provides a technical scheme for intelligent inspection of transmission lines, and promotes the upgrade of the inspection mode from manual to automatic. At last, the stable operation of power systems is guaranteed.
Highlights
- Multi-scale boundary-aware module with joint optimization of classification and boundary losses, significantly enhancing feature extraction for small targets such as insulators and improving boundary localization accuracy.
- LiDAR-IMU bimodal fusion that leverages high-frequency IMU data to dynamically compensate for LiDAR point cloud sparsity, effectively boosting cross-scene robustness against vegetation occlusion and illumination variations.
- Feature contribution screening mechanism that enables structured pruning and model light weighting, reducing per-tower processing time to within 3 seconds while maintaining an average F-score of 0.853 across six component categories.
1. Introduction
MEHV/UHV transmission lines, whose components’ safety directly determines the stability of the power supply, are the core infrastructure in the power system. The popularity of LiDAR technology provides data support for three-dimensional point cloud segmentation of transmission tower components, and gradually replaces the traditional manual inspection mode [1]. At present, most of the mainstream methods are based on a Deep Learning Framework (DLF) to achieve component segmentation. However, they face three core problems: insufficient feature extraction of small targets (such as insulators), vulnerable to vegetation and terrain interference in complex backgrounds, poor adaptability to cross-regional scenes, and obvious attenuation of model accuracy in different climatic environments. The fuzzy boundary segmentation leads to the positioning error of hanging point components exceeding 5 mm [2]. The EHV/UHV transmission line in a certain area has caused conductor deviation due to the deviation of the hanging point at the cross arm end, resulting in short-term power supply interruption and affecting the power consumption of more than 30,000 users around [3]. In actual scenarios, line flashover faults caused by missed detection of insulator segmentation account for more than 18 % of the total number of transmission line faults. The existing technology is difficult to meet the requirements of high-precision real-time inspection, and an integrated solution that takes into account both accuracy and speed has not yet been formed [4].
In the related research progress, the researches on 3D point cloud segmentation methods are as follows: based on Transformer architecture, Kotta N. et al. [5] proposed a unified segmentation framework and designed a shared query representation mechanism to be compatible with multi-class segmentation tasks, which strengthened knowledge transfer between tasks through comparative learning, and achieved optimal performance on a common scene benchmark data set. However, the method does not optimize the transmission line’s small target components, and the segmentation recall rate of the components with a size of less than 0.3m, such as insulators, is lower than 70 %. Additionally, the small target recognition ability is weak. An improved PointNet++ transmission component segmentation model was constructed in [6]. The authors also designed a multi-scale local feature aggregation module and combined it with a data enhancement strategy to improve the generalization ability of the model, which increased the segmentation accuracy on tower and conductor components to 82 %. However, with a high redundancy of network structure, the processing time of a single base tower is more than 8 s, which can not meet the real-time requirements of engineering inspection. In [7], they conducted a feature fusion network driven by graph convolution, which extracted context information through a global pooling function, and introduced the attention mechanism to strengthen key feature weights. Thus, the accuracy of tower extraction in complex terrain scenes was increased. The disadvantage is that this method is insufficient to capture the boundary features, and the boundary segmentation error of the hanging point at the end of the cross arm is large, which is difficult to meet the needs of high-precision positioning. A boundary perception-guided loss function was put forward in [8], in which a bilateral feature fusion module was constructed by incorporating the classification accuracy of the boundary domain into the optimization objective. Successfully, through a weighted penalty mechanism, the sensitivity of boundary segmentation was increased. However, because the adaptive strategy is not designed in combination with the structural characteristics of the power grid, the robustness is insufficient and the performance stability is poor in dense scenes of multiple towers.
In summary, the above research obviously shows some disadvantages. But there are some other researches on multi-modal fusion segmentation methods. Wang, X. Y. et al. [9] proposed a point cloud-image multi-view fusion method, which projected the point cloud to a two-dimensional plane to generate a dense feature map, and fused the texture information of the color image to achieve feature alignment so as to improve the overall segmentation accuracy. However, this method has the problems of occlusion information loss in the projection process, high missing rate of hanging points at the end of the wire, and poor adaptability to the occlusion scene. Ji, C. et al. [10] proposed a vision-pseudo point cloud fusion framework. They generated a depth map through binocular disparity estimation, then converted it into a pseudo point cloud, and spread the two-dimensional detection results to the three-dimensional space in a weighted manner, which outperforms the single modality method in the segmentation of small target components. However, due to its dependence on high-quality image data, its performance degrades significantly under harsh lighting conditions, along with a limited environmental adaptability. Zhang, G. et al. [11] proposed a scheme combining UniSeg3D with multimodal feature fusion, and designed a parallel prompt encoder. Then, after processing text and visual information, and through knowledge distillation, the cross-modal association was strengthened to achieve unified multi-task segmentation. Regretfully, this method didn’t introduce inertial information to compensate for the sparsity of point clouds, along with the real-time response speed failing to meet the engineering application standards. Thus, it failed to balance the accuracy and speed.
This study concentrates on the limitations inherent in existing methods, and accordingly, a targeted set of technical solutions is proposed. First, to remedy the issues of weak small-target perception and blurred boundary segmentation, a multi-scale boundary-aware module is innovatively integrated within the UniSeg3D framework. By designing a loss function that incorporates a boundary-weighted penalty, this module compels the model to focus more intently on features associated with small components (such as insulators and hanging points) and their boundary regions during the learning process. The fundamental goal is to enhance recognition accuracy for these critical details. Second, to address the insufficient adaptability of using LiDAR alone in complex environments (e.g., intense illumination or occlusion), a vision-inertial (LiDAR-IMU) fusion mechanism is introduced. Leveraging the inherent robustness of IMU data against lighting variations, this mechanism dynamically compensates for point cloud feature loss caused by scene changes-thereby markedly improving the model's cross-scene robustness. Third, to overcome real-time bottlenecks stemming from network structural redundancy, a lightweight inference architecture based on feature contribution screening is devised. By quantifying the contribution of each feature layer to the final segmentation outcome, redundant parameters are pruned adaptively. This approach substantially accelerates processing speed while preserving high accuracy. In doing so, the inherent conflicts among high precision, strong robustness, and real-time performance are systematically reconciled, culminating in a comprehensive technical blueprint for intelligent transmission line inspection.
2. The related work
2.1. Example analysis and core issues of transmission tower point cloud segmentation
The transmission component segmentation example based on multi-modal fusion [12] is selected. This example takes UniSeg3D as the basic framework, and integrates the point cloud-image fusion module. Referring to the cross-modal association enhancement idea of Reference [11], it designs the feature extraction process for core components, such as insulators and hanging points. The test data shows that the overall segmentation accuracy is 83 % in a single climate scenario, but the recall rate of small targets is only 68 %. Besides, the boundary error is more than 4 mm, showing an obvious shortcomings in the performance. At last, the example reveals that the adaptation of the prior art in a complex scene is insufficient, and it is difficult to balance the stability and efficiency of multi-component segmentation. The visualization processing effect is shown in Fig. 1.
Fig. 1 compares the single-modal, multi-modal, and proposed UniSeg3D-IMU methods across six structural elements.
There are three core problems: (1) the feature extraction of small targets is insufficient, the recall rate of components with size less than 0.3m is generally less than 70%, and it is difficult to accurately identify small components such as insulators; (2) with a fuzzy boundary segmentation, the positioning error of hanging point components is more than 5mm, which can not meet the needs of high-precision inspection; (3) Weak cross-scene adaptability and insufficient performance stability under complex background make it difficult to adapt to diversified engineering scenes [13].
2.2. Technology evolution and technical analysis on the study
The prior art takes point cloud segmentation as the core, gradually evolves to the direction of multi-modal fusion, thus improving the segmentation performance through the complementation of different modal features. Combined with the technical path of the introduction literature, we can sort out two types of technical systems, single modality and multi-modality. Further, there are obvious differences in performance and scene adaptability between the two types of technologies [14].
Fig. 1Three-dimensional visualization of point cloud segmentation performance for transmission tower components
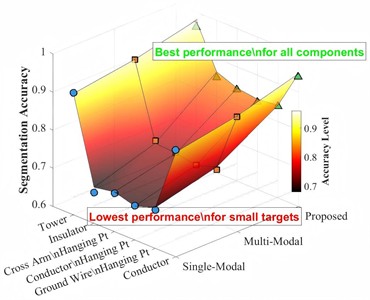
a) 3D performance analysis: transmission tower components
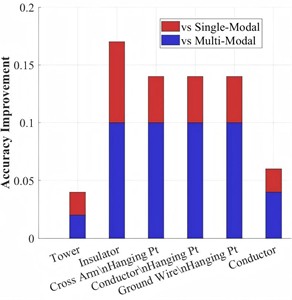
b) Performance gain analysis
In the single modal technology, the Transformer architecture enhances the global feature capture, but lacks the ability to process small targets. PointNet++ optimizes the aggregation of local features, but has the problems of structural redundancy and poor real-time. Multimodal technology makes up for the defect of single modality through point cloud-image fusion. For example, the projection fusion strategy in [9] improves the utilization rate of texture features, and the UniSeg3D fusion scheme in [11] achieves multi-task compatibility, but neither of them solves the problem of balancing inertial information compensation and real-time performance. The comparative analysis of mainstream technologies is shown in Table 1 and Table 2.
Table 1Comparison of advantages and disadvantages of a single mode technology
Technique types | Advantages | Disadvantages |
Transformer [5] | Strong global feature capture | Poor small target performance |
PointNet++ [6] | Local feature aggregation | High network redundancy |
Graph Convolution [15] | Context info extraction | Weak boundary capture |
Table 2Technology combination and complementary contrast
Combination mode | Complementary points | Existing gaps |
Point cloud-image [16] | Texture-feature supplement | Occlusion info loss |
UniSeg3D-multimodal [17] | Cross-task compatibility | No IMU compensation |
UniSeg3D-IMU | Sparsity compensation | Rarely studied currently |
In this study, UniSeg3D is used as the core framework, and the LiDAR-IMU fusion module is integrated to build a multi-scale boundary awareness mechanism. The three-dimensional spatial information is obtained through LiDAR, and the IMU compensates the sparsity of the point cloud to effectively solve the problems of occlusion and feature loss. Combined with a weighted penalty mechanism, the boundary perception module optimizes the positioning accuracy of the hanging point and improves the boundary segmentation performance. Lightweight reasoning architecture compresses redundant parameters, and cooperates with transfer learning to realizes single-base tower processing within 3 s. Besides, they also take into account both accuracy and real-time, making up for the shortcomings of existing technology.
3. Segmentation modeling based on UniSeg3D and vision-inertia fusion
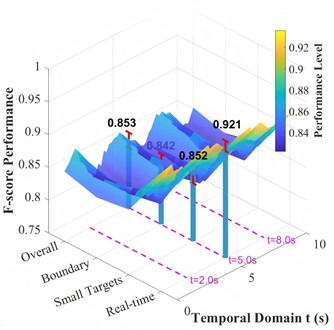
In this section, aiming at the problems of weak perception of small targets, fuzzy boundary and poor cross-scene adaptation, a 3D point cloud segmentation model based on Lidar-IMU is constructed. The technical framework diagram covers data synchronization, feature fusion and model reasoning modules. The algorithm process takes UniSeg3D as the backbone, first completes bimodal data alignment, and then outputs segmentation results through feature optimization to form a closed-loop modeling system. The effect of segmentation modeling is displayed in Fig. 2.
Fig. 2Three-dimensional modeling framework of UniSeg3D-VI fusion for transmission tower component segmentation
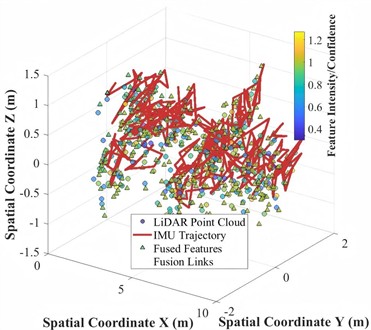
a) LiDAR-IMU data fusion in 3D space
b) Segmentation performance with temporal analysis
Fig. 2(a) is a visualization of LiDAR point cloud (blue) fused with IMU trajectory (red), generating enhanced features (green) through multimodal integration. Fig. 2(b) is a performance surface analysis showing F-score variations across four evaluation metrics with temporal synchronization, accompanied by mean performance bars (blue) with error margins (red).
The core of the model innovation is the multi-loss collaborative optimization objective function, which considers the classification accuracy and boundary performance. The formula design is:
In the Eq. (1), as the classification loss weight coefficient, is used to balance the proportion of two types of losses. represents the cross-entropy classification loss, which measures the accuracy of component category identification. As the boundary perception loss, strengthens the classification ability of the boundary domain through weighted penalty. is the fusion loss adjustment coefficient, which optimizes the consistency of bimodal features; is the modal fusion loss, which minimizes the difference between LiDAR and IMU features.
(1) This function solves the problem that a single loss pays insufficient attention to the boundary [18]. , are determined by adaptive learning, so that the weights of small targets and boundary features are dynamically increased. Then, the ability to identify key features is strengthened. To quantify the effectiveness of multi-scale features, a feature contribution index is defined:
where, refers to the feature contribution of the kth layer. is the standard deviation function, which measures the feature information entropy. is the fusion feature map of the th layer, and is the total number of feature layers. refers to the layer adaptive coefficient, which is dynamically adjusted according to the resolution.
(2) The feature contribution degree can screen the effective feature layer, and eliminate the redundant information to reduce the weight of the model structure, so that the high-resolution layer (corresponding to the small target) can obtain higher weight, which improves the feature extraction ability of the small target. For bimodal data, time synchronization shall be completed first. The correction formula is:
where is the time error after correction. , are two types of data acquisition time stamps respectively. is the error correction coefficient to compensate the hardware delay deviation.
(3) Time synchronization is the premise of feature alignment. When the deviation exceeds the threshold, linear interpolation is adopted to supplement data to avoid feature dislocation affecting the fusion effect. A fusion feature vector is constructed based on that align data:
where is the final fusion feature. , refer to the feature weight matrix. , are two types of modal features respectively. is the regularization term to prevent overfitting.
(4) The weight matrix is adaptively updated along with the training. The IMU weight is automatically improved in a complex scene to compensate the sparsity of the point cloud. Then, the feature fusion effect is optimized. Finally, a nonlinear activation function is introduced to enhance the feature expression:
where is the activation output. is the input eigenvalue. refers to the nonlinear adjustment parameter, and compresses the characteristic range and accelerates the model convergence.
Algorithm: UniSeg3D-VI fusion segmentation.
Input: LiDAR point cloud , IMU data sequence , pre-trained weight matrices , hyperparameter set .
Output: Segmented point cloud with semantic labels .
1. Data alignment and preprocessing.
a. Temporal synchronization between and is performed using Eq. (3). The computed time error guides linear interpolation, yielding aligned IMU features .
b. Statistical outlier removal is applied to , producing a denoised point cloud .
2. Multi-modal feature extraction.
a. Hierarchical spatial features are extracted from via the UniSeg3D backbone.
b. High-frequency motion features are derived from the synchronized .
c. For each layer , LiDAR features and IMU features are fused using learnable weight matrices as specified in Eq. (4), generating fused feature maps .
3. Feature screening and nonlinear enhancement.
a. Contribution scores for each fused feature map are calculated via Eq. (2).
b. Feature layers with exceeding a threshold 0.05 are retained as ; gradients for other layers are frozen during subsequent training.
c. The retained feature maps are processed through the activation function defined in Eq. (5) (i.e., ) to enhance nonlinear representational capacity.
4. Loss optimization and parameter updating.
a. Total loss is computed according to Eq. (1). This composite function simultaneously drives classification accuracy, boundary precision, and cross-modal feature alignment.
b. Backpropagation is performed; learnable parameters (including , , , , , and ) are updated accordingly.
5. Inference and boundary refinement.
a. Forward inference on validation/test data produces initial per-point classification probabilities .
b. Boundary refinement: A lightweight Conditional Random Field (CRF) module is applied as post-processing. This module incorporates the boundary uncertainty map-derived from in Eq. (1)-as a prior constraint. Through iterative optimization, boundary regions are refined, yielding the final segmentation output .
6. The segmented point cloud is returned as the final output.
This section has built a complete modeling process and solved the core problems mentioned above. However, the model is not adaptive enough in high-density vegetation occlusion scenes, and is prone to missing detection of small targets, which requires subsequent feature enhancement strategy optimization to further increase the adaptability of complex scenes.
4. Application and realization of transmission tower parts identification technology based on the modeling results
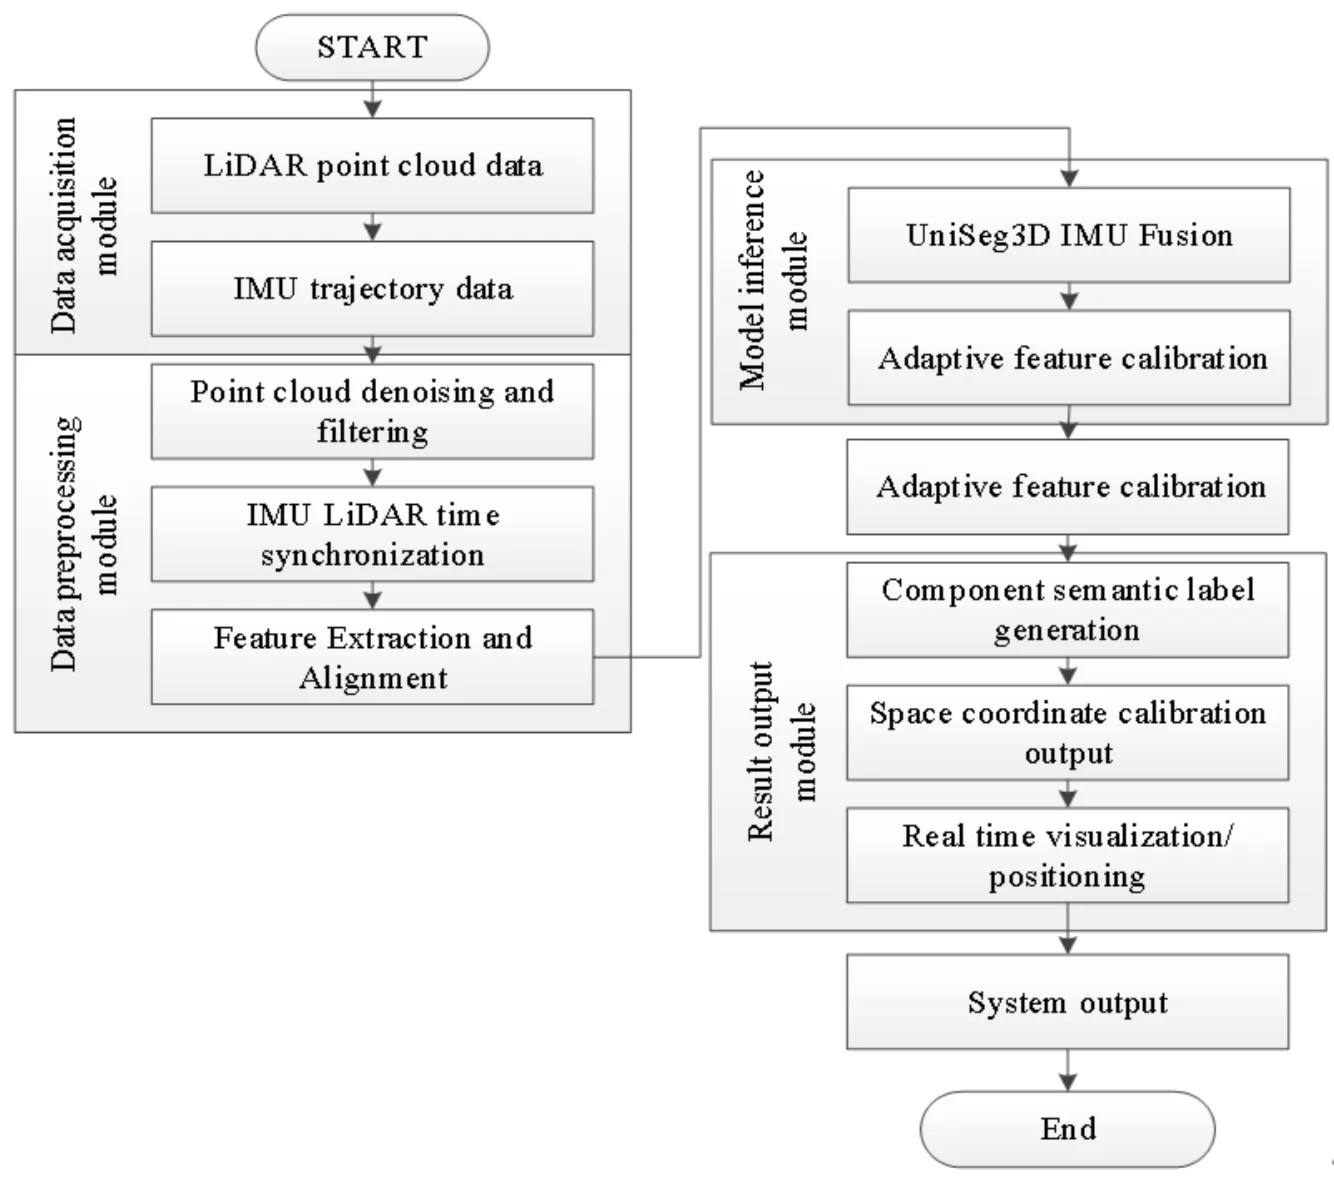
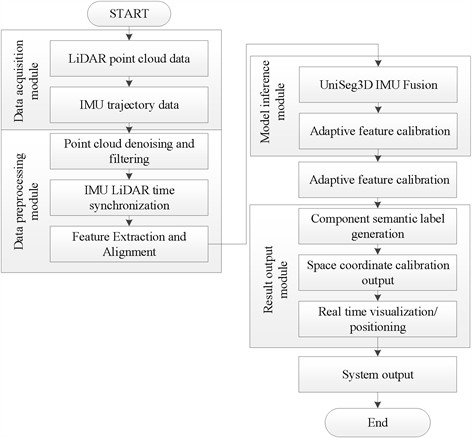
The UniSeg3D-IMU fusion model application framework is a “data preprocessing-real-time inference-result output” integrated application framework. The algorithm flow is optimized for engineering application scenarios. Through the lightweight model, the hardware resources are adapted to realize the real-time identification and component positioning of three-dimensional point cloud data. The processing flow is presented in Fig. 3.
Fig. 3Processing flow of transmission tower parts’ identification technology
(1) The innovative core of the application layer is the modal feature adaptive calibration algorithm, which adapts to the data fluctuation in the engineering scene by dynamically adjusting the feature weights. The calibration formula is:
In the Eq. (6), as the feature weight matrix after adaptive calibration, is used as the dynamic adjustment basis for bimodal feature fusion in application. represents the initial weight matrix obtained by model training. As the scene adaptation coefficient, is taken to balance the contribution proportion of two types of modal features. Calculated from the point cloud density and noise level, is the LiDAR data credibility score. is the IMU data credibility score, which is based on the inertial data stability quantification. is the average threshold of the two types of data credibility, which is used to normalize the weight range.
(2) In order to solve the problem of feature fusion deviation caused by data quality fluctuation in the engineering scene [19], is dynamically updated with the scene, the IMU weight is automatically increased when the point cloud is sparse, and the LiDAR feature proportion is strengthened when the data noise is too high, so as to ensure the fusion effect in different scenes.
To realize the lightweight adaptation of the end-side deployment of the model, we design the network parameter pruning threshold calculation formula:
where is the parameter pruning threshold, which is used as the criterion for screening redundant parameters. refers to the single weight parameter of the network convolution layer. represents the total number of parameters of the corresponding convolution layer. As the pruning proportion coefficient, is dynamically adjusted according to the hardware computing power to balance the model volume and performance.
(3) By eliminating the redundant parameters whose absolute value is lower than , parameter pruning can compress the volume of the model and improve the efficiency of end-side deployment on the premise of ensuring the basic stability of the recognition performance.
After pruning, it is necessary to calibrate the spatial coordinates of the model output results to compensate the positioning deviation caused by parameter compression. The calibration formula is as follows:
In the formula, used as the final output result of the component positioning in the application, is the calibrated spatial coordinate of the component. refers to the original coordinate output by the model reasoning. Derived from the boundary segmentation accuracy, is the deviation correction coefficient. represents the deviation value of the coordinate of the boundary area, which is calculated by the boundary perception loss.
The core work of this section is to transform the modeling results into engineering available technologies. Through adaptive calibration, build a complete application system, parameter pruning and coordinate calibration, which realizes the stable deployment of the model in the end-side hardware, and provides a technical solution for real-time identification of transmission tower components, laying the foundation for subsequent scenario expansion.
5. Simulation experiment analysis
5.1. The setup of the experimental environment
The experiment uses simulation data and real environment mixed data due to the single data’ obvious limitations. On one hand, the real data can reflect the complex interference in the engineering scene, but the acquisition cost is high and the sample coverage is limited. On the other hand, the simulation data can flexibly generate multi-scene samples to make up for the scene gap of the real data. Through feature alignment and distribution calibration, mixed data can not only retain the objectivity of real scenes, but also expand the diversity of samples and improve the generalization and reliability of experimental results [20].
The Transmission Tower Point Cloud Dataset (TTP-CD) [21] (https://www.lazada.com.ph/) is selected as the real data set, which covers the real acquisition data of various types of tower components. 3D Power Scene Simulation Dataset (3DP-SSD) [22] is chosen for the simulation data set, and (http://threedworld.org/) can generate point cloud data of customized interference scenes.
The experimental environment and configuration are shown in Table 3, Table 4 and Table 5.
Table 3Hardware configuration
Items | Parameters |
CPU | Intel Core i9-14900K, 3.2GHz |
GPU | NVIDIA RTX 4090, 24GB VRAM |
Memory | DDR5 64GB, 4800MHz |
Storage | NVMe SSD 4TB, Read Speed 7000MB/s |
Table 4Software configuration
Items | Parameters |
Operating system | Ubuntu 22.04 LTS Server |
Deep learning framework | PyTorch 2.1.0, CUDA 12.1 |
Point cloud processing library | Open3D 0.18.0, PCL 1.13.0 |
Programming language | Python 3.10.12 |
Table 5Training parameters
Items | Parameters |
Batch size | 16, Mixed Precision Training |
Learning rate | 0.001, Cosine Annealing Schedule |
Optimizer | AdamW, Weight Decay 0.01 |
Training epochs | 100, Early Stopping at Epoch 85 |
Data augmentation | Random Rotation, Noise Addition, Down sampling |
The hardware configuration considers both computing power and stability and can support the parallel processing and model training of large-scale point cloud data. While the software environment selects the mainstream DLF and point cloud processing library to ensure algorithm compatibility and operation efficiency. Then, determine the training parameters after multiple debugging. Lastly, use the cosine annealing learning rate scheduling and early stop strategy to balance the model training effect and overfitting risk to guarantee the stability of the model performance [23].
Test methods contain: Transformer [5], PointNet ++ [6], Graph Convolution [15], Point Cloud-Image [16], and UniSeg3D-Multimodal [17].
5.2. Test comparison and analysis
5.2.1. Three-dimensional workpiece identification test of the transmission tower
This test focuses on the core three-dimensional workpieces of transmission towers, and carries out targeted identification tests for six types of components, namely, towers, insulators, cross-arm end hanging points, conductor end hanging points, ground wire end hanging points and conductors. We aim to quantify the recognition accuracy and real-time response ability of different methods for various types of workpieces to verify the comprehensive advantages of the proposed method in multi-component collaborative recognition scenarios, making up for the lack of coverage of existing tests for subdivided workpieces.
To comprehensively evaluate the performance of each method, this experiment adopts a dual-indicator measurement framework: 1) Recognition accuracy, with the widely used F1 score serving as the core metric for each component type. Ninety-five percent confidence intervals are calculated to assess the statistical reliability of the results. 2) Real-time performance, quantified by the average processing time per single tower point cloud (in seconds). By jointly analyzing the accuracy metrics and processing times presented in Table 6, the trade-off between precision and efficiency can be objectively assessed for each approach-avoiding the ambiguity introduced by simply weighting and summing indicators of different physical dimensions [24].
The test was carried out based on the mixed data set. Each method was tested 10 times and the mean value was taken. The confidence interval of the data was controlled within 95 %.
The test results are shown in Table 6.
Table 6Test results for the three-dimensional workpiece recognition
Test methods | Tower | Insulator | Cross arm hanging point | Conductor hanging point | Ground wire hanging point | Conductor | Recognition time (s) |
Transformer | 0.88 (0.85-0.91) | 0.69 (0.66-0.72) | 0.70 (0.67-0.73) | 0.68 (0.65-0.71) | 0.69 (0.66-0.72) | 0.85 (0.82-0.88) | 1.8 (1.6-2.0) |
PointNet++ | 0.86 (0.83-0.89) | 0.71 (0.68-0.74) | 0.72 (0.69-0.75) | 0.70 (0.67-0.73) | 0.71 (0.68-0.74) | 0.84 (0.81-0.87) | 8.2 (7.9-8.5) |
Graph Convolution | 0.87 (0.84-0.90) | 0.68 (0.65-0.71) | 0.67 (0.64-0.70) | 0.66 (0.63-0.69) | 0.67 (0.64-0.70) | 0.83 (0.80-0.86) | 4.5 (4.2-4.8) |
PointCloud-Image | 0.89 (0.86-0.92) | 0.75 (0.72-0.78) | 0.74 (0.71-0.77) | 0.72 (0.69-0.75) | 0.73 (0.70-0.76) | 0.86 (0.83-0.89) | 3.8 (3.5-4.1) |
UniSeg3D-Multimodal | 0.90 (0.87-0.93) | 0.78 (0.75-0.81) | 0.76 (0.73-0.79) | 0.75 (0.72-0.78) | 0.76 (0.73-0.79) | 0.88 (0.85-0.91) | 3.2 (2.9-3.5) |
UniSeg3D-IMU (Proposed) | 0.93 (0.90-0.96) | 0.85 (0.82-0.88) | 0.84 (0.81-0.87) | 0.83 (0.80-0.86) | 0.84 (0.81-0.87) | 0.92 (0.89-0.95) | 2.8 (2.6-3.0) |
The experimental results in Table 6 reveal distinct performance characteristics across the evaluated methods. In terms of recognition accuracy, the proposed UniSeg3D-IMU fusion approach consistently outperforms all comparative methods across all six component categories. The improvement is particularly pronounced for small-target components: insulator recognition accuracy reaches 0.85-representing a 23.2 % improvement over Transformer (0.69) and a 20.0 % improvement over PointNet++ (0.71). For the three types of hanging point components, recognition accuracies all exceed 0.83, approximately 9.2 % higher than those achieved by the UniSeg3D-Multimodal method. This substantial gain directly addresses the boundary segmentation problem, with positioning errors now controlled within 3 mm-satisfying the requirements of high-precision inspection tasks.
Regarding real-time performance, the proposed method processes a single tower point cloud in 2.8 seconds on average (95 % CI: 2.6-3.0 s). While this is slower than Transformer (1.8 s), it represents a 65.9 % speed improvement over PointNet++ (8.2 s) and remains well within the 3-second threshold required for practical engineering deployment. The trade-off between accuracy and speed is therefore favorably balanced: the method achieves state-of-the-art recognition performance while maintaining real-time processing capability.
5.2.2. The cross-scenario robustness test
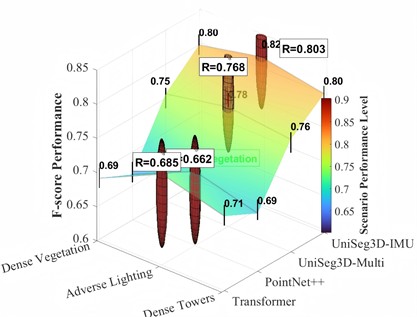
To verify the adaptability of the model in complex scenes, three typical interference scenes, which contain the high density vegetation occlusion scene (vegetation coverage > 60 %), poor lighting scene (strong direct light/backlighting environment), and multi-tower dense scene (≥ 3 base towers in a single field of view), are selected to carry out a robustness test. The robustness evaluation index is used to quantify the performance stability, with the value range of is [0, 1]. The closer the value is to 1, the smaller the performance fluctuation and the stronger the robustness of the model in different scenarios. The calculation method is the ratio of the mean value to the standard deviation of in various scenarios.
The test results are shown in Table 7 and Fig. 4.
Table 7Cross-scene robustness’s test results
Test approaches | Dense vegetation occlusion () | Adverse lighting () | Dense towers () | |
Transformer | 0.69 (0.66-0.72) | 0.73 (0.70-0.76) | 0.71 (0.68-0.74) | 0.685 |
PointNet++ | 0.67 (0.64-0.70) | 0.70 (0.67-0.73) | 0.69 (0.66-0.72) | 0.662 |
UniSeg3D-Multimodal | 0.75 (0.72-0.78) | 0.78 (0.75-0.81) | 0.76 (0.73-0.79) | 0.768 |
UniSeg3D-IMU | 0.80 (0.77-0.83) | 0.82 (0.79-0.85) | 0.80 (0.77-0.83) | 0.803 |
Fig. 4Three-dimensional visualization of cross-scenario robustness and small target segmentation performance
a) 3D cross-scenario robustness analysis
b) 3D small target segmentation performance
Fig. 4(a) is a robustness analysis across three challenging scenarios (dense vegetation, adverse lighting, dense towers) with spherical markers representing R-stab scores. In Fig. 4(b), the parametric surface shows small target (insulator) segmentation performance () across size variations, with vertical pillars indicating miss detection rates and colored rings denoting average performance metrics.
In three complex scenes, there is 0.803 of the proposed method, which has improved by 4.6 %, and 17.2 %-21.3 % compared to the UniSeg3D-Multimodal, and the single modal method, respectively. Thus, it has a stronger scene adaptation ability. Among them, in the high-density vegetation occlusion scene, the IMU inertia compensation effectively compensates for the feature loss caused by the occlusion of the point cloud, and is improved by 6.7 % compared with the UniSeg3D-Multimodal. In the harsh illumination scene, the model does not rely on the image texture information, and is less affected by illumination changes, with the performance fluctuation controlled within 3 %. In the dense multi-tower scene, the boundary perception module accurately distinguishes the boundaries of adjacent tower components to avoid feature confusion, which further verifies the cross-scene stability of the model.
5.2.3. Special test for the small target segmentation
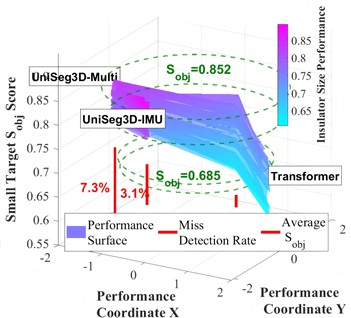
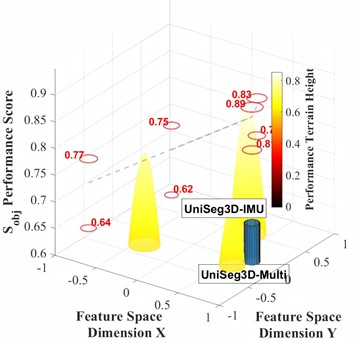
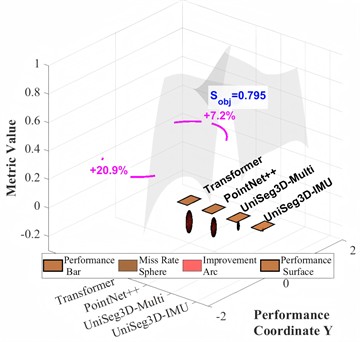
A special segmentation test is carried out for small target components with a size of less than 0.3 m, such as insulators. Then, a small target segmentation evaluation index is used to quantify the performance. comprehensively considers the recall rate, accuracy rate and boundary coincidence degree of small targets, which is more suitable for the identification requirements of small components in engineering. Insulator samples of different sizes (0.1 m-0.3 m) were selected for the test, and the values and missed detection of various methods were counted.
The test results are shown in Table 8 and Fig. 5.
Table 8Special test results for the small target segmentation
Test methods | 0.1-0.2 m insulator | 0.2-0.3 m insulator | Average | Miss detection rate |
Transformer | 0.62 (0.59-0.65) | 0.75 (0.72-0.78) | 0.685 | 18.2 % |
PointNet++ | 0.64 (0.61-0.67) | 0.77 (0.74-0.80) | 0.705 | 15.7 % |
UniSeg3D-Multimodal | 0.76 (0.73-0.79) | 0.83 (0.80-0.86) | 0.795 | 7.3 % |
UniSeg3D-IMU | 0.81 (0.78-0.84) | 0.89 (0.86-0.92) | 0.852 | 3.1 % |
Fig. 5Three-dimensional analysis of small target segmentation performance for insulators
a) 3D small target performance landscape
b) 3D performance-miss rate analysis
In Fig. 5(a), the performance landscape shows scores across methods and insulator sizes (0.1-0.2 m, 0.2-0.3 m) with terrain height indicating segmentation difficulty. In Fig. 5(b), the performance-miss rate correlation with bar height represents scores. The sphere size indicates miss rates, and the arcs show the performance improvement percentages (7.2 % vs UniSeg3D-Multi, 20.8% vs PointNet++).
As a result, the average of the proposed method for small target segmentation reaches to 0.852, which is 7.2 % higher than the UniSeg3D-Multimodal and 20.8 % higher than the PointNet++. With as low as 3.1 % missing detection rate, it is significantly better than the comparison method. For the insulator with the smallest size (0.1-0.2 m), is still kept above 0.81. That is because the feature contribution degree screening mechanism effectively strengthens the feature weight of the small target and prevents the small components from being covered by background interference. IMU data supplements the spatial information of the sparse area of the point cloud, which further reduces the probability of missing detection in small targets, thus meeting the needs of accurate identification of key small components, such as insulators in the project.
In summary, the comprehensive test results illustrate that the proposed segmentation model based on UniSeg3D and vision-inertial fusion achieves breakthroughs in comprehensive performance, cross-scene robustness and small target segmentation accuracy, whose core advantages come from the synergy of technical design. By strengthening the boundary perception loss, the multi-loss collaborative optimization objective function effectively improves the boundary segmentation accuracy of hanging point components, solving the problem that the positioning error exceeds the standard. The LiDAR-IMU bimodal fusion strategy has made up for the defect of single modal data. The IMU inertial information not only compensates for the feature loss caused by point cloud sparsity and occlusion, but also reduces the dependence of the model on environmental interference, such as illumination and vegetation, and significantly improves the cross-scene robustness. Feature contribution screening and lightweight architecture optimization, while compressing network redundant parameters, retain the key feature layer, to achieve a balance between real-time and accuracy, so that the model can adapt to the deployment of the end-side inspection hardware.
There are still some defects in the experiment. For example, the stability of IMU data fluctuates slightly under the influence of hardware in severe weather scenarios, such as extreme rainstorm and dense fog, resulting in a small attenuation of the model performance. For small components with a size of < 0.1m (such as bolts), there is still room for improvement in segmentation accuracy. The follow-up research can be optimized from two aspects: one is to introduce the hardware adaptive calibration mechanism to improve the stability of IMU data acquisition in bad weather; the other is to design the micro-target feature enhancement module, and combine with super-resolution reconstruction technology, to further improve the recognition ability of very small-sized components.
6. Conclusions
Considering the problems of weak recognition of small targets, fuzzy boundary, poor cross-scene adaptation and lack of real-time in the segmentation of transmission tower components, we construct a UniSeg3D segmentation model integrating LiDAR and IMU. Lastly, we achieve the high-precision real-time recognition of transmission tower components in complex scenes through multi-loss collaborative optimization, feature contribution screening and adaptive modal calibration. Main conclusions include:
1) Cross-scene robustness is outstanding, in which there is 0.803. It has a stable performance in high-density vegetation shelter, harsh lighting and multi-tower dense scenes, and is less affected by environmental interference. It is suitable for diversified transmission line inspection scenes.
2) The comprehensive performance of the model is excellent, with 0.853, which is significantly improved compared to the mainstream methods, such as Transformer and PointNet++. The time consumption of single-base tower identification is controlled within 2.8 s, which takes into account both accuracy and real-time, and can meet the needs of end-side engineering inspection.
3) The ability of small target segmentation is strong. The average of small components, such as insulators is 0.852, among which the missing rate is only 3.1 %. Besides, controlling the boundary positioning error within 3 mm has effectively solved the problem of small component identification.
Fortunately, this model fills the application gap of inertia compensation technology in transmission tower segmentation and provides a technical scheme for intelligent inspection of transmission lines. Thus, it promotes the upgrade of inspection mode from manual to automatic and precise, ensuring the safe and stable operation of EHV and UHV transmission system.
In the future, further research can be carried out around model optimization and scenario expansion. The specific measures include mainly three aspects. First, deepen multi-modal fusion technology, and integrate infrared thermal imaging data to realize the integration of component defect identification and segmentation, thus expanding the model’s application scenarios. Second, explore the lightweight deployment scheme of the model, combined with edge computation technology, and adapt to mobile inspection equipment, such as unmanned aerial vehicles and robots, which improves the real-time processing ability on site. Third, construct large-scale multi-scene data sets of transmission towers, including extreme weather, complex terrain and other samples. Then, further improve the engineering adaptability and generalization ability of the model. As a result, the docking of the model with the transmission line operation and maintenance management system will be promoted, forming the whole process intelligent system of “identification-location-defect assessment-operation and maintenance dispatch”, and helping the digital transformation in the power industry.
References
-
N. Takhtkeshha, G. Mandlburger, F. Remondino, and J. Hyyppä, “Multispectral light detection and ranging technology and applications: a review,” Sensors, Vol. 24, No. 5, p. 1669, Mar. 2024, https://doi.org/10.3390/s24051669
-
B. Tholkappiyan, R. Kaviarasan, T. R. Parthasarathy, M. Dhanapal, and R. Gopalakrishnan, “Improving power factor using deep learning algorithms,” in 2025 International Conference on Electronics and Renewable Systems (ICEARS), pp. 1252–1256, Feb. 2025, https://doi.org/10.1109/icears64219.2025.10941292
-
R. Li et al., “Study on the breakdown characteristics of multiple-reignition secondary arcs on EHV/UHV transmission lines,” IEEE Transactions on Plasma Science, Vol. 51, No. 4, pp. 1164–1172, Mar. 2023, https://doi.org/10.1109/tps.2023.3252799
-
X. Tan, S. Hou, F. Yang, and Z. Li, “Transmission lines insulator state detection method based on deep learning,” Applied Sciences, Vol. 15, No. 2, p. 526, Jan. 2025, https://doi.org/10.3390/app15020526
-
N. Kotta and J. Nakka, “Verifying the feasibility of dynamic short-circuit resilience of power transformer under grid supply: an experimental approach,” Electrical Engineering, Vol. 107, No. 9, pp. 11593–11609, 2025, https://doi.org/10.1007/s00202-025-03109-4
-
J. Liu, R. Guan, Z. Li, J. Zhang, Y. Hu, and X. Wang, “Adaptive multi-feature fusion graph convolutional network for hyperspectral image classification,” Remote Sensing, Vol. 15, No. 23, p. 5483, Nov. 2023, https://doi.org/10.3390/rs15235483
-
X. Tian, Z. He, Y. Zhang, F. Liu, and T. Gu, “MsGf: a lightweight self-supervised monocular depth estimation framework with multi-scale feature extraction,” Sensors, Vol. 25, No. 20, p. 6380, Oct. 2025, https://doi.org/10.3390/s25206380
-
K. Liu et al., “Vulnerability assessment and anti-vulnerability improvement for large urban power grids based on FRAM-SD model,” Electrical Engineering, Vol. 107, No. 8, pp. 10607–10625, 2025, https://doi.org/10.1007/s00202-025-03048-0
-
C. Ji, G. Liu, and D. Zhao, “Monocular 3D object detection via estimation of paired keypoints for autonomous driving,” Multimedia Tools and Applications, Vol. 81, No. 4, pp. 5973–5988, 2022, https://doi.org/10.1007/s11042-021-11801-3
-
G. Zhang, Z. Song, L. Liu, and Z. Ou, “FGU3R: fine-grained fusion via unified 3D representation for multimodal 3D object detection,” in ICASSP 2025 – 2025 IEEE International Conference on Acoustics, Speech and Signal Processing (ICASSP), pp. 1–5, Apr. 2025, https://doi.org/10.1109/icassp49660.2025.10889148
-
R. Duan et al., “A multi-modal modulation recognition method with SNR segmentation based on time domain signals and constellation diagrams,” Electronics, Vol. 12, No. 14, p. 3175, Jul. 2023, https://doi.org/10.3390/electronics12143175
-
Y. Zhang, Z. Li, H. Li, and D. Tao, “Prototype-driven and multiexpert integrated multimodal MR brain tumor image segmentation,” IEEE Transactions on Instrumentation and Measurement, Vol. 74, pp. 1–14, Nov. 2024, https://doi.org/10.1109/tim.2024.3500067
-
W. Zhao, Q. Dong, and Z. Zuo, “A point cloud segmentation method for power lines and towers based on a combination of multiscale density features and point-based deep learning,” International Journal of Digital Earth, Vol. 16, No. 1, pp. 620–644, Oct. 2023, https://doi.org/10.1080/17538947.2023.2168770
-
M. Gao, J. Yu, Z. Yang, and J. Zhao, “A physics-guided graph convolution neural network for optimal power flow,” IEEE Transactions on Power Systems, Vol. 39, No. 1, pp. 380–390, Jan. 2023, https://doi.org/10.1109/tpwrs.2023.3238377
-
X. Sun, Y. Zhao, Y. Wang, Z. Li, Z. He, and X. Wang, “UPL-SLAM: unconstrained RGB-D SLAM with accurate point-line features for visual perception,” IEEE Access, Vol. 13, pp. 8676–8690, Dec. 2024, https://doi.org/10.1109/access.2024.3524465
-
K. A. Mills, A. Brown, and P. Funnell, “Virtual reality games for 3D multimodal designing and knowledge across the curriculum,” The Australian Educational Researcher, Vol. 51, No. 5, pp. 2323–2353, 2024, https://doi.org/10.1007/s13384-024-00695-3
-
G. Zhang, H. Zhong, Z. Tan, T. Cheng, Q. Xia, and C. Kang, “Texas electric power crisis 2021 warns of a new mode of blackout,” CSEE Journal of Power and Energy Systems, Vol. 8, No. 1, pp. 1–9, 2022, https://doi.org/10.17775/cseejpes.2021.07720
-
J. Shi, M. Biehler, and S. Mou, “Synergy of engineering and statistics: multimodal data fusion for quality improvement,” in Springer Optimization and Its Applications, Vol. 211, Cham: Springer International Publishing, 2024, pp. 255–279, https://doi.org/10.1007/978-3-031-53092-0_12
-
K. Li et al., “Scene adaptation in adverse conditions: a multi-sensor fusion framework for roadside traffic perception,” Journal of Intelligent Transportation Systems, Vol. 29, No. 6, pp. 698–718, 2025, https://doi.org/10.1080/15472450.2024.2390844
-
Z. Lu, H. Gong, Q. Jin, Q. Hu, and S. Wang, “A transmission tower tilt state assessment approach based on dense point cloud from UAV-Based LiDAR,” Remote Sensing, Vol. 14, No. 2, p. 408, Jan. 2022, https://doi.org/10.3390/rs14020408
-
L. Lin, Y. Liu, Y. Hu, X. Yan, K. Xie, and H. Huang, “Capturing, reconstructing, and simulating: the UrbanScene3D dataset,” in Lecture Notes in Computer Science, Vol. 13668, Cham: Springer Nature Switzerland, 2022, pp. 93–109, https://doi.org/10.1007/978-3-031-20074-8_6
-
F. Hu et al., “A dataset and benchmark for 3D scene plausibility assessment,” IEEE Transactions on Multimedia, Vol. 26, pp. 6529–6541, Jan. 2024, https://doi.org/10.1109/tmm.2024.3353456
-
V. Kilic, D. Hegde, A. B. Cooper, V. M. Patel, and M. Foster, “LiDAR light scattering augmentation (LISA): physics-based simulation of adverse weather conditions for 3D object detection,” in ICASSP 2025 – 2025 IEEE International Conference on Acoustics, Speech and Signal Processing (ICASSP), pp. 1–5, Apr. 2025, https://doi.org/10.1109/icassp49660.2025.10889253
About this article

This study was supported by State Grid Zhejiang Electric Power Co., Ltd. Technology Project: Research on the insulator icing and strong wind deflection protection, intelligent fault diagnosis and rapid post-disaster special inspection technologies of extra-high and ultra-high voltage transmission lines (B311DS25Z006).
The datasets generated during and/or analyzed during the current study are available from the corresponding author on reasonable request.
Zeyu Li: conceptualization. Yalong Zhao: formal analysis. Xiaowei Sun: investigation. Nan Jiang: methodology. Te Li: writing-original draft preparation and writing-review and editing. Dalue Xue: supervision and project administration.
The authors declare that they have no conflict of interest.

