Abstract
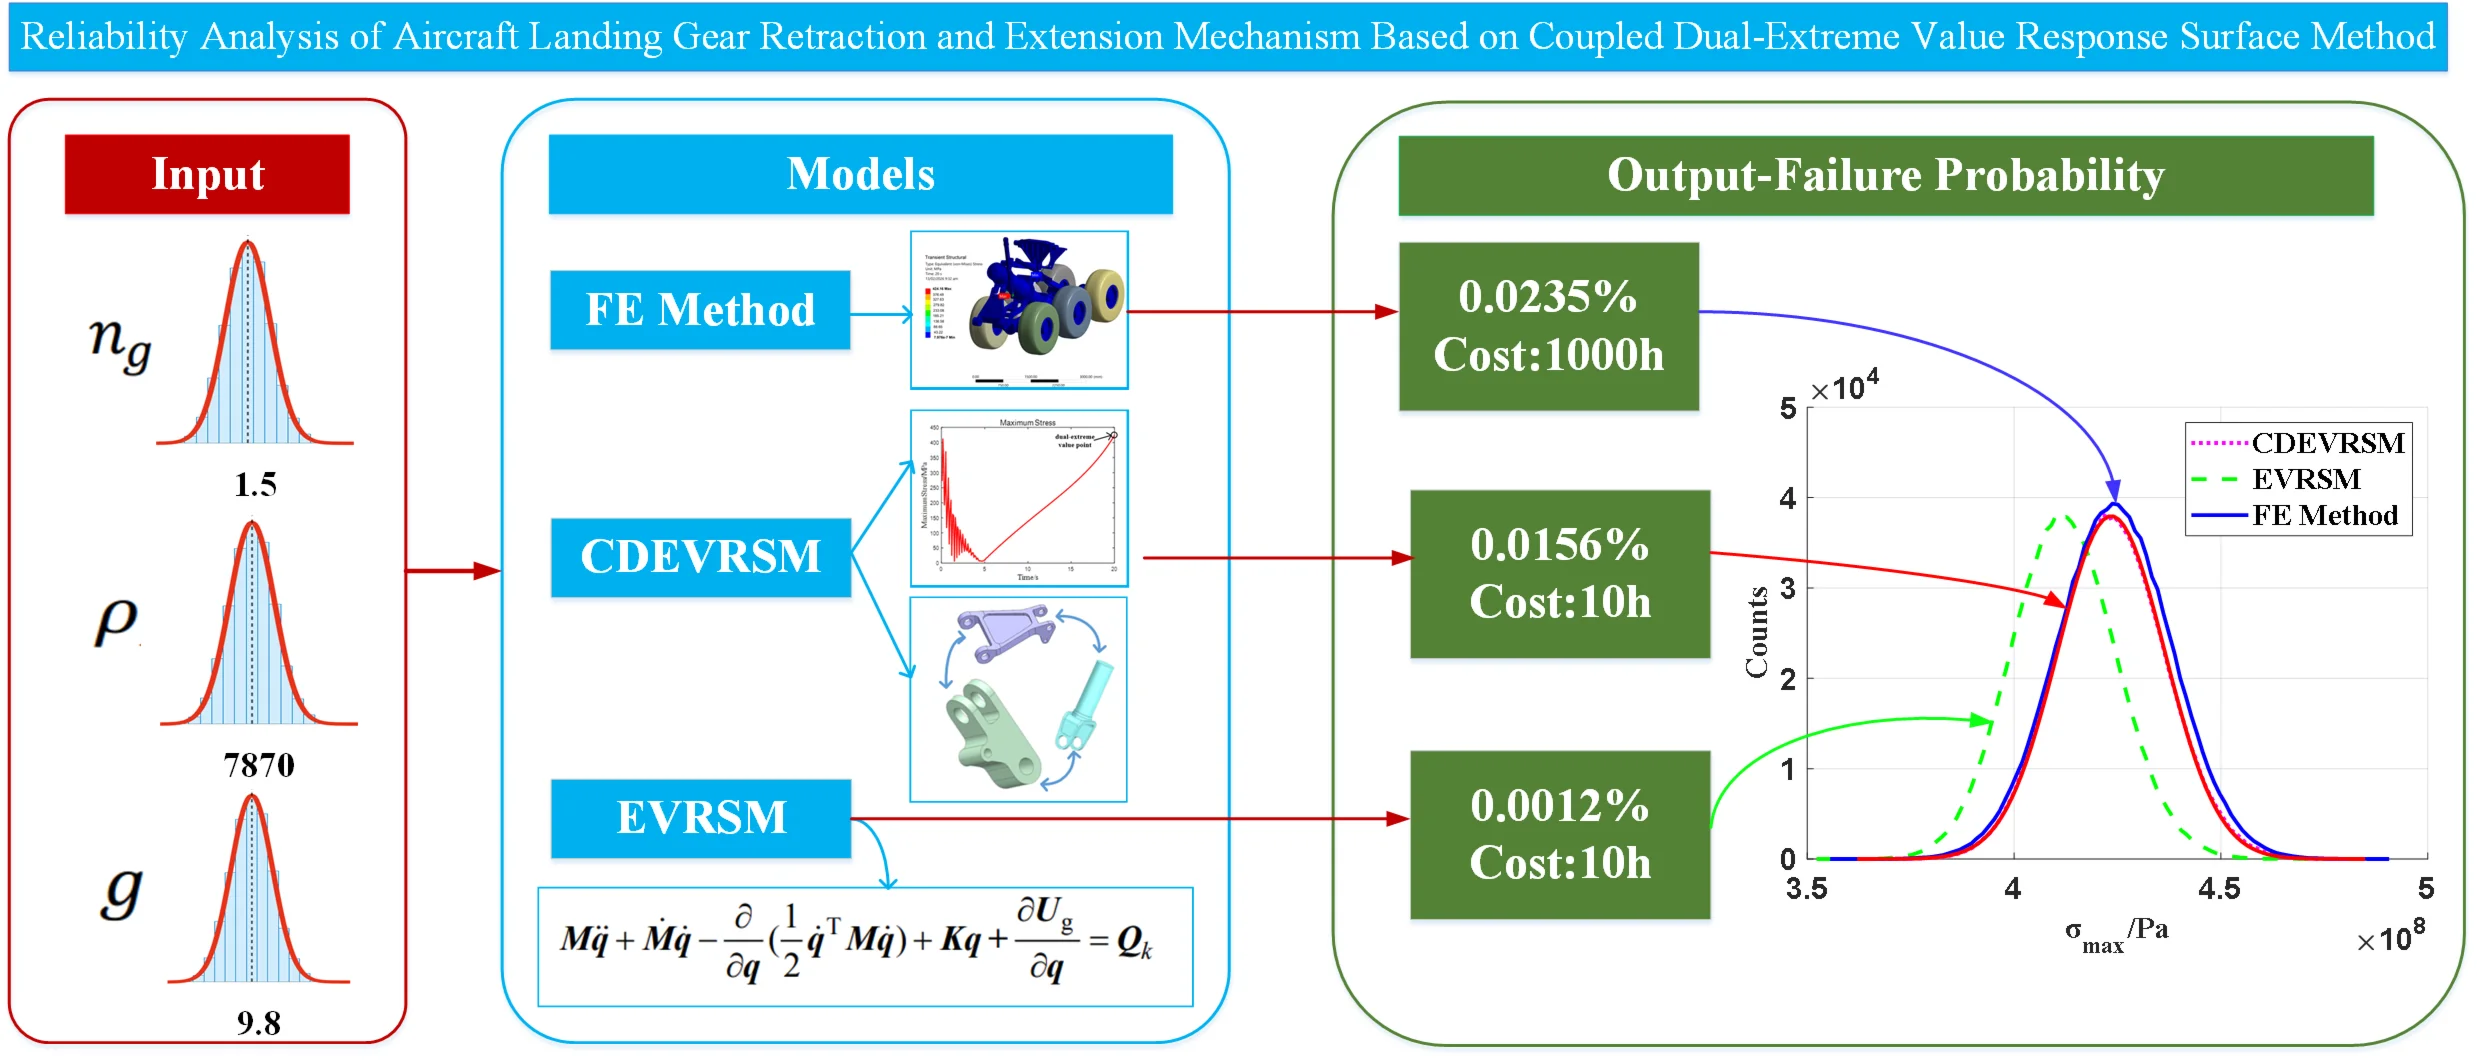
The landing gear system is one of the critical subsystems of an aircraft, directly affecting the safety of takeoff and landing. The landing gear retraction and extension mechanism (LGREM) exhibits strong nonlinearity, with complex coupling interactions among its parts. Using multi-rigid-body kinematics and dynamics to calculate stresses and strains of the LGREM would be highly challenging. This paper proposes a coupled dual-extreme value response surface method (CDEVRSM) that considers parameter coupling between parts. By taking the dual- extreme values obtained from finite element (FE) transient structural simulations as output responses, and using overload coefficient, material density, and gravitational acceleration as random variables, a response surface function (RSF) is constructed for strength reliability analysis of the LGREM. Employing the Monte Carlo algorithm with 1,000,000 large-scale sampling, the reliability of the LGREM is calculated to be 99.9844 % by statistical calculation. Its relative error was reduced by approximately 61 % compared with the extreme value response surface method. Moreover, compared to approximately 1000 hours required by FE methods, the CDEVRSM reduces computation time to approximately 10 hours, greatly improving computational efficiency. The sensitivity of three random input variables to the reliability of the LGREM was analyzed, and the main and secondary factors affecting the reliability of the LGREM are ranked in descending order of importance as overload coefficient, material density, and gravitational acceleration.
Highlights
- A coupled dual-extreme value response surface method was proposed and its relative error was reduced by approximately 61% compared with the extreme value response surface method.
- The primary factors affecting the reliability of the landing gear retraction and extension mechanism are, in order of importance: overload coefficient, material density, and gravitational acceleration.
- The standard deviation of the overload coefficient should be strictly controlled to improve the reliability of landing gear retraction and extension mechanism in engineering applications.
- Transient analysis indicates that the stress and strain on the REA and FS are relatively high, while those on other parts are significantly lower than the yield stress and yield strain of corresponding materials.
- The reliability of the landing gear retraction and extension mechanism can be simplified to the product of the reliability of the REA and the FS.
1. Introduction
The landing gear system is one of the key subsystems of an aircraft and an important device for taxiing, ground movement, and parking. According to the 2021 statistics report of transportation safety board of Canada, there were 83 landing accidents in 2021, among which 18 were due to landing gear retraction and extension failures, accounting for 21.7 %. From 2011 to 2021, there were 1,113 landing accidents and 237 landing gear failures, accounting for 21.3 % [1]. The frequent occurrence of landing gear accidents is mainly due to various uncertainties involved in the design, manufacture, and service, including the inherent dispersion of parameters such as material properties and loads, as well as subjective errors caused by the designers. These uncertainties have a significant impact on the overall performance of the landing gear [2].
Mechanism reliability problems commonly exhibit strong nonlinear characteristics, with complex coupling interactions among parts, making it difficult to derive explicit analytical solutions. Response surface method are often employed for mechanism reliability analysis. Bucher and Bourgund proposed response surface methods which adopted a quadratic polynomial without cross terms and obtained the design point through interpolation iteration calculation [3]. Kim and Na believed that the RSF should fit the original failure plane as accurately as possible in the most likely failure area, and proposed a gradient projection method for selecting the sampling point data [4]. Nguyen et al. constructed the RSF through two weighted regression models, improving the calculation efficiency and accuracy [5]. Roussouly et al. established a sparse response surface from an initial Latin Hypercube Sampling. It is refined in a region of interest defined with respect to an importance level on probability density in the design point [6]. Zhang et al. proposed the extreme value response surface method by taking the double-link flexible robot manipulator as the analysis object. It takes the maximum value of stress and strain as the output response [7]. Cardoso proposed a method by combining neural networks and Monte Carlo simulation to reduce the computational cost and it could be used to evaluate extremely low probability failures [8]. Naess utilized the regularity of the failure probability varying with parameters to increase the computational efficiency of the Monte Carlo method [9]. Aslett was the first to propose the application of multi-level Monte Carlo to reliability problems, which could significantly improve the computational efficiency for large or complex system structures [10]. Bamrungsetthapong introduced the fuzzy concept to calculate the fuzzy reliability of series-parallel systems [11]. Song proposed a neural network regression-distributed collaborative strategy based on a developed two-step error control technique to improve the multi-failure probabilistic analysis of a turbine bladed disk [12]. Ren et al. presents artificial neural network response surface method based on early stopping technique and the artificial neural network response surface method based on regularization theory [13]. Zhu et al. proposed a novel intelligent response surface method in which a machine learning algorithm, namely Gaussian process regression, is used to approximate the high-dimensional and highly nonlinear response hypersurface [14]. Qing et al. analyzed the reliability of the steering mechanism through combining the dynamic simulation model and the first-order second-moment method based on an artificial neural network [15].
Wang et al. described the fuzziness of structural fatigue problems and used fuzzy mathematics theory to obtain the reliability of the nose wheel of the landing gear [16]. Yang et al. established a reliability model of the landing gear considering the actuator position, friction coefficient, and side wind load, to calculate the reliability of the landing gear [17]. Yin et al. combined mechanism dynamics and the hydraulic system to establish a simulation model, studied the influence of key parameters such as side wind speed, damping hole diameter, liquid capacity, friction force, and oil leakage, and established a quadratic polynomial response surface model to evaluate the reliability of the landing gear retraction and extension system [18]. Zhou et al. considered the random uncertainties of factors such as the friction coefficient and assembly error, as well as the change in wear at the hinge, and established reliability models for landing gear jamming failure, positioning failure, and precision failure based on the adaptive Kriging surrogate model [19]. Xu et al. established a dynamic model of the LGREM considering seven joint clearances, and obtained a reliability analysis model of the motion accuracy of the LGREM based on the adaptive Kriging surrogate model [20]. Gao et al. established a dynamic model of the main landing gear considering multiple random variables using the Lagrange method, derived the limit state function between the random variables and the extreme output response by improved the Kriging model [21]. Lv et al. combined prior knowledge and experimental measurement data using the Bayesian method to reasonably estimate the variable parameters in the model, effectively utilized the test data for expansion, and provided a novel method for accurately evaluating the reliability of the landing gear [22].
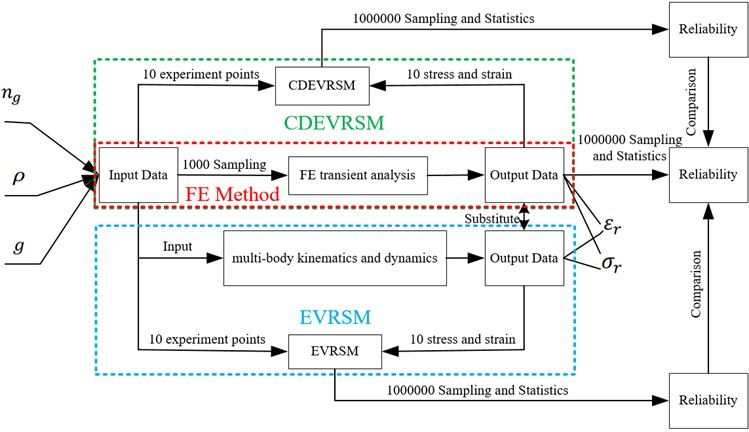
For the LGREM, there are various failure modes. The failure modes include motion jamming failure, motion positioning failure, motion accuracy failure, strength failure, and fatigue failure. Most studies focusing on motion jamming failure, motion positioning failure, motion accuracy failure, while few have addressed the strength reliability analysis of the LGREM. Currently, the strength reliability of mechanisms is primarily assessed by calculating stresses and strains by using multi-body kinematics and dynamics. However, this approach is only suitable for simple mechanisms with few parts, such as crank-slider or connecting rod mechanisms. For complex mechanisms like the LGREM – characterized by strong nonlinearity and significant parameter coupling – applying multi-body kinematics and dynamics to compute stress and strain becomes highly challenging. This paper addresses this issue by employing a FE transient analysis module. The CDEVRSM is proposed to improve the accuracy in fitting the actual limit state equation for strength reliability prediction of the LGREM. Dual-extreme values in time and space domains are used as output responses, while overload coefficient, material density, and gravitational acceleration serve as random input variables. The coupling effects among different parts’ random inputs are simultaneously considered, thereby improving the calculation accuracy and efficiency of the LGREM reliability analysis. Fig. 1 illustrates the workflow for reliability analysis of the LGREM using the CDEVRSM.
Fig. 1Flowchart of the LGREM reliability analysis
2. Reliability model
2.1. Geometric model
The three-dimensional digital model of the LGREM of a certain aircraft is sourced from a 3D model open-source website: https://www.sanweimoxing.com/, as shown in Fig. 2.
Fig. 2Schematic diagram of the LGREM for a specific aircraft. Available: https://www.sanweimoxing.com/tuzhi/202109/48180.html
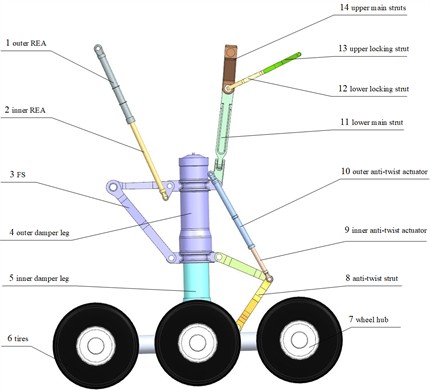
The LGREM model of a certain aircraft is shown in Fig. 2. The LGREM is generally composed of 1, outer retraction extension actuator (REA), 2, inner REA, 3, front strut (FS), 4, outer damper leg, 5, inner damper leg, 6, tires, 7, wheel hub, 8, anti-twist strut, 9, inner anti-twist actuator, 10, outer anti-twist actuator, 11, lower main strut, 12, lower locking strut, 13, upper locking strut and 14, upper main struts, etc. Among them, the REA is used to provide the power for the landing gear to complete the retraction and extension actions; the position lock is mainly used to firmly lock the landing gear in the specified position after it has completed the retraction and extension actions, preventing unexpected movement; the damper is used to absorb and reduce the impact and vibration generated by the aircraft during landing, ground taxiing and parking; the struts are used to bear and transfer the load, achieve motion conversion; the wheels and hubs mainly enable the aircraft to move on the ground and bear and transfer the load; the anti-twist strut and anti-twist actuator mainly limit the torsion and abnormal swing of the landing gear during ground movement and loading, ensuring structural stability.
2.2. FE analysis
During retraction and extension of the landing gear, it is subjected to the effects of gravitational force, inertial force, and aerodynamic drag. Based on the kinematics and dynamics of multi-rigid bodies, a considerable number of time-varying differential equations are obtained, making it difficult to derive the mathematical expressions for the stress and strain of the LGREM. In this paper, the transient structural analysis module of ANSYS WORKBENCH is used to calculate the stress and strain responses of the LGREM.
Firstly, import the geometric model of the LGREM. To improve the efficiency of FE simulation and enhance mesh quality, the original CAD geometry is appropriately simplified by removing non-critical fillet details. The commonly used materials for landing gears are 300M, 7075-T6, Ti-1023, and rubber and fabric. The material properties such as density, Poisson’s ratio, Young's modulus, and yield strength are input to ANSYS WORKBENCH, shown in Table 1.
Table 1Material properties of the LGREM
Materials | Density (Kg/m3) | Poisson’s ratio | Young’s modulus (GPa) | Yield stress (MPa) | Parts No. |
300M | 7.87×10³ | 0.28 | 205 | 1515 | 4, 5 |
7075-T6 | 2.81×10³ | 0.33 | 71.7 | 503 | 1, 2, 3, 7, 9, 10 |
Ti-1023 | 4.68×10³ | 0.34 | 110 | 1000 | 8, 11, 12, 13, 14 |
Rubber and fabric | 1.5×10³ | 0.5 | 8×10⁻³ | 20 | 6 |
Secondly, define the kinematic pair connection relationship between parts, mainly including sliding, hinge, and fixed constraints. Six tires are mounted and fixed on the wheel hubs, experiencing relatively small forces during landing gear extension and retraction. To simplify the motion model, the tires are treated as rigid bodies in the analysis, excluded from meshing, and their stress and strain are not analyzed. An automatic meshing method was used to generate the second-order quadratic tetrahedral mesh. Each tetrahedral element has 10 nodes, with 3 degrees of freedom per node. Control the size of local meshes to generate 93802 elements and 163896 nodes. The main loads acting on the LGREM during the retraction and extension process include gravitational force, inertial force, and aerodynamic drag. The calculation expression of the landing gear’s gravitational force is shown in Eq. (1) [23]:
where is the overload coefficient; is the mass of the rotating part; is the gravity acceleration and is taken as 9.806 N/Kg. The calculation expression of the inertial torque acting on the LGREM is shown in Eq. (2) [23]:
where represents the moment of inertia relative to the rotating shaft, and is the angular acceleration of the landing gear’s rotation. The expression for calculating aerodynamic drag is shown in Eq. (3) [23]:
where represents the drag coefficient; is the projected area on the vertical plane of the airflow; represents dynamic pressure.
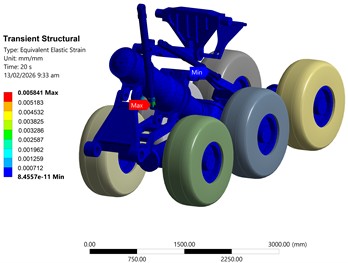
After applying the mass forces, inertial forces, and aerodynamic drag, a linear joint load with a velocity of 50 mm/s is further applied to the sliding pair of the REA. The total simulation duration is set to 20 seconds, with the load loaded incrementally using a substep strategy. Automatic time step adjustment is enabled, with an initial number of substeps set to 25, minimum substeps to 20, and maximum substeps to 250. During the solution process, the software adaptively adjusts the increment size within the specified substep range. The stress distribution cloud diagram and strain distribution cloud diagram were obtained by solving, as shown in Fig. 3.
Fig. 3Stress and strain cloud diagram of the LGREM at t= 20 s
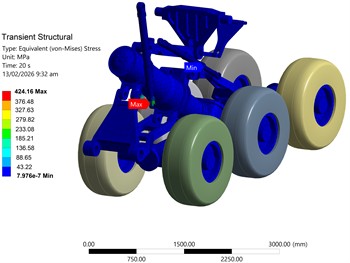
a) Stress cloud diagram
b) Strain cloud diagram
It can be seen from the Fig. 3 that the maximum values of stress and strain are both near the hinge connection between the inner cylinder of the REA and the FS. The stress and strain on the REA and the FS are relatively large, while the stress and strain on other parts are far lower than the yield stress and yield strain of the corresponding part materials. Through the analysis of the FE simulation results, it was found that under different input conditions of material density, gravitational acceleration and overload coefficient, the output stress and strain changed, but the positions of the maximum stress and maximum strain remained basically unchanged, both being near the hinge connection between the inner cylinder of the REA and the FS.
To minimize the impact of mesh size on computational results, a mesh independence verification was conducted by generating three sets of meshes – coarse, medium, and fine – with element sizes of 100 mm, 80 mm, and 60 mm, respectively. The maximum stress and maximum strain in the LGREM were selected as convergence criteria. Detailed mesh information and simulation results are shown in the Table 2.
Analysis of the tabulated data indicates that the relative error between the medium and coarse mesh stress results is 4.3 %, while the strain result has a relative error of 5 %. Between the fine and medium meshes, the relative errors for stress and strain are 0.56 % and 0.87 %, respectively. As the mesh becomes finer, the relative errors between the medium and fine meshes remain below 3 %, indicating that the medium mesh meets the required computational accuracy. Therefore, the medium mesh model will be used for all subsequent simulations.
Table 2Meshing convergence verification data
Meshing | Element size (mm) | Elements | Nodes | Maximum stress (MPa) | Maximum strain (10-3m) |
Coarse meshing | 100 | 55281 | 98953 | 406.81 | 5.563 |
Medium meshing | 80 | 93802 | 163896 | 424.16 | 5.841 |
Fine meshing | 60 | 146129 | 246614 | 426.55 | 5.892 |
According to Bernoulli's law of large numbers, the frequency of occurrence of an event converges in probability to its probability when the number of trials is sufficiently large. The failure probability of LGREM is extremely low, so this trials were conducted 1000,000 times. However, conducting 1000000 FE simulations is often impractical. This paper uses 1,000 real FE simulation data points and a normal distribution extrapolation method to obtain 1,000,000 stress and strain responses of LGREM. Based on the Monte Carlo method, 1000 sampling for overload coefficient, material density, and gravitational acceleration was fed into the FE transient analysis module to obtain the real stress and strain of the LGREM. Assuming that the stress and strain values follow a normal distribution, the mean and standard deviation of stress and strain were calculated. Using Monte Carlo methods, 1000000 large-scale samples were generated. compared individually with the material’s yield stress and yield strain. If the stress or strain exceeded the corresponding material yield value, one failure was recorded for the part. The failure probability obtained by FE method was used as accuracy reference.
2.3. The coupled dual-extreme value response surface method
The strength reliability analysis of the LGREM primarily involves stress reliability and strain reliability calculations. Transient analysis of the LGREM indicates that the stress and strain on the REA and FS are relatively high, while those on other parts are significantly lower than the yield stress and yield strain of corresponding materials, thus having negligible impact on reliability. Therefore, the reliability analysis of the LGREM can be simplified to the product of the reliabilities of the REA and the FS.
The stress and strain responses of the REA and the FS obtained from FE transient analysis are discrete data, with input variables including material density, gravitational acceleration, and overload coefficient [24]. It is difficult to directly establish an explicit functional relationship between these input variables and output responses. Response surface method effectively bypasses intricate internal mechanical coupling mechanisms by constructing approximate mathematical models that fit the discrete input-output mappings, making it a highly efficient approach for solving such problems. In this study, a full quadratic polynomial RSF [25] is employed to fit the input-output relationship of the LGREM, expressed as follows:
where , are the basic variables, and , , , are undetermined coefficients. The LGREM is a series structure, whose reliability is obtained by multiplying the reliabilities of the REA and the FS. The RSF for the stress and strain responses of the REA, constructed based on three input variables – material density, gravitational acceleration, and overload coefficient – is shown in Eq. (5):
where, , , , ; , , , are undetermined coefficients, with the number of each being , where is the number of random input variables, and in this paper is set to 3. The random parameters and are independent and normally distributed. The RSF for the stress and strain responses of the FS are constructed based on three input variables: material density, gravitational acceleration, and overload coefficient, as shown in the following Eq. (6):
where, , , , ; , , , are undetermined coefficients, with counts of respectively; the random parameters and are independent and normally distributed.
Most current studies decompose the mechanism reliability problem into individual structural reliability calculations, assuming that parameters of each part are independent events and neglecting the coupled interactions among them. For example, the basic variables of the REA and of the FS are treated as independent and sampled separately. In reality, the parts of the LGREM work together to achieve overall motion and functional output under identical operating conditions, resulting in strong parameter coupling. Therefore, when conducting reliability analysis of such mechanisms, it is essential to fully consider the parameter coupling effects among parts to improve the accuracy and authenticity of reliability assessment. The input variables of the REA and the FS – overload coefficient, material density, and gravitational acceleration – are fully correlated. Through correlation analysis, the number of basic variables of the LGREM was reduced from six to three, more accurately reflecting the characteristics of the mechanism. The RSF for the REA and the FS can be simplified into the following matrix form, shown in Eq. (7):
where, is RSF for the REA stress; is RSF for the REA strain; is RSF for the FS stress; is RSF for the FS strain. are undetermined coefficients. , , represent overload coefficient, material density, and gravitational acceleration respectively. The reliability model of the LGREM is described using four RSFs, such as , , and . each containing 10 undetermined coefficients. Therefore, at least 10 experiment points are required to fully determine all undetermined coefficients. How best to position the experimental points is a critical consideration in the response surface method. According to the sampling principle proposed by Rajashekhar [25], the initial sampling center point is set at the mean of each random variable, while other experiment points are distributed along each axis with coordinates , where is the variance of each variable and is an arbitrary factor, typically taken as 3. Since a quadratic polynomial including cross terms is used, three additional experiment points are placed along the positive directions of the three axes. A schematic diagram of the 10 sampling points is shown in the Fig. 4.
This paper simultaneously considers the effects of five random variables – density of 300M steel material, gravitational acceleration, overload coefficient, yield stress, and yield strain dispersion – on reliability. The distribution types, means, and variances of these variables are shown in Table 3. Based on measured data from the Chinese Society of Metals [26], the mean density of 300M steel is 7870 kg/m3, with a standard deviation below 0.3 %, which is taken as 0.3 % in this study. According to global surface measurement statistics [27], the mean gravitational acceleration is 9.806 m/s2, with a standard deviation not exceeding 0.3 %, which is also adopted as 0.3 %. According to aircraft maintenance manual data, the overload coefficient during landing typically ranges from 1.2 to 1.6; in this study, it is set at 1.5 with a standard deviation of 2 %. Based on material test data [28], the mean yield stress of 7075-T6 aluminum alloy is 503 MPa, and the yield strain is 7.085×10⁻³, with a standard deviation not exceeding 3 %, which is taken as 3 % in this paper.
Fig. 4Schematic diagram of sampling point distribution
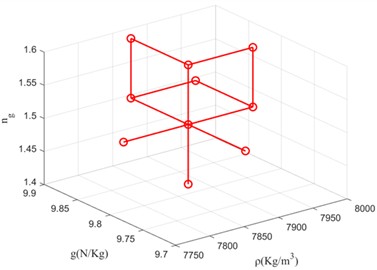
Table 3Variables distributions
Name | Parameters (Units) | Distribution type | Average | Standard deviation |
Operational overload | Normal | 1.5 | 0.03 | |
Material density | (Kg/m3) | Normal | 7.87×10³ | 31.4 |
Gravitational acceleration | (N/Kg) | Normal | 9.806 | 0.029 |
Yield stress | (MPa) | Normal | 503 | 15.09 |
Yield strain | (10-3 m) | Normal | 7.085 | 0.234 |
Fig. 5Maximum stress and strain trend of the LGREM
a) Maximum stress trend
b) Maximum strain trend
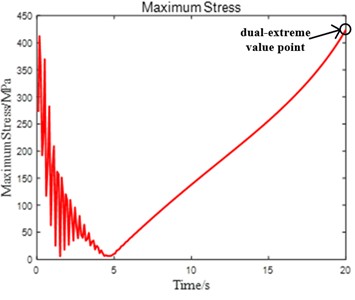
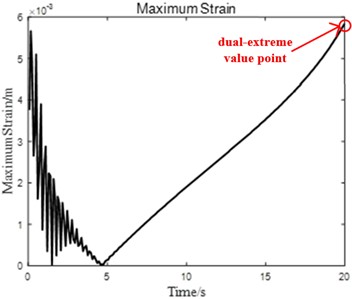
By inputting the above 10 experiment points into the transient analysis model in ANSYS Workbench, stress and strain values of each part in the LGREM at different time can be obtained. Fig. 5 shows the curves of maximum stress and maximum strain of the LGREM varying with time. As the LGREM retracts, the stress initially decreases from a relatively high fluctuation to a minimum, then gradually rises to its maximum value. The stress reaches its minimum when the damper leg is nearly parallel to the REA, at which point the resistance arm is smallest.
To improve the accuracy and efficiency of the response surface method, it is necessary to precisely fit the original failure plane in regions most likely to fail. The dual extreme value in both time and space domains, shown in Fig. 5, represent the most probable failure zones. In this paper, the dual stress and strain extreme value from the 10 experiment points are used as output responses, while the material density, gravitational acceleration, and overload coefficient at these 10 experiment points serve as input variables. Use MATLAB programming to solve Eq. (7) for the coefficients of RSF, shown in Table 4.
Table 4Coefficients of response surface function
Coefficients for terms | Constant term | Term | Term | Term | Term |
3.103×10⁸ | –3.850×10⁴ | 3.794×10⁶ | –3.997×10⁸ | 2.863×10⁻² | |
6.285×10⁻³ | –7.353×10⁻⁷ | –7.652×10⁻⁵ | –8.279×10⁻³ | 3.671×10⁻¹⁴ | |
3.396×10⁸ | –4.721×10⁴ | 7.325×10⁶ | –4.295×10⁸ | 3.083×10⁻² | |
6.021×10⁻³ | –6.920×10⁻⁷ | –3.607×10⁻⁵ | –8.065×10⁻³ | 3.465×10⁻¹⁴ | |
Coefficients for terms | Term | Term | Term | Term | Term |
2.439×10⁵ | 1.373×10⁸ | 260.830 | 5.278×10⁴ | 8.323×10⁴ | |
–3.640×10⁻⁸ | 2.826×10⁻³ | –2.936×10⁻⁹ | 1.047×10⁻⁶ | 1.115×10⁻⁶ | |
2.261×10⁵ | 1.475×10⁸ | 269.48 | 5.313×10⁴ | 8.942×10⁴ | |
–3.435×10⁻⁸ | 2.667×10⁻³ | –2.772×10⁻⁹ | 9.886×10⁻⁷ | 1.052×10⁻⁶ |
3. Results
Using the Monte Carlo method, 1,000,000 samples were drawn for material density, gravitational acceleration, overload coefficient, yield stress, and yield strain according to their respective distributions shown in Table 3. For each sample set of density, gravitational acceleration, and overload coefficient, the predicted output stresses and strains calculated by the Eq. (7) were then compared individually with the material’s yield stress and yield strain. If the predicted stress or strain exceeded the corresponding material yield value, one failure was recorded for the part; otherwise, the part was considered to operate reliably. The failure probability was obtained through 1,000,000 comparative analyses.
3.1. Reliability analysis
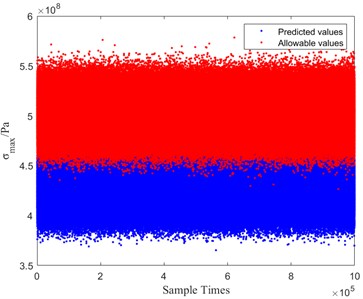
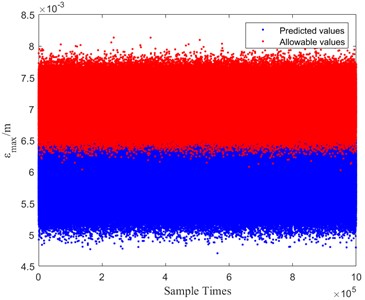
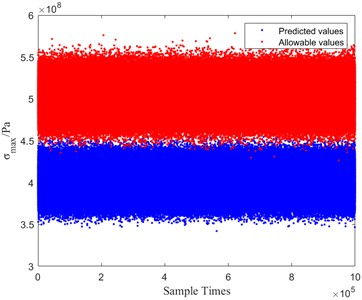
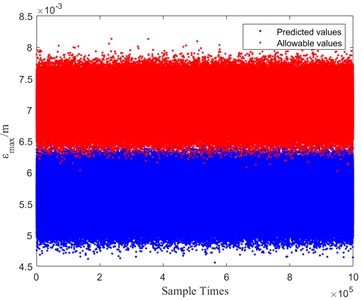
The simulation results of the REA stress and strain are shown in Fig. 6, and those of the FS stress and strain are shown in Fig. 7. Where represents the maximum strain value of the REA and the FS, and represents the maximum stress value of the REA and the FS, indicated by blue dots in the Figs.6-7. The yield stress of the REA and the FS is 503 MPa, which is the maximum allowable stress value. If the predicted stress exceeds the corresponding yield stress, it will cause plastic deformation or even fracture failure of the parts. The yield strain is 7.085×10⁻³ m, which is the maximum allowable strain value of the REA and the FS. If the predicted strain exceeds the corresponding yield strain, it will cause the mechanism to lose its functionality and result in motion failure of the mechanism. Yield stress and yield strain are indicated by red dots in the Figs. 6-7.
The frequency distribution histograms of the REA stress and strain are shown in Fig. 8, and those of the FS stress and strain are shown in Fig. 9. It can be seen from Figs. 8-9 that the frequency distributions of stress and strain of the REA and the FS all are approximately normal. It does not conform to a strict normal distribution, as stress and strain have clear boundaries at both ends and cannot extend to positive and negative infinity, violating the domain characteristics of a normal distribution. From Figs. 8-9, the failure probability and reliability of the REA and FS under the specified conditions can be obtained, as shown in Table 5. Under the allowable stress = 503 MPa, the failure probability of the REA is 0.0039 %, and that of the FS is 0.0001 %. Under the allowable strain = 7.085×10⁻³ m, the failure probability of the REA is 0.0112 %, and that of the FS is 0.0004 %. Since the stress and strain responses are independent of each other, the failure of either the stress or the strain of any part is considered a failure. Therefore, the failure probability of the LGREM is 0.0156 %, which means the reliability of the LGREM is 99.9844 %. Through calculation, it is found that the LGREM reliability meets the reliability requirements of 99.97 % for civil aviation airworthiness certification.
Fig. 6Stress and strain simulation for the REA
a) Stress simulation
b) Strain simulation
Fig. 7Stress and strain simulation for the FS
a) Stress simulation
b) Strain simulation
3.2. Comparison of reliability models
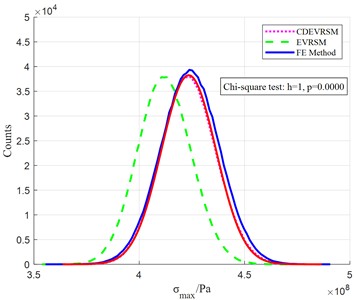
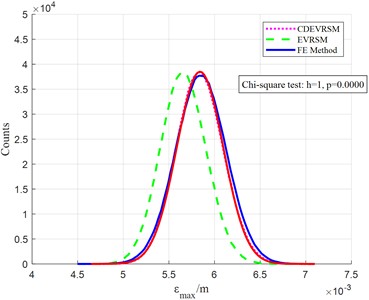
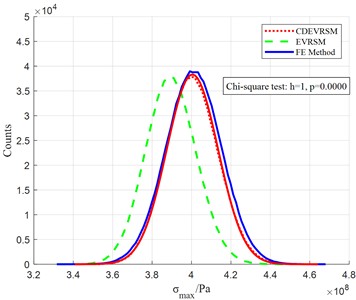
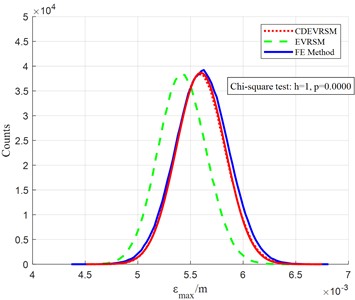
To verify the accuracy and efficiency of the CDEVRSM, the RSF of extreme value response surface method (EVRSM) was constructed using the stress and strain responses of the LGREM at the initial moment. The MC method was used to conduct a large-scale sampling of 1,000,000 times for the three input variables of material density, gravitational acceleration, and overload coefficient. The frequency distribution of the stress and strain of the REA was obtained through calculation and is shown in Fig. 8, and the frequency distribution of the FS stress and strain is shown in Fig. 9.
Typically, reliability calculations use FE simulation results as a reference for accuracy. Stress and strain data for the REA and FS were obtained from 1,000 FE simulations. Assuming that the stress and strain values follow a normal distribution, the mean of stress and strain for the REA and FS were calculated to be 4.305×10⁸ MPa, 5.963×10⁻³ m, 4.073×10⁸ MPa, 5.713×10⁻³ m, respectively, with standard deviations of 1.090×10⁷ MPa, 2.317×10⁻⁴ m, 1.098×10⁷ MPa, 2.097×10⁻⁴ m, respectively. Using Monte Carlo methods, 1000000 large-scale samples were generated, resulting in frequency distributions of stress and strain for the REA and the FS, shown in Figs. 8-9.
Fig. 8Frequency distribution comparison for REA stress and strain
a) Stress comparison
b) Strain comparison
Fig. 9Frequency distribution comparison for the FS stress and strain
a) Stress comparison
b) Strain comparison
Table 5Comparison of method results
Method | FE method | EVRSM | CDEVRSM |
REA stress failure | 57 | 3 | 39 |
REA strain failure | 174 | 9 | 112 |
FS stress failure | 0 | 0 | 1 |
FS strain failure | 4 | 0 | 4 |
Failure probability | 0.0235 % | 0.0012 % | 0.0156 % |
Reliability | 99.9765 % | 99.9988 % | 99.9844 % |
Efficiency | ≈ 1000 h | ≈ 10 h | ≈ 10 h |
To provide a more intuitive comparison of the accuracy and computational efficiency among the FE method, the EVRSM, and the CDEVRSM, the statistical results and computational efficiencies of these three methods are summarized in Table 5. In terms of accuracy, the CDEVRSM predicted 156 failures, while the EVRSM predicted only 12 failures. Compared to the 235 failures predicted by the FE method, the CDEVRSM reduced the relative error by approximately 61 % compared with the EVRSM. In terms of computational efficiency, both the CDEVRSM and the EVRSM required approximately 10 hours, whereas the FE method required approximately 1000 hours, with each simulation taking about one hour. Overall, the CDEVRSM significantly enhances computational efficiency compared to the FE method and reduces the relative error by approximately 61 % compared with the EVRSM.
3.3. Correlation analysis
To better illustrate the influence of input variables on output variables, the correlation coefficients are used for evaluation, as shown in Figs. 10-11. It can be observed that the primary to secondary factors influencing on the stress and strain of the REA and the FS are overload coefficient, density, and gravitational acceleration, respectively. The corresponding correlation coefficients are approximately 0.99, 0.1, and 0.02. The overload coefficient, density, and gravitational acceleration affect the LGREA by influencing the inertial force. According to the inertial force Eq. (1), fluctuations in the overload coefficient vary around the gravitational force of the rotating parts, with a standard deviation of 2 %. When the overload coefficient changes, the magnitude of the inertial force varies significantly, thereby substantially affecting the stress and strain of the LGREM. Density considers only the variation of 300M steel parts, while other parts are not included; its standard deviation is 0.3 %, resulting in relatively weak impact on the inertial force. Gravitational acceleration has a standard deviation of 0.3 % and, compared to density, its value is relatively small, making its effect nearly negligible.
Fig. 10Correlation coefficients of the REA output variable to the input variable
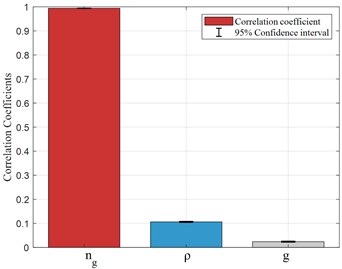
a) Stress correlation coefficients
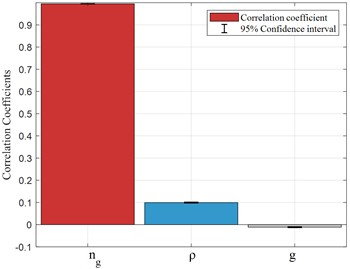
b) Strain correlation coefficients
Fig. 11Correlation coefficients of the FS output variable to the input variable
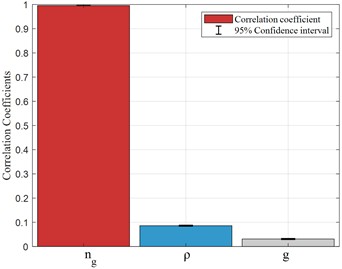
a) Stress correlation coefficients
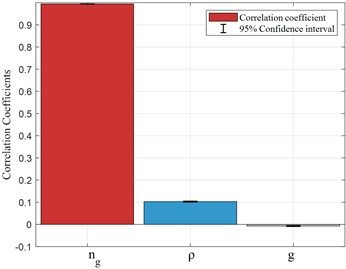
b) Strain correlation coefficients
4. Conclusions
The LGREM exhibits strong nonlinearity, with complex coupling interactions among its parts. Using multi-rigid-body kinematics and dynamics to calculate stresses and strains of individual parts would be highly challenging. This paper employs a FE transient analysis module to obtain simulation results for stress and strain in each part of the LGREM. By analyzing these FE simulation results, the reliability of the LGREM is simplified as the product of the reliabilities of the REA and the FS, significantly reducing computational complexity and improving efficiency.
An CDEVRSM is proposed in this study, constructing response surface method for the REA and the FS based on dual extreme value in both time and space domains for each part. Considering the parameter coupling effects, the Monte Carlo algorithm performs 1000000 sampling iterations to statistically determine the reliability of the LGREM at 99.9844 %. Compared to traditional extreme response surface methods, the relative error was reduced by approximately 61 %. While computation time is reduced from approximately 1000 hours using FE methods to approximately 10 hours, greatly enhancing computational efficiency. This is because the dual extreme value in both time and space domains represents the most likely failure region. The original failure plane in most likely failure region was precisely fitting by using the dual extreme value. Also, the coupling effects among parts are fully considered, more accurately reflecting the coordinated motion of the mechanism. Meanwhile, the CDEVRSM is determined by 10 key experimental points, so it is highly sensitive to the selected experimental points. If there are numerical fluctuations or noise in the experimental points, the CDEVRSM will be disturbed, resulting in inaccurate reliability prediction results.
By analyzing the correlation coefficients between input and output variables, the sensitivity of overload coefficient, material density, and gravitational acceleration on the reliability of the LGREM is evaluated. Results indicate that the primary factors affecting the reliability of the REA and the FS are, in order of importance: overload coefficient, material density, and gravitational acceleration. It shows that the effect of gravitational acceleration on reliability can essentially be neglected. The overload coefficient is the main factor affecting the reliability of the LGREM. In scientific research and engineering applications, to improve the reliability of LGREM, the standard deviation of the overload coefficient should be strictly controlled.
Future research could consider additional factors on the reliability of the LGREM, identify key critical factors through correlation analysis, and build reliability models based on these critical factors. Furthermore, the reliability of the LGREM includes motion accuracy, strength, fatigue, and fatigue reliability. This paper focuses only on strength reliability; future work can comprehensively integrate multiple failure models to fully assess the overall reliability of the LGREM.
References
-
Y. Chen, J. Gu, and Z. Han, “Time series ARIMA model for failure prediction of landing gear retraction/extension system,” (in Chinese), in 2019 International Conference on Aviation Safety and Information Technology, pp. 125–131, 2019.
-
H. Li and T. Li, “Reliability analysis of landing gear motion mechanism considering imprecise probability,” (in Chinese), Chinese Quarterly of Mechanics, Vol. 45, No. 4, pp. 920–930, 2024, https://doi.org/10.15959/j.cnki.0254-0053.2024.04.004
-
C. G. Bucher and U. Bourgund, “A fast and efficient response surface approach for structural reliability problems,” Structural Safety, Vol. 7, No. 1, pp. 57–66, Mar. 2003, https://doi.org/10.1016/0167-4730(90)90012-e
-
S.-H. Kim and S.-W. Na, “Response surface method using vector projected sampling points,” Structural Safety, Vol. 19, No. 1, pp. 3–19, Jul. 2002, https://doi.org/10.1016/s0167-4730(96)00037-9
-
X. S. Nguyen, A. Sellier, F. Duprat, and G. Pons, “Adaptive response surface method based on a double weighted regression technique,” Probabilistic Engineering Mechanics, Vol. 24, No. 2, pp. 135–143, Apr. 2008, https://doi.org/10.1016/j.probengmech.2008.04.001
-
N. Roussouly, F. Petitjean, and M. Salaun, “A new adaptive response surface method for reliability analysis,” Probabilistic Engineering Mechanics, Vol. 32, pp. 103–115, Oct. 2012, https://doi.org/10.1016/j.probengmech.2012.10.001
-
C.-Y. Zhang and G.-C. Bai, “Extremum response surface method of reliability analysis on two-link flexible robot manipulator,” (in Chinese), Journal of Central South University, Vol. 19, No. 1, pp. 101–107, Jan. 2012, https://doi.org/10.1007/s11771-012-0978-5
-
J. B. Cardoso, J. R. de Almeida, J. M. Dias, and P. G. Coelho, “Structural reliability analysis using Monte Carlo simulation and neural networks,” Advances in Engineering Software, Vol. 39, No. 6, pp. 505–513, May 2007, https://doi.org/10.1016/j.advengsoft.2007.03.015
-
A. Naess, B. J. Leira, and O. Batsevych, “System reliability analysis by enhanced Monte Carlo simulation,” Structural Safety, Vol. 31, No. 5, pp. 349–355, Apr. 2009, https://doi.org/10.1016/j.strusafe.2009.02.004
-
L. J. M. Aslett, T. Nagapetyan, and S. J. Vollmer, “Multilevel Monte Carlo for reliability theory,” Reliability Engineering and System Safety, Vol. 165, pp. 188–196, 2017, https://doi.org/10.1016/j.ress.2017.03.003
-
W. Bamrungsetthapong and A. Pongpullponsak, “System reliability for non-repairable multi-state series-parallel system using fuzzy Bayesian inference based on prior interval probabilities,” International Journal of General Systems, Vol. 44, No. 4, pp. 442–456, 2015, https://doi.org/10.1080/03081079.2014.976215
-
L.-K. Song, G.-C. Bai, and C.-W. Fei, “Multi-failure probabilistic design for turbine bladed disks using neural network regression with distributed collaborative strategy,” (in Chinese), Aerospace Science and Technology, Vol. 92, pp. 464–477, Jun. 2019, https://doi.org/10.1016/j.ast.2019.06.026
-
Y. Ren and G. Bai, “New neural network response surface methods for reliability analysis,” (in Chinese), Chinese Journal of Aeronautics, Vol. 24, No. 1, pp. 25–31, Mar. 2011, https://doi.org/10.1016/s1000-9361(11)60004-6
-
B. Zhu, H. Pei, and Q. Yang, “An intelligent response surface method for analyzing slope reliability based on Gaussian process regression,” (in Chinese), International Journal for Numerical and Analytical Methods in Geomechanics, Vol. 43, No. 15, pp. 2431–2448, Oct. 2019, https://doi.org/10.1002/nag.2988
-
Q.-C. Chang and C.-J. Xue, “Reliability analysis and experimental verification of landing-gear steering mechanism considering environmental temperature,” (in Chinese), Journal of Aircraft, Vol. 55, No. 3, pp. 1154–1164, Oct. 2017, https://doi.org/10.2514/1.c034577
-
H. Wang, C. Xue, and W. Jiang, “Fuzzy fatigue reliability analysis for a landing gear structure,” (in Chinese), in 2010 Third International Joint Conference on Computational Science and Optimization, pp. 112–115, 2010, https://doi.org/10.1109/cso.2010.130
-
X. Yang, Y. Liu, and Y. He, “Functional reliability and parameter sensitivity analysis for retraction-extension system of landing gear,” (in Chinese), Aeronautical Manufacturing Technology, Vol. 447, No. 3, pp. 78–81, 2014.
-
Y. Yin, N. Hong, N. Huajin, and Z. Ming, “Reliability analysis of landing gear retraction system influenced by multifactors,” (in Chinese), Journal of Aircraft, Vol. 53, No. 3, pp. 713–724, Mar. 2016, https://doi.org/10.2514/1.c033333
-
C. Zhou, M. Ji, Y. Zhang, F. Liu, and H. Zhao, “Mechanism reliability and sensitivity analysis of landing gear under multiple failure modes,” (in Chinese), Xibei Gongye Daxue Xuebao/Journal of Northwestern Polytechnical University, Vol. 39, No. 1, pp. 46–54, 2021, https://doi.org/10.1051/jnwpu/20213910046
-
X. Xu, N. Wang, and Y. Yin, “Analysis of motion accuracy reliability for landing gear retracting mechanism considering clearances,” (in Chinese), Journal of Nanjing University of Aeronautics and Astronautics, Vol. 56, No. 5, pp. 909–921, 2024.
-
S. Gao, S. Fan, S. Fan, W. Lan, and W. Wang, “Dynamic precision reliability of the aircraft landing gear retraction mechanism under coupled extreme working conditions,” (in Chinese), Nonlinear Dynamics, Vol. 113, No. 7, pp. 6075–6094, Oct. 2024, https://doi.org/10.1007/s11071-024-10442-z
-
Y. Lv, X. Chen, Y. Li, Y. Tian, and F. Zhang, “Reliability evaluation of landing gear retraction/extension accuracy based on Bayesian theory,” (in Chinese), Aerospace, Vol. 12, No. 4, p. 300, Apr. 2025, https://doi.org/10.3390/aerospace12040300
-
R. Fan, “Dynamic analysis and test method research on main landing gear retraction/extension of a civil aircraft,” (in Chinese), Mechanical Science and Technology, Vol. 32, No. 7, pp. 991–995, 2013.
-
C. Zhang, C. Lu, C. Fei, W. Wei, G. Hao, and X. Sun, “Reliability analysis of aero engine blade based on extremum response surface method,” (in Chinese), Journal of Harbin University of Science and Technology, Vol. 20, No. 2, pp. 1–6, 2015, https://doi.org/10.15938/j.jhust.2015.02.001
-
M. R. Rajashekhar and B. R. Ellingwood, “A new look at the response surface approach for reliability analysis,” Structural Safety, Vol. 12, No. 3, pp. 205–220, Mar. 2003, https://doi.org/10.1016/0167-4730(93)90003-j
-
S. Han, Y. Li, and C. Wang, “Development and application of high-quality ultra-high strength 300M steel for commercial large aircraft,” (in Chinese), China Metallurgy, Vol. 34, No. 7, pp. 52–59, 2024.
-
A. Torri, T. Foken, and J. Bange, Springer handbook of atmospheric measurements. Cham: Springer International Publishing, 2021, https://doi.org/10.1007/978-3-030-52171-4
-
M. Benedetti, C. Menapace, and V. Fontanari, “On the variability in static and cyclic mechanical properties of extruded 7075-T6 aluminum alloy,” Fatigue and Fracture of Engineering Materials and Structures, Vol. 44, No. 11, pp. 2975–2989, 2021, https://doi.org/10.1111/ffe.13530
About this article

This work was partially supported by the Guangdong Province Key Construction Discipline Research Ability Enhancement Project (Grant Number: 2022ZDJS149), and the Research Project of the Guangdong University of Science and Technology (Grant Number: GKY-2023KYYBK-31).
The datasets generated during and/or analyzed during the current study are available from the corresponding author on reasonable request.
Yanhong Gong contributed to conceptualization, data curation, formal analysis, funding acquisition, investigation, methodology, software, validation, visualization, and writing-original draft preparation. Anton Louise De Ocampo contributed to project administration, resources, supervision, and writing-review and editing.
The authors declare that they have no conflict of interest.

