Abstract
Early detection of structural degradation in insulated gate bipolar transistor (IGBT) power electronic modules (PEMs) is important for improving the reliability of electric vehicles operating under dynamic road loading. This study presents a physics-informed, AI-assisted vibration-based diagnostic framework for PEM condition assessment under realistic excitation conditions. A three-dimensional finite element model was used to identify resonance-sensitive frequency regions, with the dominant dynamic amplification observed near 1345 Hz. Acceleration responses generated under ISO 8608 Class K road excitation were processed to extract time-domain and frequency-domain features, including root mean square (RMS), kurtosis, and band power around the dominant resonance. These features were then used to classify healthy, mildly degraded, and severely degraded solder interconnect conditions using supervised machine learning models, namely support vector machine (SVM), k-nearest neighbors (kNN), and Random Forest. Among the evaluated models, Random Forest achieved the highest classification accuracy of 98.1 %. The novelty of the study lies in treating the 1345 Hz structural resonance not only as a mechanical response characteristic but also as a diagnostic-sensitive frequency band for feature engineering and fault discrimination. The results demonstrate the feasibility of resonance-informed vibration diagnostics for simulation-based early-stage condition assessment of PEM structures and provide a foundation for future experimental validation and embedded monitoring applications.
Highlights
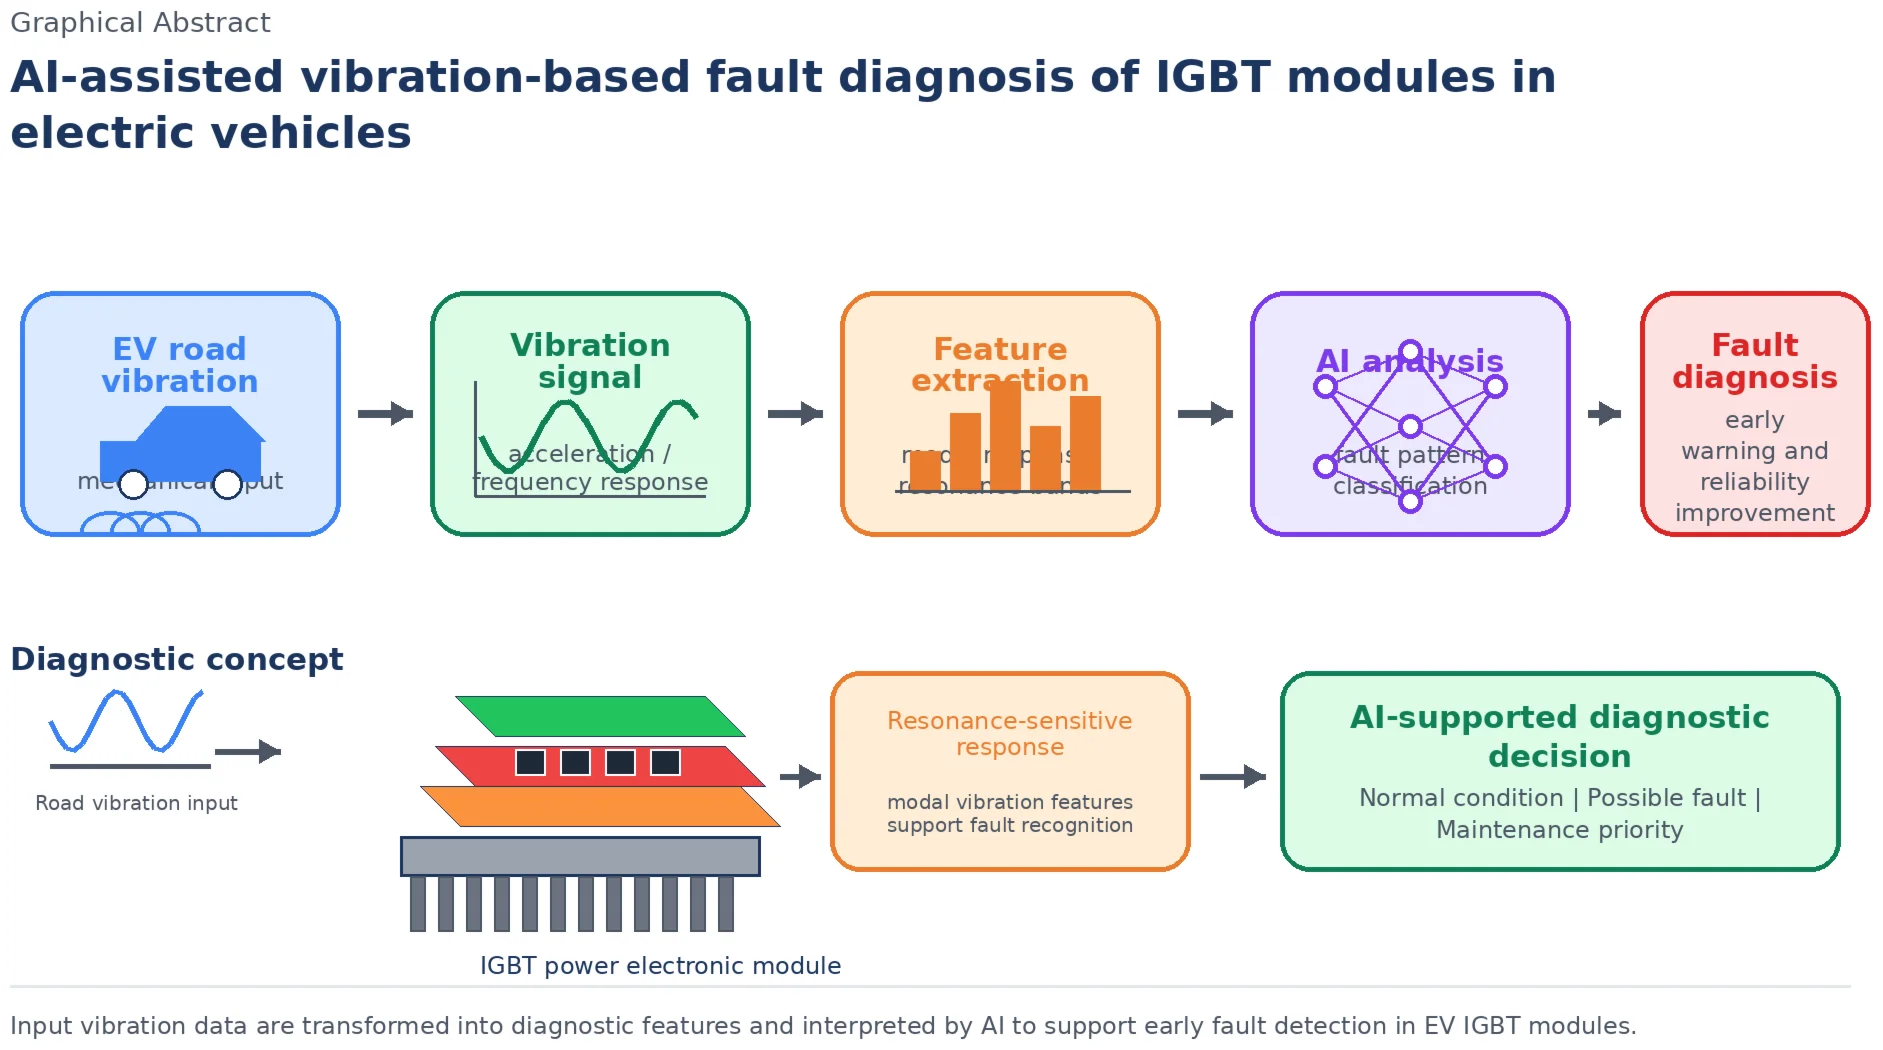
- The study proposes an AI-assisted vibration-based approach for fault diagnosis of IGBT modules in electric vehicles.
- Vibration signal analysis helps identify resonance-sensitive behavior and possible structural fault patterns in power electronic modules.
- The proposed diagnostic framework supports early fault detection and reliability improvement of IGBT modules in EV applications.
1. Introduction
Electric vehicles rely on insulated gate bipolar transistor (IGBT) power electronic modules for traction energy conversion. Under real driving conditions, these modules experience combined thermo-mechanical and vibration loading caused by road irregularities and drivetrain dynamics [2]. Although fatigue under thermal and power cycling has been widely studied, early detection of vibration-induced degradation remains insufficiently addressed [2], [3].
Structural resonance can amplify stresses in solder interconnects and busbar transitions, producing measurable dynamic signatures before failure. While vibration-based diagnostics are established in rotating machinery and structural monitoring, their application to packaged power electronic modules is limited [4], [5].
This study proposes an AI-assisted vibration-based diagnostic framework for IGBT modules under realistic road-induced excitation. The novelty of this study lies in the integration of finite element resonance analysis, vibration-based feature extraction, and supervised machine learning into a unified diagnostic framework for IGBT module condition assessment. In contrast to conventional studies that interpret resonance mainly as a structural risk, the present work treats the resonance band near 1345 Hz as a diagnostic-sensitive region that can be exploited for feature engineering and condition discrimination. The proposed approach therefore links physics-based structural modeling with data-driven fault classification and demonstrates the feasibility of simulation-based early degradation identification under realistic road-induced excitation.
2. Finite element modeling of PEM structure
To establish a physics-informed basis for vibration-based fault diagnosis, a three-dimensional finite element (FE) model of the IGBT power electronic module (PEM) was developed. The simplified structure consists of copper busbars, aluminum traces, an aluminum nitride (AIN) substrate, solder interconnect layers, a silicon chip, and an AlSiC baseplate (Fig. 1, Table 1). The selected layer configuration and nominal material properties are consistent with representative design and manufacturing data for power electronic modules reported in the literature [1]. Wirebonds and encapsulation materials were intentionally omitted to reduce damping effects and enhance structural sensitivity to dynamic excitation, thereby amplifying resonance-related vibration signatures relevant for diagnostic analysis. While these components contribute to the overall structural stiffness and damping of a real-world module, this study focuses on the fundamental resonance of the base structure; future iterations will include them to further refine the frequency response and improve model fidelity.
The FE model was discretized using three-dimensional solid elements. A refined mesh was applied in solder interconnect regions and geometric transition areas to accurately capture stress and displacement gradients, while coarser meshing was adopted in less critical regions to optimize computational efficiency. Mesh convergence studies were conducted to ensure stability of modal frequencies and displacement amplitudes.
Fig. 1Simplified PEM device structure without molding compound (encapsulation) used in the present study. The geometry was created by the authors for finite element modeling on the basis of the investigated module architecture and material stack
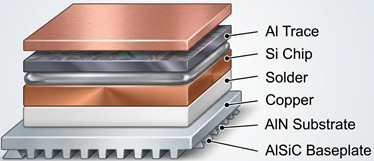
Table 1Material properties of the PEM structure (adapted for typical operating ranges)
Material | Density (kg/m3) | Young’s modulus (GPa) | Poisson’s ratio | Coefficient of thermal expansion (10⁻6 / °C) |
Aluminum Trace (Al) | 2700 | 70.6 | 0.345 | 24.5 |
Copper (Cu) | 8960 | 110 | 0.35 | 17 |
Substrate (AlN) | 3260 | 310 | 0.24 | 5.6 |
Solder (Sn3.5Ag) | 7360 | 54.05-0.193 × T(°C) | 0.4 | 21.85-0.0239 × T(°C) |
Silicon Chip (Si) | 2329 | 170 | 0.28 | 2.6 |
Baseplate (AlSiC) | 3000 | 200 | 0.3 | 11.8 |
Note: The material parameters listed in Table 1 were compiled from representative PEM design and reliability literature and adapted for the present simulation framework [1], [4-6] | ||||
2.1. Modal analysis and resonance identification
Eigenvalue-based modal analysis was performed to determine the intrinsic dynamic characteristics of the module under vertical base excitation. The first six natural frequencies are summarized in Table 2.
Although the dominant amplification at 1345 Hz is not the lowest frequency mode, forced response analysis revealed it to be the most significant. This study leverages this 1345 Hz resonance not as a structural vulnerability, but as a diagnostic-sensitive frequency band. The dynamic amplification observed near 1345 Hz provides a measurable vibration signature that can be exploited for feature extraction and fault discrimination in AI-based monitoring frameworks.
Table 2First six natural frequencies of the PEM structure
Mode number | Natural frequency (Hz) | Mode shape description |
1 | 308.8 | Complex bending/torsional mode |
2 | 322.5 | Complex bending/torsional mode |
3 | 406.3 | Complex bending/torsional mode |
4 | 974.64 | Complex coupled mode |
5 | 1230.7 | Complex coupled mode |
6 | 1345 | Complex coupled mode |
2.2. Vibration analysis under realistic excitation
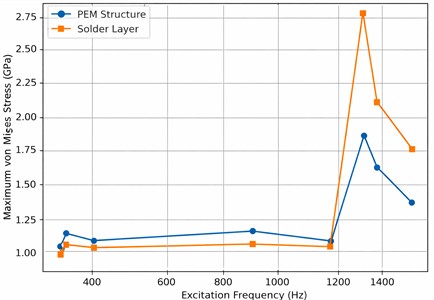
Frequency-domain response analysis was performed under vertical base excitation representative of vehicle-induced vibration [9]. The forced response revealed maximum displacement and stress amplification near 1345 Hz, particularly within solder interconnect layers and busbar curvature transitions (Figs. 3-4). Additional response peaks were observed at 1384 Hz and 1503 Hz, indicating other resonance-sensitive operating regions.
Fig. 2 presents the applied boundary conditions, including self-weight, base excitation location, and displacement constraints. Fig. 3 shows the vertical displacement of selected busbar nodes across the excitation frequency range, while Fig. 4 illustrates the corresponding maximum von Mises stress distribution in the PEM structure and solder layer.
Fig. 2Illustration of self-weight, base excitation location, and displacement constraints used in the finite element vibration analysis
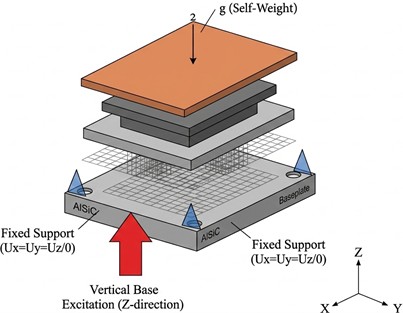
Fig. 3Vertical displacement of selected top busbar nodes over the excitation frequency range
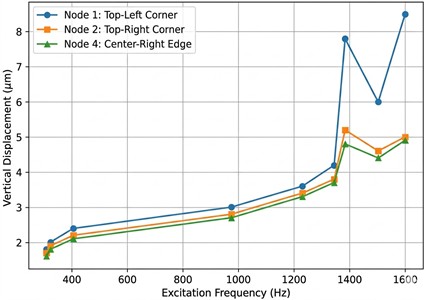
Fig. 4Maximum von Mises stress distribution in the PEM structure and solder layer over the excitation frequency range
The spatial localization of dynamic amplification near solder layers and geometric transitions confirms that these regions dominate the measurable vibration response. Rather than treating resonance solely as a structural vulnerability, the 1345 Hz band is adopted as a diagnostic-sensitive frequency region for subsequent signal processing and AI-based classification.
3. Vibration signal processing and feature extraction
3.1. Road-induced signal acquisition
Road-induced base excitation was generated using an ISO 8608 Class K stochastic profile [7] and converted into time-domain acceleration through a quarter-car suspension model. Structural responses were sampled at 10 kHz to ensure accurate capture of high-frequency resonance behavior near the diagnostic-sensitive band around 1345 Hz.
Signals were preprocessed using band-pass filtering (300-2000 Hz) to isolate structural modes and remove low-frequency vehicle-body motion. All samples were normalized prior to feature extraction.
3.2. Time-domain feature extraction
To characterize amplitude amplification and impulsiveness associated with structural degradation, selected statistical features were extracted from acceleration signals.
The following descriptors were extracted:
– Root Mean Square (RMS). The RMS value was used to quantify overall vibration energy:
where, represents instantaneous acceleration values. RMS exhibited clear sensitivity to stiffness reduction, increasing consistently with degradation severity.
– Kurtosis (). Kurtosis was employed to evaluate impulsive behavior associated with resonance am plification:
Higher kurtosis values were observed in degraded states due to localized dynamic amplification.
– Additional Statistical Descriptors. Peak-to-peak amplitude and crest factor were also computed to assess amplitude variability. However, sensitivity analysis indicated that RMS and kurtosis provided the most consistent separation between structural conditions. Skewness demonstrated limited discriminative capability and was therefore not included in the final feature selection set.
3.3. Frequency-domain feature extraction
Frequency-domain characteristics were obtained using Fast Fourier Transform (FFT) and power spectral density (PSD) estimation.
Given the dominance of the 1345 Hz resonance, band power within a ±50 Hz interval was selected as the primary spectral feature:
where = 1295 Hz and = 1395 Hz.
Band power showed the highest sensitivity to structural stiffness reduction, making it the most informative feature for AI-based classification.
4. AI-based fault classification
4.1. Dataset construction
To evaluate diagnostic feasibility, three structural conditions were modeled [5], [6]:
– Healthy module.
– Minor degradation (5 % reduction in solder stiffness).
– Severe degradation (15 % reduction in solder stiffness).
To simulate these conditions, the Young’s Modulus of the Sn3.5Ag solder layer was reduced by 5 % and 15 % in the FE model, respectively. For each condition, dynamic simulations were performed under identical excitation profiles. From each response, segmented vibration windows were extracted, resulting in a balanced dataset of 600 samples.
The dataset was divided into 70 % training and 30 % testing subsets. All features were standardized prior to classification to eliminate scale bias.
4.2. Machine learning models
Three supervised classifiers were evaluated to determine optimal diagnostic performance.
Table 3Model hyperparameter comparison
Model | Key hyperparameters |
SVM | Kernel: radial basis function (RBF); = 10, = 0.1 |
k-NN | Neighbors () = 5; Distance Metric: Euclidean |
Random forest | Number of trees = 100; Criterion: Gini impurity; Max depth: None |
Hyperparameters were tuned using cross-validation to ensure generalization stability.
To ensure reproducibility and optimal diagnostic performance, the hyperparameters for the supervised models were tuned using a grid search approach with 5-fold cross-validation. The finalized hyperparameter configurations are summarized in Table 3.
4.3. Diagnostic performance
Table 4 summarizes classification results.
Random Forest demonstrated the highest robustness under signal variability. Misclassifications primarily occurred between healthy and minor degradation states due to overlapping low-amplitude responses.
The results confirm that resonance-sensitive band power combined with RMS and kurtosis provides sufficient discriminative information for reliable condition identification. It should be noted, however, that the present diagnostic results are based on simulation-generated vibration data obtained from a simplified structural model and therefore should be interpreted as a proof-of-feasibility rather than a fully validated real-world monitoring solution.
Table 4Machine learning classification results
Model | Accuracy (%) | Sensitivity (%) | Specificity (%) |
SVM | 96.3 | 95.8 | 97.1 |
kNN | 94.8 | 93.5 | 95.2 |
Random forest | 98.1 | 97.9 | 98.5 |
5. Conclusions
This study presented a physics-informed, AI-assisted vibration-based diagnostic framework for condition assessment of IGBT power electronic modules subjected to dynamic road-induced excitation. A three-dimensional finite element model was developed to identify resonance-sensitive frequency bands, with the dominant dynamic response observed near 1345 Hz. Rather than treating this resonance solely as a structural vulnerability, the study demonstrated its usefulness as a diagnostic-sensitive band for feature extraction and condition discrimination.
Time-domain and frequency-domain features extracted from simulated acceleration responses, particularly RMS, kurtosis, and band power around the dominant resonance, provided meaningful separation among healthy, mildly degraded, and severely degraded solder interconnect states. Among the evaluated supervised learning methods, Random Forest achieved the highest classification accuracy of 98.1 %, indicating that relatively simple resonance-informed features can support highly effective classification performance in a simulation-based setting.
The main contribution of the study is the integration of structural dynamics, vibration signal analysis, and machine learning into a unified framework for early-stage degradation assessment of PEM structures in electric vehicles. The findings confirm the feasibility of using resonance-informed vibration signatures for fault discrimination under realistic road excitation modeled according to ISO 8608 Class K conditions.
At the same time, the present work remains limited by its simulation-based dataset, simplified structural representation, and absence of experimental validation. Therefore, the proposed method should be regarded as a proof-of-concept diagnostic framework and a foundation for future research rather than a fully validated field-deployable monitoring solution. Future work will focus on experimental vibration testing of real modules, extension of the structural model to include additional packaging components, and implementation of real-time embedded diagnostic strategies for practical EV applications.
References
-
W. W. Sheng and R. P. Colino, Power Electronic Modules: Design and Manufacture. Boca Raton, FL, USA: CRC Press, 2009, p. 296.
-
C. Durand, M. Klingler, D. Coutellier, and H. Naceur, “Power cycling reliability of power module: A survey,” IEEE Transactions on Device and Materials Reliability, Vol. 16, No. 1, pp. 80–97, 2016, https://doi.org/10.1109/tdmr.2016.2516044
-
J. Gu, D. Barker, and M. Pecht, “Prognostics implementation of electronics under vibration loading,” Microelectronics Reliability, Vol. 47, No. 12, pp. 1849–1856, 2007, https://doi.org/10.1016/j.microrel.2007.02.015
-
T. An et al., “Vibration lifetime estimation of PBGA solder joints using Steinberg model,” Microelectronics Reliability, Vol. 102, p. 113474, 2019, https://doi.org/10.1016/j.microrel.2019.113474
-
F. Liu, Y. Lu, Z. Wang, and Z. Zhang, “Numerical simulation and fatigue life estimation of BGA packages under random vibration loading,” Microelectronics Reliability, Vol. 55, No. 12, pp. 2777–2785, 2015, https://doi.org/10.1016/j.microrel.2015.08.006
-
T. An, C. Fang, F. Qin, H. Li, T. Tang, and P. Chen, “Failure study of Sn37Pb PBGA solder joints using temperature cycling, random vibration and combined temperature cycling and random vibration tests,” Microelectronics Reliability, Vol. 91, No. 2, pp. 213–226, 2018, https://doi.org/10.1016/j.microrel.2018.10.003
-
“Mechanical vibration-road surface profiles-reporting of measured data,” Organization for Standardization, Geneva, Switzerland, ISO 8608:1995, 1995.
-
M. N. Hossain, M. M. Rahman, and D. Ramasamy, “Artificial intelligence-driven vehicle fault diagnosis to revolutionize automotive maintenance: A review,” Computer Modeling in Engineering and Sciences, Vol. 141, No. 2, pp. 951–996, 2024, https://doi.org/10.32604/cmes.2024.056022
-
D. Ulgen, O. L. Ertugrul, and M. Y. Ozkan, “Measurement of ground borne vibrations for foundation design and vibration isolation of a high-precision instrument,” Measurement, Vol. 93, pp. 385–396, Nov. 2016, https://doi.org/10.1016/j.measurement.2016.07.041
About this article

The authors have not disclosed any funding.
The authors wish to thank the Ministry of Higher and Secondary Specialized Education of the Republic of Uzbekistan and Tashkent State Transport University for their support and provision of academic computing resources. We also acknowledge the valuable contributions of our colleagues in the Departments of Electrical Engineering and Mechanical Engineering for their insightful discussions and practical observations regarding vehicle dynamics in Uzbekistan.
The datasets generated during and/or analyzed during the current study are available from the corresponding author on reasonable request.
The authors declare that they have no conflict of interest.
