Abstract
This study investigates the techno-economic feasibility of utilizing hydrogen as a substitute for natural gas in an industrial gas turbine power plant, using the GE Frame 9E unit of the Ibom Power Station, Nigeria, as a case study. Engine performance simulations were conducted using GasTurb 11 software to evaluate key performance parameters under natural gas and hydrogen fueling conditions. A discounted cash flow-based economic model was developed to assess the financial viability of both fuel options over a 20-year plant lifecycle, employing indicators such as Net Present Value (NPV) and Internal Rate of Return (IRR). Results indicate that hydrogen operation yields a marginally higher thermal efficiency and lower heat rate compared to natural gas due to hydrogen’s higher heating value. However, economic analysis reveals that, despite performance improvements, hydrogen-fueled operation demonstrates not to be economically viable under current cost assumptions. The natural gas–fired engine achieved a NPV of approximately $99.5 million and an IRR of 17.4 %, whereas the hydrogen-fired engine produced a negative NPV of approximately –$358.1 million, largely driven by the high cost of hydrogen fuel. The findings demonstrate that while hydrogen offers environmental and performance benefits, significant reductions in hydrogen fuel costs or strong policy incentives are required before it can compete economically with natural gas for industrial gas turbine power generation.
Highlights
- The Net Present Value (NPV) for the natural gas fired engine is $99.5 million, whereas the hydrogen-fired engine resulted in a negative NPV of -$358.1 million, indicating economically not infeasible.
- The IRR for the natural gas-fired engine is 17.4 %. However, the IRR for the hydrogen-fired engine could not be determined due to the negative NPV, confirming its lack of economic viability.
- The study revealed that the engine fired with natural gas generated a higher heat rate of 11794.1kJ/kWh, compared to the hydrogen-fueled engine of 11447.2 kJ/kWh
1. Introduction
The Ibom Power Station is a gas-fired independent power plant located in Ikot Abasi, Akwa Ibom State, Nigeria. It is wholly owned by the Akwa Ibom State Government through the Ibom Power Company Limited (IPC). The plant was initially licensed to generate 191 megawatts (MW) of electricity and was commissioned in December 2009. It consists of three gas turbine units: two GE Frame 6B turbines and one GE Frame 9E turbine. The generated power is evacuated to the national grid through an outdoor 132 kV switchyard installed within the power station perimeter. The GE Frame 9E unit at the Ibom Power Plant operates on natural gas and, as a result, emits pollutants that pose significant environmental and public health concerns. To mitigate these impacts, hydrogen owing to its potential for clean combustion and improved engine performance has been proposed as an alternative to fossil fuels. However, despite these advantages, the application of hydrogen in gas turbines presents substantial technical and economic challenges.
Meziane and Bentebbiche [1] conducted a numerical study on the combustion performance of an engine fueled with a natural gas blended with hydrogen. The study revealed that the combustor outlet temperature increased with the percentage of hydrogen in the blended fuel. Another study [2] investigated the performance of pure hydrogen and syngas in a micro gas turbine integrated with a solar field. The authors reported that when the turbine was powered by pure hydrogen, little or no CO2 emissions were produced. In contrast, syngas combustion resulted in a significantly higher amount of CO2 emissions per kilowatt-hour. Furthermore, the study found that the engine fueled with pure hydrogen exhibited the best overall performance compared to other fuel types. Oberg et al. [3] reported that hydrogen-fueled gas turbines can only be competitive with other energy systems if strict regulations on CO2 emissions are enforced. The authors further noted that, under current conditions, hydrogen-fueled gas turbines are not economically viable due to the relatively high CO₂ emission permitted.
A study on exergetic performance of a turbojet engine using hydrogen fuel was conducted [4]. The results indicated that exergy efficiency decreased from 15.40 % to 14.33 % when the engine was fueled with hydrogen instead of jet fuel. The authors observed that the exergetic performance of the engine, particularly in the combustion chamber, was significantly affected when hydrogen was used. However, it was also reported that the hydrogen-fueled engine produced lower emissions compared to the jet fuel-powered engine.
Zhang et al. [5] investigated the effect of diluent gases on the turbulent premixed flame of a hydrogen/carbon monoxide/air mixture. Similarly, a micro gas turbine operating with different fuel compositions was studied [6]. Imteyaz et al. [7] found that both flashback and blowout limits shifted toward the leaner side of the combustor as the hydrogen volume increased. Juste [8] reported a significant reduction in CO2 emissions by injecting small quantities of hydrogen into the primary zone of the combustor. Kahraman et al. [9] conducted a numerical analysis comparing the performance of hydrogen and Jet-A fuels in a gas turbine combustor. The study showed that an engine fueled with hydrogen exhibited better performance in terms of pressure drop, combustion chamber outlet temperature, and lower CO₂ and unburned hydrocarbon emissions compared to Jet-A fuel.
Kim et al. [10] employed a swirl-stabilized combustor under confined conditions to study the effect of hydrogen addition in a methane air premixed flame. The findings from the study showed that lean stability improved with the addition of hydrogen. The study also reported that NOx emissions from a hydrogen-enriched methane premixed flame were lower compared to a diffusion flame scenario. An investigation into the use of hydrogen in heavy-duty gas turbine engines fired with natural gas was presented [11]. Liu et al. [12] reported that hydrogen-enriched fuel exhibited significant variations near leaner conditions. Giancarlo et al. [13] conducted an experimental study using a Dry Low NOx combustor in a gas turbine, where varying volumes of hydrogen mixed with natural gas were tested. The authors observed that increasing the hydrogen volume enhanced flame stability and reduced NOx emissions. Larfeldt et al. [14] explored the feasibility of using varying volumes of hydrogen in a dry low-emission combustor. In the study, one of the burners was fueled with hydrogen while the others utilized natural gas. The authors reported that the concept burner demonstrated the capability to operate with at least 45 % hydrogen by volume mixed with natural gas. Pashchenko [15] performed a thermodynamic assessment of a combined-cycle power plant using hydrogen-rich fuels produced through methane-hydrogen blending and steam methane reforming. The findings indicated that both approaches offer viable solutions for significantly lowering CO₂ emissions in existing power generation systems. Similarly, Oberg et al. [3] highlighted the potential of hydrogen-enriched natural gas to substantially reduce carbon emissions, presenting a practical route toward sustainable energy production. Complementing these findings, Sun et al. [16] reported that hydrogen addition improves combustion stability under lean operating conditions and enhances the overall combustion efficiency of methane-hydrogen mixtures.
From the foregoing, it is evident that most studies on hydrogen fuel focus on improving the combustion system of gas turbines to mitigate issues such as flashback and other challenges associated with hydrogen combustion. However, there is little to no research that comprehensively examines the economic feasibility of operating a hydrogen-fueled engine for power generation, particularly gas turbine power plants in operated in Niger Delta Region of Nigeria. This study presents the techno-economic assessment of hydrogen utilization as an alternative fuel to natural gas in industrial gas turbines for power generation: a case study of the Ibom power plant.
2. Materials and methods
2.1. Description of Ibom power station
The Ibom Power Station is a gas-fired independent power plant located in Ikot Abasi, Akwa Ibom State, Nigeria. Established as a public-private partnership, it is wholly owned by the Akwa Ibom State Government through the Ibom Power Company Limited (IPC). Initially licensed to generate 191 megawatts (MW) of electricity, the plant's capacity was expanded in November 2015 to 685 MW, incorporating both the original 191 MW Phase 1 and the proposed 500 MW Phase 2. Phase 1, commissioned in December 2009, consists of three gas turbine units (two GE Frame 6B turbines and one GE Frame 9E turbine).
Table 1Design point specification frame 9E Ibom power plant (Courtesy GE)
Parameter | Unit | Value |
Compressor inlet temperature | °C | 15 |
Compressor inlet relative humidity | % | 60 |
Atmospheric pressure | bar | 1.013 |
Fuel | – | Natural Gas |
Design performance | ||
Design output | kW | 126,1 |
Design heat rate (LHV) | kJ/kWh | 10,65 |
Design heat consumption (LHV) | MJ/h (×106 kJ/h) | 1,343 |
Design exhaust flow | ×103 kg/h | 1,505 |
Exhaust temperature | °C | 543 |
For the purpose of this study, only performance data obtained from the GE Frame 9E gas turbine were utilized. Table 1 presents the design point specification data for the Frame 9E Ibom Poower Plant. The GE Frame 9E operational data of the Ibom Power Plant, including total power generated and daily gas consumption from 1st to 30th November 2014, were obtained and analysed for the economic evaluation (see Table 2). The one month data obtained were extrapolated to an annual basis and used to conduct the economic feasibility study over the expected 20-year lifespan of the gas turbine power plant.
Table 2One month operational data for GE frame 9E Ibom power plant (Courtesy Ibom Plant Company)
Ibom power company – MWH generated for the month of November 2014 | ||||||
Date | Operational hour | Total MWH generated (MWH) | Daily gas volume (MSCF) | Gas consumption SCF/MWH | Daily energy (MMBTU) | Gas consumption MMBTU/MWH |
11/01/2014 | 19.43 | 2,185.12 | 21,910.00 | 10,027 | 23,596.00 | 10.80 |
11/02/2014 | 24.00 | 2,578.01 | 25,458.00 | 9,875 | 27,419.00 | 10.64 |
11/03/2014 | 24.00 | 2,552.48 | 25,266.00 | 9,899 | 27,211.00 | 10.66 |
11/04/2014 | 22.46 | 2,438.00 | 24,477.00 | 10,040 | 26,362.00 | 10.81 |
11/05/2014 | 21.52 | 1,192.34 | 15,018.00 | 12,595 | 16,174.00 | 13.56 |
11/06/2014 | 18.45 | 2,034.07 | 20,183.00 | 9,922 | 21,737.00 | 10.69 |
11/07/2014 | 24.00 | 2,577.71 | 25,434.00 | 9,867 | 27,393.00 | 10.63 |
11/08/2014 | 12.32 | 1,232.35 | 12,711.00 | 10,314 | 13,690.00 | 11.11 |
11/09/2014 | 23.26 | 2,492.88 | 24,810.00 | 9,952 | 26,720.00 | 10.72 |
11/10/2014 | 23.19 | 2,556.63 | 25,440.00 | 9,951 | 27,399.00 | 10.72 |
11/11/2014 | 22.44 | 2,111.39 | 22,099.00 | 10,467 | 23,800.00 | 11.27 |
11/12/2014 | 22.55 | 2,442.27 | 24,457.00 | 10,014 | 26,340.00 | 10.79 |
13/11/2014 | 24.00 | 2,101.02 | 21,688.00 | 10,323 | 23,359.00 | 11.12 |
14/11/2014 | 24.00 | 2,624.65 | 25,905.00 | 9,870 | 27,899.00 | 10.63 |
15/11/2014 | 22.29 | 2,039.95 | 21,230.00 | 10,407 | 22,865.00 | 11.21 |
16/11/2014 | 23.17 | 2,160.07 | 22,459.00 | 10,397 | 24,188.00 | 11.20 |
17/11/2014 | 24.00 | 2,407.12 | 24,235.00 | 10,068 | 26,101.00 | 10.84 |
18/11/2014 | 23.24 | 2,412.67 | 24,375.00 | 10,103 | 26,252.00 | 10.88 |
19/11/2014 | 23.15 | 2,230.17 | 22,809.00 | 10,227 | 24,565.00 | 11.01 |
20/11/2014 | 23.38 | 2,436.27 | 24,627.00 | 10,108 | 26,524.00 | 10.89 |
21/11/2014 | 20.28 | 2,144.56 | 22,504.00 | 10,494 | 24,237.00 | 11.30 |
22/11/2014 | 24.00 | 2,617.05 | 26,068.00 | 9,961 | 28,075.00 | 10.73 |
23/11/2014 | 24.00 | 2,576.75 | 25,769.00 | 10,001 | 27,753.00 | 10.77 |
24/11/2014 | 24.00 | 2,539.97 | 25,424.00 | 10,010 | 27,382.00 | 10.78 |
25/11/2014 | 24.00 | 2,270.74 | 23,264.00 | 10,245 | 25,055.00 | 11.03 |
26/11/2014 | 24.00 | 2,554.15 | 25,506.00 | 9,986 | 27,470.00 | 10.76 |
27/11/2014 | 6.42 | 525.00 | 8,336.00 | 15,878 | 8,978.00 | 17.10 |
28/11/2014 | 23.06 | 2,477.66 | 24,981.00 | 10,082 | 26,904.00 | 10.86 |
29/11/2014 | 24.00 | 2,556.51 | 25,845.00 | 10,109 | 27,836.00 | 10.89 |
30/11/2014 | 19.24 | 2,102.15 | 21,639.00 | 10,294 | 23,304.00 | 11.09 |
TOTAL | 657.85 | 67,169.71 | 683,927.00 | 10,383 | 736,588.00 | 11.18 |
To evaluate the performance of the GE Frame 9E engine at the IBOM Power Plant, which constitutes one of the units in Phase 1, GasTurb 11 simulation software was employed to model and simulate the turbine operated separately with natural gas and hydrogen. The modeling of the GE Frame 9E engine was carried out by adjusting component efficiencies, turbine inlet temperature, and other engine parameters until the desired performance indicators such as power output, thermal efficiency, fuel flow, exhaust gas temperature, and exhaust mass flow rate, comparable to those of the parent engine were obtained. The default natural gas and hydrogen fuel models embedded in the software were then used independently to simulate the operation of the GE Frame 9E engine under each fuel condition, enabling a comparative evaluation of its performance. It is worth noting that a power output of 102 MW was adopted for modeling the IBOM Power Plant GE Frame 9E engine. This value was selected based on the average power output derived from the available operational data, as shown in Table 2.
2.2. Economic analysis
An economic analysis module was developed using Microsoft Excel to evaluate the financial viability of operating the GE Frame 9E gas turbine at the Ibom Power Plant on natural gas and hydrogen separately. The module incorporated key inputs, including engine performance parameters such as power output and fuel consumption, capital investment costs, operation and maintenance expenses, discount rates, and electricity prices. A discounted cash flow (DCF) approach was employed to assess the long-term economic performance of the gas turbine under each fuel scenario.
For the economic evaluation, relevant data were obtained from the Ibom Power Plant Company and public sources. The Ibom Power Plant Company provided information on the electricity generation tariff, estimated at approximately $80/MWh, and the design power output capacity of 126 MW. Also, fixed operation and maintenance costs and direct expenses, estimated at 17% and 15 % of annual revenue respectively, were provided. Capital cost of $900/kW and a natural gas price of $2.4/MMBtu were sourced from publicly available literature.
To enable a consistent comparison between hydrogen and natural gas operation, engine performance simulations of the GE Frame 9E unit were conducted under a fixed load condition. The power output was set at 102.1 MW, corresponding to the average power generated as determined from the available operational data of the Frame 9E unit at the Ibom Power Plant.
The equations used in the economic analysis are presented [17], [18]:
– Initial Cash Flow.
Initial cash flow, :
where, – investment cash at hand, – investment grant, – loan, – the capital cost of power plant installation.
– Annual Net Cash Flow.
Net cash flow for Years (, 1 to ).
Annual operational savings, is obtained using Eq. (2):
where: – revenue for electricity sold to grid, – cost of fuel for the power plant, – annual loan repayment, – operation and maintenance cost (except fuel) for a generating plant.
– Net Present Value (NPV) calculations.
NPV is computed using Eq. (3):
where: represents the market discount (interest) rate in period, . When the discount rate is assumed to be constant over time, dt can considered be to be equal to . denotes the net cash flow in year , calculated as revenue plus savings minus expenses. The net cash flow may be negative, indicating a loss in year . – the present worth of the investment (at time = 0), and it is negative when it is equal to the capital cost. represents the period in time in which the power plant is assumed to be in operation. Time is usually presented in years. NPV – net present value.
The three Possible Conditions are [18]:
1) If the NPV ˃ 0; Return on Investment (RoI) ˃ , then the invest is economically viable under the given condition
2) Also, if NPV = 0; Return on Investment (RoI) = ; then the invest is economically viable under the given condition
3) Lastly, when NPV ˂ 0; Return on Investment (RoI) ˂ 0; then the investment is not economically viable under the given condition.
– Internal Rate of Return (IRR) Calculations:
where IRR is the internal rate of return.
– Loan Repayment.
Eq. (5) is used to calculate the equal annual loan repayment, :
where: represents interest rate; while and have already been defined above.
The calculations for key parameters in the economic analysis are presented below.
The power generated and the revenue obtained from electricity sales are calculated using equations, respectively:
– Power Generated (kWh) = GasTurbine Power Output × Time (hours).
– Revenue Generated from Electricity Sold=electricity tariff $/kWh × kWh of electricity generated.
While to determine the operation and maintenance costs of the power plant: Annual operation and maintenance cost = total annual energy generated (kWh) × O&M cost per kWh.
Formulas used to calculate the annual fuel cost of the power plant, the annual savings from electricity consumption, and the annual revenue from excess electricity sold to the grid, respectively: Annual GT fuel cost, Cf = total annual power generated (kWh)x price of natural gas per kWh. Annual revenue from excess electricity sold to grid, Re = Annual electricity generated (kWh) × electricity tariff to grid per kWh. Annual revenue from excess electricity sold to grid, Re = Annual electricity generated (kWh)x electricity tariff to grid per kWh.
2.3. Assumptions
The following assumptions were made while conducting the economic analysis of the power plant:
1) Construction period is assumed to be at year 0, during which the capital cost is incurred, while plant operation begins at the start of the first year ( 1).
2) The life cycle of the power plant is assumed to be 20 years (that is 20).
3) The discount rate () is assumed to be constant at 10 %.
4) The electricity tariffs escalation rate is at 5 %.
5) The fuel price escalation rate is assumed to be 5 % annually.
6) The operation and maintenance (O&M) cost escalation rate is assumed to be 3 % annually.
7) The interest rate on the loan was assumed to be 5 %.
8) The loan repayment period was set at 10 years.
9) A loan holiday of two years was assumed.
10) The annual operation and maintenance costs, including direct expenses, are assumed to be the same for both the engine fired separately with hydrogen and natural gas. These combined costs are taken as 32 % of the total.
11) The capital investment required for the engine operating on natural gas is assumed to be similar to the engine fired with hydrogen engine fired with hydrogen.
12) Both the engine fired with natural gas and the one operated on hydrogen are assumed to have operated for same period.
3. Results and discussion
3.1. Engine performance analysis
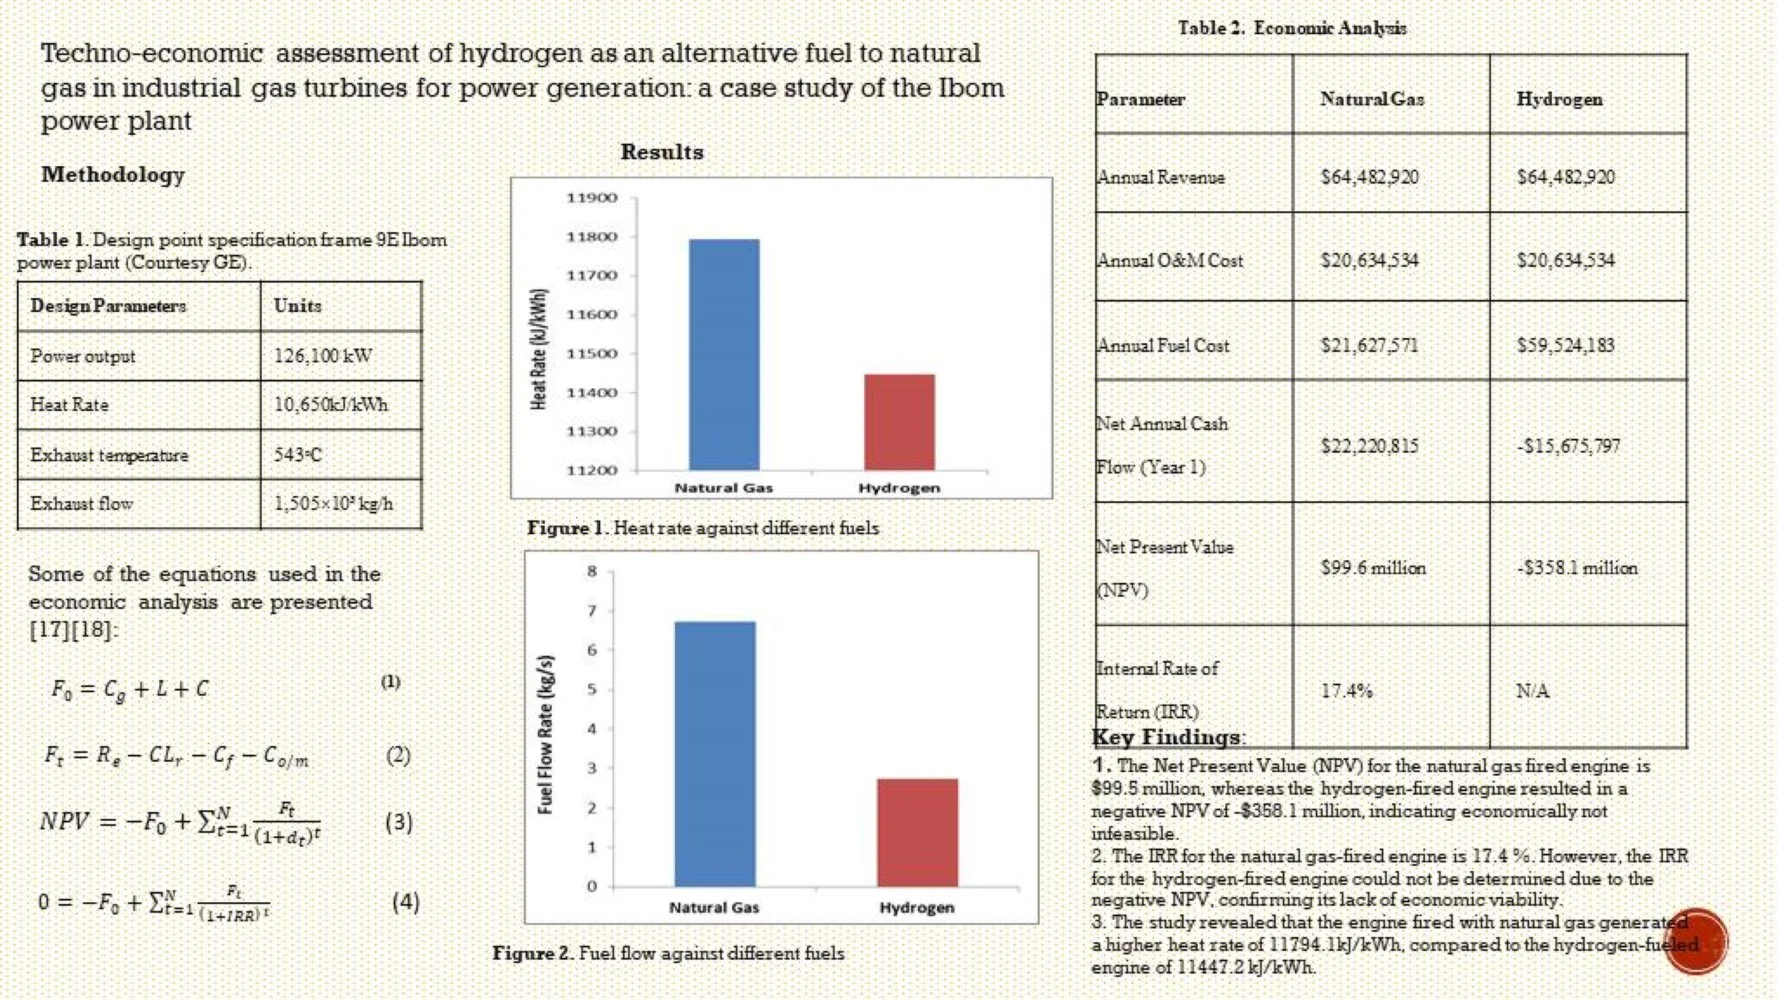
Fig. 1 presents a bar chart comparing the thermal efficiency of the engine operated with different fuels. As observed, the engine fired with hydrogen achieved a thermal efficiency of 31.4 %, compared to 30.5 % for the engine fueled with natural gas. The higher thermal efficiency of the hydrogen-fueled engine can be attributed to the higher specific energy content (fuel heating value) of hydrogen relative to natural gas. These findings align with the study by Razak [19], which compared the performance of an engine running on diesel and natural gas. Razak [19] reported that switching from diesel to natural gas increased thermal efficiency and power output by 1-2 %, attributing this improvement to the higher heating value of natural gas compared to diesel.
When comparing the heat rate of the engine operated with natural gas and hydrogen, the results indicate that the engine fired with natural gas generated a heat rate of 11794.1kJ/kWh, whereas the hydrogen-fueled engine produced a slightly lower heat rate of 11447.2 kJ/kWh (see Fig. 2). The lower heat rate of the hydrogen-fueled engine is due to its higher fuel heating value (FHV) compared to natural gas. This lower heat rate signifies higher work output for hydrogen for a given heat input.
Fig. 1Thermal efficiency against different fuel
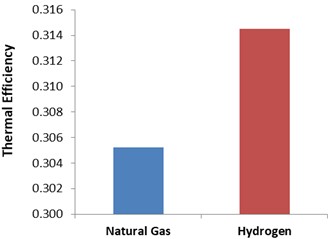
Fig. 2Heat rate against different fuels
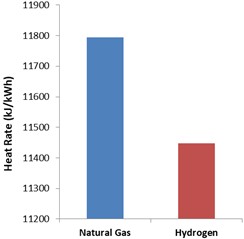
Fig. 3Power specific fuel consumption against different fuel
Fig. 4Fuel flow against different fuels
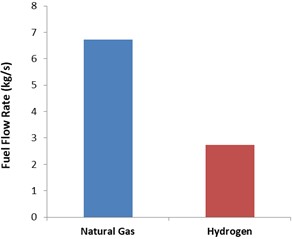
Figs. 3 and 4 present bar charts illustrating power specific fuel consumption and fuel flow, respectively. The results show that the fuel flow rate for the engine running on natural gas was 6.72 kg/s, whereas the engine operating on hydrogen produced a significantly lower fuel flow rate of 2.74 kg/s. As evident in the figures, the hydrogen-fueled engine exhibited lower power specific fuel consumption and fuel flow rates compared to the natural gas fueled engine. These findings are consistent with Razak’s [19] study, where switching from natural gas to diesel led to a significant increase in fuel consumption, attributed to the lower heating value (LHV) of diesel. Similarly, Najjar et al. [20] reported that hydrogen fuel demonstrated improved fuel savings compared to LPG.
3.2. Economic analysis
The economic viability of operating the GE Frame 9E gas turbine at the Ibom Power Plant operated separately on natural gas and hydrogen was evaluated using a discounted cash flow (DCF) approach over a 20-year plant lifecycle. Table 3 presents the key assumptions behind the economic analysis. Both fuel scenarios were evaluated under identical financial parameters to ensure a consistent comparison. A discount rate of 10 % was applied, reflecting typical market conditions for power generation investments in Nigeria. A loan interest rate of 5 % was assumed, with a 10-year repayment period following a 2-year loan holiday, allowing for initial operational stabilization before debt service commences. Tariff and fuel prices were escalated at 5 % annually, while operation and maintenance (O&M) costs escalated at 3 %, consistent with inflationary trends in the energy sector. The capital cost for the gas turbine was fixed at $900/kW, based on publicly available industry data.
Table 4 summarizes the operational parameters derived from the GasTurb 11 simulations and plant operational data. The installed capacity for capital cost calculation was 126 MW, while the average power output used for operational cash flow calculations was 102.1 MW, corresponding to the average output from the Ibom Power Plant operational data. Annual operating hours were determined as 7,894.2 hours based on the November 2014 operational data extrapolated annually. The annual energy generated was therefore 806,036.5 MWh for both fuel scenarios. The key operational distinction between the two scenarios lies in the heat rate and fuel price. The hydrogen-fired engine exhibited a marginally lower heat rate (10.86 MMBtu/MWh) compared to the natural gas-fired engine (11.18 MMBtu/MWh), attributable to hydrogen's higher heating value (see Table 3). However, the fuel price for green hydrogen $6.82/MMBtu [21] was substantially higher than that of natural gas ($2.4/MMBtu), a disparity that significantly influences the economic outcomes.
Table 3Summary of key assumptions for the economic analysis
Parameter | Natural Gas | Hydrogen |
Plant lifecycle () | 20 years | 20 years |
Discount rate () | 10 % | 10 % |
Loan Interest rate () | 5 % | 5 % |
Loan repayment period | 10 years | 10 years |
Loan holiday | 2 years | 2 years |
Tariff escalation rate | 5 % | 5 % |
O&M escalation rate | 3 % | 3 % |
Fuel escalation rate | 5 % | 5 % |
Gas turbine capital cost | $900/kW | $900/kW |
Table 4Summary of key frame 9E Ibom power plant operational data
Parameter | Natural Gas | Hydrogen |
Installed capacity (for capital cost) | 126 MW | 126 MW |
Average power output (for operation) | 102.1 MW | 102.1 MW |
Annual operating hours | 7,894.2 hrs | 7,894.2 hrs |
Annual energy generated | 806,036.5 MWh | 806,036.5 MWh |
Heat rate | 11.18 MMBtu/MWh | 10.86 MMBtu/MWh |
Fuel price | $2.4/MMBtu | $6.82/MMBtu |
Tables 5 and 6 present the detailed 20-year discounted cash flow analyses for the natural gas-fired and hydrogen-fired engines, respectively, incorporating the loan repayment of $16,191,668 for Years 3-12 following the 2-year loan holiday. For the natural gas-fired engine (Table 5), annual net cash flows remain positive throughout the project lifecycle. In Year 1, before loan repayments commence, the net cash flow is $22.22 million, derived from revenue of $64.48 million less O&M costs of $20.63 million and fuel costs of $21.63 million. During the repayment period (Years 3-12), net cash flows range from $9.17 million to $28.54 million, reflecting the impact of annual loan repayments. After the loan is fully repaid in Year 12, net cash flows increase substantially, reaching $72.11 million by Year 20. The cumulative present value of these cash flows, discounted at 10 %, is $213.0 million, which, after deducting the initial capital investment of $113.4 million, yields a Net Present Value (NPV) of $99.6 million.
In contrast, Table 6 reveals the challenging economic scenario for hydrogen-fired operation. Despite generating identical annual revenue to the natural gas scenario, the high cost of hydrogen fuel renders annual net cash flows negative throughout the entire 20-year period. In Year 1, the net cash flow is negative at –$15.68 million, driven by fuel costs of $59.52 million, which account for approximately 92% of revenue. During the loan repayment period (Years 3-12), net cash flows range from -$32.62 million to –$36.27 million, further exacerbated by the annual loan repayments. After loan repayment, net cash flows improve marginally but remain negative, ranging from –$20.51 million in Year 13 to –$23.65 million in Year 20. The cumulative present value of these negative cash flows is –$244.71 million, resulting in a final NPV of -$358.1 million after accounting for the initial capital investment.
Table 520-year discounted cash flow (DCF) analysis for gas turbine fired with natural gas
Year | Revenue on excess electricity sold to grid, +Re (5 %) escalation rate ($) | O & M Cost, (3%) | GT Fuel Cost, (5%) | Annual loan repayment ($) | Annual net cash flow ($) | Present value 10 % discount rate, ($) |
Escalation rate ($) | Escalation rate ($) | |||||
0 | – | – | – | – | –113,400,000 | –113,400,000 |
1 | 64,482,920 | 20,634,534 | 21,627,571 | 0 | 22,220,815 | 20,200,741 |
2 | 67,707,066 | 21,253,570 | 22,708,950 | 0 | 23,744,546 | 19,623,591 |
3 | 71,092,419 | 21,891,177 | 23,844,398 | 16,191,668 | 9,165,176 | 6,886,600 |
4 | 74,647,040 | 22,547,912 | 25,036,618 | 16,191,668 | 10,870,842 | 7,424,651 |
5 | 78,379,392 | 23,224,350 | 26,288,449 | 16,191,668 | 12,674,925 | 7,869,705 |
6 | 82,298,362 | 23,921,080 | 27,602,872 | 16,191,668 | 14,582,742 | 8,231,564 |
7 | 86,413,280 | 24,638,713 | 28,983,016 | 16,191,668 | 16,599,883 | 8,518,637 |
8 | 90,733,944 | 25,377,874 | 30,432,167 | 16,191,668 | 18,732,235 | 8,738,626 |
9 | 95,270,641 | 26,139,210 | 31,953,776 | 16,191,668 | 20,985,987 | 8,899,277 |
10 | 100,034,173 | 26,923,387 | 33,551,465 | 16,191,668 | 23,367,653 | 9,007,347 |
11 | 105,035,881 | 27,731,089 | 35,229,038 | 16,191,668 | 25,884,086 | 9,071,109 |
12 | 110,287,675 | 28,562,022 | 36,990,490 | 16,191,668 | 28,543,495 | 9,095,845 |
13 | 115,802,059 | 29,418,883 | 38,840,015 | 0 | 47,543,161 | 13,772,097 |
14 | 121,592,162 | 30,301,450 | 40,782,016 | 0 | 50,508,696 | 13,301,456 |
15 | 127,671,770 | 31,210,494 | 42,821,117 | 0 | 53,640,159 | 12,841,874 |
16 | 134,055,359 | 32,146,809 | 44,962,173 | 0 | 56,946,377 | 12,393,055 |
17 | 140,758,127 | 33,111,213 | 47,210,282 | 0 | 60,436,632 | 11,957,012 |
18 | 147,796,033 | 34,104,549 | 49,570,796 | 0 | 64,120,688 | 11,532,854 |
19 | 155,185,835 | 35,127,686 | 52,049,336 | 0 | 68,008,813 | 11,120,188 |
20 | 162,945,127 | 36,181,517 | 54,651,803 | 0 | 72,111,807 | 10,718,874 |
Table 7 provides a concise summary of the key economic output parameters for both scenarios. The natural gas-fired engine achieved an NPV of $99.6 million and an Internal Rate of Return (IRR) of 17.4 %, both exceeding the 10 % discount rate threshold, confirming the economic viability of natural gas-fired operation under the stated assumptions. Conversely, the hydrogen-fired engine yielded a negative NPV of -$358.1 million, rendering the investment economically unviable. The IRR for the hydrogen scenario could not be determined as all net cash flows were negative throughout the project lifecycle, indicating that the investment would never recover its initial capital outlay under current cost assumptions.
The findings demonstrate that while hydrogen offers superior thermal efficiency (31.4 % vs. 30.5 %) and a lower heat rate compared to natural gas, these performance improvements are insufficient to offset the substantial fuel cost differential. The hydrogen price of $6.82/MMBtu [21] adopted in this analysis is approximately 2.8 times higher than the natural gas price of $2.4/MMBtu. This fuel cost disparity directly translates into a significant negative cash flow position for the hydrogen-fired engine, as illustrated in Table 6.
These results align with findings from Oberg et al. [3], who reported that hydrogen-fueled gas turbines can only compete with other energy systems if strict regulations on CO₂ emissions are enforced, and under current conditions are not economically viable due to relatively high permitted CO₂ emissions. Similarly, Sharma et al. [22] and Yazdani et al. [23] emphasized that the economic viability of hydrogen-fueled gas turbines depends heavily on hydrogen production costs, infrastructure investment, and policy support mechanisms. The present study corroborates these conclusions, demonstrating that without significant reductions in green hydrogen production costs or the introduction of carbon pricing mechanisms, hydrogen remains economically uncompetitive with natural gas for industrial gas turbine power generation.
Table 620-year discounted cash flow (DCF) analysis for gas turbine fired with hydrogen
Year | Revenue on excess electricity sold to grid, +Re (5 %) escalation rate ($) | O&M cost, (3 %) | GT fuel cost, (5 %) | Annual loan repayment ($) | Annual net cash flow ($) | Present value 10 % discount rate, ($) |
Escalation rate ($) | Escalation rate ($) | |||||
0 | – | – | – | – | –113,400,000 | –113,400,000 |
1 | 64,482,920 | 20,634,534 | 59,524,183 | 0 | –15,675,797 | –14,250,724 |
2 | 67,707,066 | 21,253,570 | 62,500,393 | 0 | –16,046,897 | –13,261,898 |
3 | 71,092,419 | 21,891,177 | 65,625,412 | 16,191,668 | –32,615,838 | –24,503,703 |
4 | 74,647,040 | 22,547,912 | 68,906,683 | 16,191,668 | –32,999,223 | –22,537,056 |
5 | 78,379,392 | 23,224,350 | 72,351,017 | 16,191,668 | –33,387,643 | –20,730,254 |
6 | 82,298,362 | 23,921,080 | 75,968,567 | 16,191,668 | –33,782,953 | –19,070,550 |
7 | 86,413,280 | 24,638,713 | 79,767,995 | 16,191,668 | –34,185,096 | –17,543,164 |
8 | 90,733,944 | 25,377,874 | 83,756,395 | 16,191,668 | –34,591,993 | –16,136,069 |
9 | 95,270,641 | 26,139,210 | 87,944,215 | 16,191,668 | –35,004,452 | –14,841,596 |
10 | 100,034,173 | 26,923,387 | 92,341,426 | 16,191,668 | –35,422,308 | –13,653,425 |
11 | 105,035,881 | 27,731,089 | 96,958,497 | 16,191,668 | –35,845,373 | –12,564,649 |
12 | 110,287,675 | 28,562,022 | 101,806,422 | 16,191,668 | –36,272,437 | –11,557,673 |
13 | 115,802,059 | 29,418,883 | 106,896,743 | 0 | –20,513,567 | –5,942,388 |
14 | 121,592,162 | 30,301,450 | 112,241,580 | 0 | –20,950,868 | –5,517,336 |
15 | 127,671,770 | 31,210,494 | 117,853,659 | 0 | –21,392,383 | –5,121,464 |
16 | 134,055,359 | 32,146,809 | 123,746,342 | 0 | –21,837,792 | –4,752,819 |
17 | 140,758,127 | 33,111,213 | 129,933,659 | 0 | –22,286,745 | –4,409,576 |
18 | 147,796,033 | 34,104,549 | 136,430,342 | 0 | –22,738,858 | –4,090,030 |
19 | 155,185,835 | 35,127,686 | 143,251,859 | 0 | –23,193,710 | –3,792,588 |
20 | 162,945,127 | 36,181,517 | 150,414,452 | 0 | –23,650,842 | –3,515,763 |
Table 7Summary of key economic analysis output parameters
Parameter | Natural gas | Hydrogen |
Annual revenue | $64,482,920 | $64,482,920 |
Annual O&M cost | $20,634,534 | $20,634,534 |
Annual fuel cost | $21,627,571 | $59,524,183 |
Net annual cash flow (Year 1) | $22,220,815 | –$15,675,797 |
Net present value (NPV) | $99.6 million | –$358.1 million |
Internal rate of return (IRR) | 17.4 % | N/A |
4. Conclusions
This study has successfully investigated the economic viability of using hydrogen as an alternative to fossil fuels in IBOM Power Plant.
Key findings:
1) When comparing the heat rate of the engine operated separately on natural gas and hydrogen, the results showed values of 11794.1kJ/kWh and 11447.2 kJ/kWh, respectively.
2) The Net Present Value (NPV) for the natural gas fired engine was $99.5 million, whereas the hydrogen-fired engine resulted in a negative NPV of –$358.1 million, indicating economic not infeasible.
3) The IRR for the natural gas-fired engine was calculated at 17.4 %. However, the IRR for the hydrogen-fired engine could not be determined due to the negative NPV, confirming its lack of economic viability.
4) The study concludes that while hydrogen offers significant environmental and performance advantages, its practical deployment for large-scale power generation will require significant reductions in hydrogen production costs.
Future research should investigate hydrogen-natural gas blending strategies, long-term fuel price sensitivity, and policy-driven economic scenarios to identify feasible pathways toward hydrogen adoption in gas turbine power plants.
References
-
S. Meziane and A. Bentebbiche, “Numerical study of blended fuel natural gas-hydrogen combustion in rich/quench/lean combustor of a micro gas turbine,” International Journal of Hydrogen Energy, Vol. 44, No. 29, pp. 15610–15621, Jun. 2019, https://doi.org/10.1016/j.ijhydene.2019.04.128
-
M. C. Cameretti, A. Cappiello, R. de Robbio, and R. Tuccillo, “Comparison between hydrogen and syngas fuels in an integrated micro gas turbine/solar field with storage,” Energies, Vol. 13, No. 18, p. 4764, 2020, https://doi.org/10.3390/en13184764
-
S. Öberg, M. Odenberger, and F. Johnsson, “Exploring the competitiveness of hydrogen-fueled gas turbines in future energy systems,” International Journal of Hydrogen Energy, Vol. 47, No. 1, pp. 624–644, Jan. 2022, https://doi.org/10.1016/j.ijhydene.2021.10.035
-
O. Balli, Y. Sohret, and H. T. Karakoc, “The effects of hydrogen fuel usage on the exergetic performance of a turbojet engine,” International Journal of Hydrogen Energy, Vol. 43, No. 23, pp. 10848–10858, Jun. 2018, https://doi.org/10.1016/j.ijhydene.2017.12.178
-
G.-P. Zhang, G.-X. Li, H.-M. Li, and J.-C. Lv, “Experimental study on the effect of diluent gas on H2/CO/air mixture turbulent premixed flame,” International Journal of Hydrogen Energy, Vol. 47, No. 1, pp. 610–623, Jan. 2022, https://doi.org/10.1016/j.ijhydene.2021.10.006
-
A. Di Gaeta, F. Reale, F. Chiariello, and P. Massoli, “A dynamic model of a 100 kW micro gas turbine fuelled with natural gas and hydrogen blends and its application in a hybrid energy grid,” Energy, Vol. 129, pp. 299–320, 2017, https://doi.org/10.1016/j.energy.2017.03.173
-
B. A. Imteyaz, M. A. Nemitallah, A. A. Abdelhafez, and M. A. Habib, “Combustion behavior and stability map of hydrogen-enriched oxy-methane premixed flames in a model gas turbine combustor,” International Journal of Hydrogen Energy, Vol. 43, No. 34, pp. 16652–16666, Aug. 2018, https://doi.org/10.1016/j.ijhydene.2018.07.087
-
G. L. Juste, “Hydrogen injection as additional fuel in gas turbine combustor. Evaluation of effects,” International Journal of Hydrogen Energy, Vol. 31, No. 14, pp. 2112–2121, Nov. 2006, https://doi.org/10.1016/j.ijhydene.2006.02.006
-
N. Kahraman, S. Tangöz, and S. O. Akansu, “Numerical analysis of a gas turbine combustor fueled by hydrogen in comparison with jet-A fuel,” Fuel, Vol. 217, pp. 66–77, 2018, https://doi.org/10.1016/j.fuel.2017.12.071
-
H. Kim, V. Arghode, M. Linck, and A. Gupta, “Hydrogen addition effects in a confined swirl-stabilized methane-air flame,” International Journal of Hydrogen Energy, Vol. 34, No. 2, pp. 1054–1062, Jan. 2009, https://doi.org/10.1016/j.ijhydene.2008.10.034
-
P. Chiesa, G. Lozza, and L. Mazzocchi, “Using hydrogen as gas turbine fuel,” Journal of Engineering for Gas Turbines and Power, Vol. 127, No. 1, pp. 73–80, 2005, https://doi.org/10.1115/1.1787513
-
X. Liu et al., “Investigation of turbulent premixed methane/air and hydrogen-enriched methane/air flames in a laboratory-scale gas turbine model combustor,” International Journal of Hydrogen Energy, Vol. 46, No. 24, pp. 13377–13388, Apr. 2021, https://doi.org/10.1016/j.ijhydene.2021.01.087
-
B. Giancarlo, T. Giordano, and C. Valerio, “ENEL’s hydrogen and natural gas turbine combustion,” ENEL Ricerca, Firenze, Italy, 1999.
-
L. Larfeldt and Andersson, “Co-firing with hydrogen in industrial gas turbines,” SGC Report 256, 2013.
-
D. Pashchenko, “Hydrogen-rich gas as a fuel for the gas turbines: A pathway to lower CO2 emission,” Renewable and Sustainable Energy Reviews, Vol. 173, p. 113117, 2023, https://doi.org/10.1016/j.rser.2022.113117
-
Y. Sun et al., “Effect of hydrogen addition on the combustion and emission characteristics of methane under gas turbine relevant operating condition,” Fuel, Vol. 324, p. 124707, Sep. 2022, https://doi.org/10.1016/j.fuel.2022.124707
-
B. Nkoi, “Techno-economic studies of environmentally friendly Brayton cycles in the petrochemical industry,” Cranfield University, Cranfield University, UK, 2014.
-
I. Allison, “Techno-economic evaluation of associated gas usage for gas turbine power generation in the presence of degradation and resource decline,” Cranfield University, UK, 2014.
-
Razak and A. M. Y., Industrial gas turbines performance and operability. Abington Hall, Abington Cambridge, England: Woodhead Publishing Limited, 2007.
-
Y. S. H. Najjar, A. H. Zahed, M. D. Bashir, and T. Alp, “Feasibility of hydrogen utilization in gas turbine engines,” Energy and Environment, Vol. 1, No. 3, pp. 240–251, 1990, https://doi.org/10.1177/0958305x9000100304
-
“Link to price of hydrogen at $6.82/MMBtu.” EIA, https://www.eia.gov/todayinenergy/detail.php?id=61763 (accessed Apr. 2025).
-
S. Sharma, S. Agarwal, and A. Jain, “Significance of hydrogen as economic and environmentally friendly fuel,” Energies, Vol. 14, No. 21, p. 7389, Nov. 2021, https://doi.org/10.3390/en14217389
-
A. M. Yazdani, M. Salimi, and M. Amidpour, “Techno-economic study of gas turbines with hydrogen, ammonia, and their mixture fuels,” Heliyon, Vol. 10, No. 23, p. e40727, Dec. 2024, https://doi.org/10.1016/j.heliyon.2024.e40727
About this article

The authors are exceedingly grateful to Tertiary Education Trust Fund (TETFUND) for funding this research work.
The datasets generated during and/or analyzed during the current study are available from the corresponding author on reasonable request.
Roupa Agbadede: conceptualization, investigation data analysis, writing some parts of the original, and review and editing. Biweri Kainga: formal analysis, investigation, methodology, writing some sections of the original draft.
The authors declare that they have no conflict of interest.
