Abstract
In order to alleviate the fatigue damage caused by resonance in the combined multi-layer linear vibrating screen, this study conducted modal and harmonic response analysis using Workbench finite element analysis software. The results showed that there was a resonance risk at the 9th natural frequency. By optimizing the thickness of the side plates (increasing it by 4 millimeters), the frequency was successfully removed from the working range. This paramete optimization significantly improved the dynamic performance and reliability of the structure, providing a solid theoretical basis for design.
Highlights
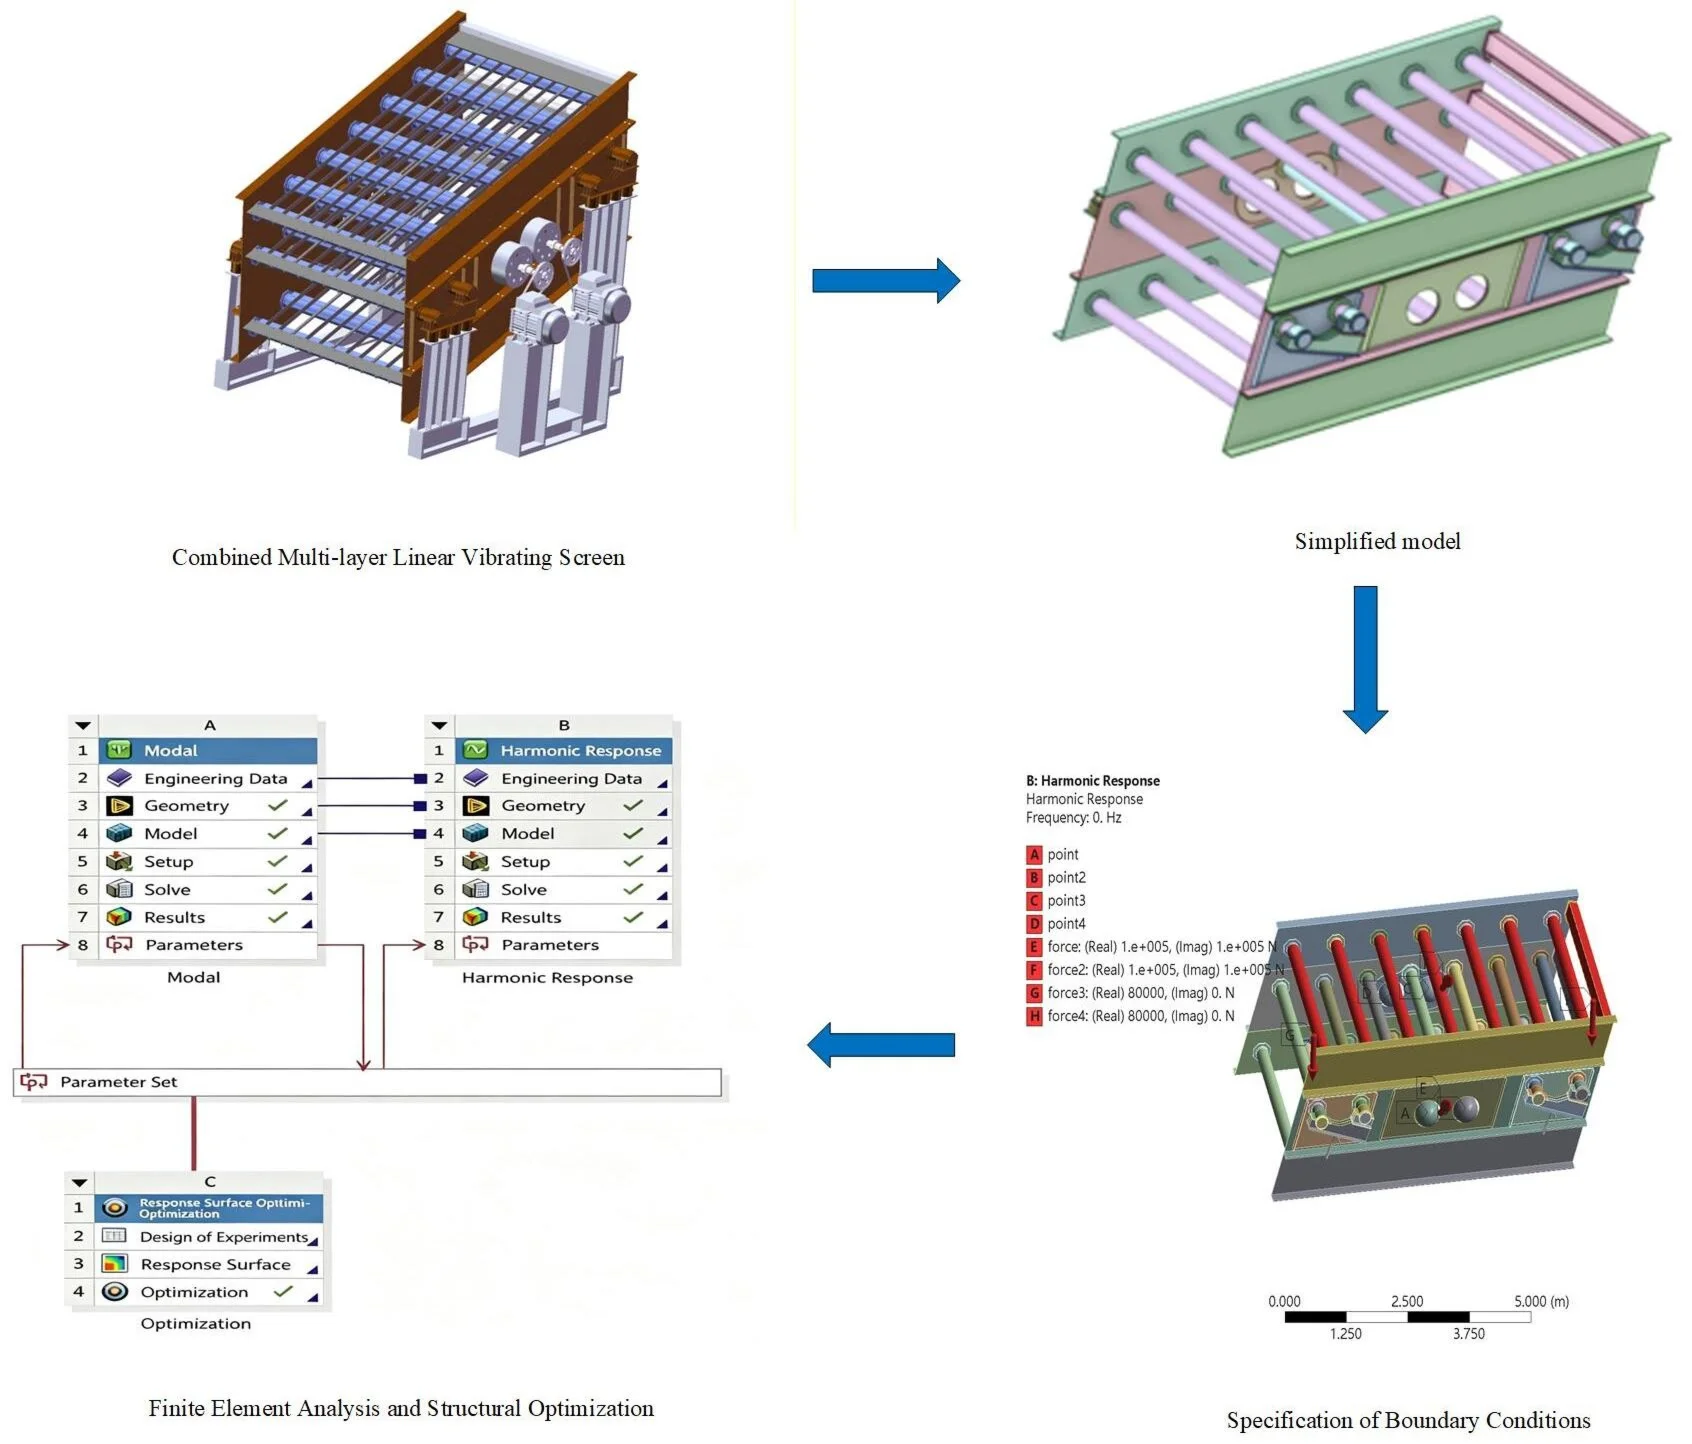
- Research Highlight Propose a new type of combined linear vibrating screen.
- The number of screening layers of this vibrating screen can be determined.
- The dynamics and optimization of the new type vibrating screen were carried out, and the results proved that the vibrating screen was feasible.
1. Introduction
Vibrating screening equipment, as a device for material classification and separation, is widely used in industries such as coal, metallurgy, chemical engineering, and construction. In the coal industry, it is mainly applied in processes such as coal grading, dewatering, desliming, and medium removal [1]-[3]. In the modern coal preparation process, the reliability, stability, and timeliness of coal preparation have become new requirements for vibrating screening machinery. However, various faults are frequently encountered during the vibrating screening of coal [4]-[5].
Currently, vibrating screens typically use a single screen body suitable only for one working condition, making it difficult to achieve multi-grade screening when conditions vary. In contrast, the multi-layer main screen body studied in this paper features multiple bolt holes on the left and right sides of each layer's side plates. When multi-stage screening is required, the side plates of the excitation layer and screen layer can be aligned and bolted together, enabling adaptation to different material particle sizes through assembly.Although the multi-layer vibrating screen significantly reduces usage and maintenance costs through its flexible, efficient, and easy-to-maintain design, harsh working conditions and increased processing capacity in coal preparation plants impose higher demands on its throughput. This has led to issues such as severe screen body deformation, weld cracking, and side plate fracture in actual production [6], greatly reducing the service life and screening efficiency.
Therefore, dynamic analysis and structural parameter optimization of the vibrating screen are essential. This approach helps identify potential failure locations during the early manufacturing stage and ensures that the natural frequency remains far from the operating frequency to avoid resonance. This paper focuses on the side plates of a three-layer linear vibrating screen, systematically conducting finite element simulation analysis and structural parameter optimization research.
2. Three-dimensional overall modeling and simplification of combined linear vibrating screen
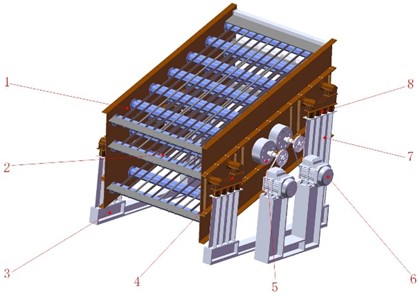
As shown in Fig. 1, the combined linear vibrating screen mainly consists of the main screen body, screen surface, frame, rubber springs, upper spring support, lower spring support and motor. The main screen body is composed of three layers of side plates (upper side plate, exciter side plate, lower side plate), cross beams, short cross beams, reinforcing plates, feed end support and blocking cross beam, feed end pressure plate, discharge port, discharge pressure plate, support beam and two exciters. The cross beams, short cross beams, reinforcing plates, feed end support and blocking cross beam, support beam, exciters and spring supports are fixed on the side plates by bolts. Layers are connected by bolts. The motor is installed on the frame support, and the motor drives the exciters through belt transmission. The main screen body is connected to the spring support seat through rubber springs, and the spring support seat is fixed to the frame by bolts.
Fig. 1Schematic diagram of the structure of the combined vibrating screen: 1 – main screen body; 2 – screen surface; 3 – frame; 4 – spring upper support; 5 – exciter; 6 – motor; 7 – spring lower support; 8 – spring
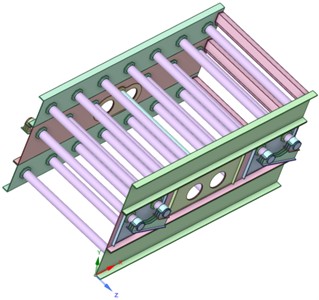
The combined linear vibrating screen model constructed in SolidWorks was imported into SpaceClaim for simplification processing. While ensuring that the simulation results of the vibrating screen movement are not affected, the simplified model obtained is shown in Fig. 2.
Fig. 2Simplified model
3. Establishment of model
After completing the simplified three-dimensional model of the vibrating screen using space claim, the modal analysis module is applied to analyze the natural frequencies of the structure. Considering the harsh working environment and economic benefits of the vibrating screen, the material mainly adopts the common Q235.
First, define the materials and then click on the model section. After confirming that the geometric structure and materials are correct, apply the mass of 4 points at the installation position of the exciter to represent the actual mass of the exciter. Secondly, confirm the connections between the parts. Since the connection methods between the various parts of the vibrating screen mainly include welding and bolt connection, there is no relative motion between the parts, which is a binding constraint to limit the relative motion between the parts. Then, establish 4 coordinate systems and add 12 grounding springs to simulate the motion characteristics of the vibrating screen, achieving the grounding constraints of the four spring supports of the vibrating screen in the , , and directions.
4. Modal analysis
The core objective of modal analysis is to obtain the natural frequencies and mode shapes of the vibrating screen. After the modal analysis is completed, the mode shape and natural frequency of the screen box can be obtained. The screen box itself has a working frequency. When this working frequency is equal to or close to the natural frequency, the screen box will generate resonance. Resonance will cause the amplitude of the screen body to increase sharply, which will result in drastic fluctuations in the screening efficiency, abnormal material transportation, and generate huge stress, potentially causing the structure of the vibrating screen to be damaged within a short period of time, and even triggering safety accidents. This needs to be avoided.
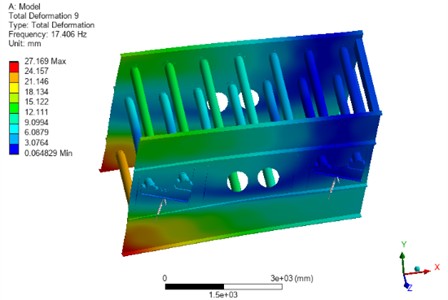
In the model, its working frequency is 16 Hz, and the results of the first 12 modes of the vibrating screen are shown in Table 1, and the 9th order mode is shown in Fig. 3. From Table 1, it can be seen that the 9th order natural frequency of the vibrating screen is very close to the operating frequency, with a difference of 17.40-16 = 1.40 Hz, the vibrating screen is prone to resonance at this time. As shown in Fig. 3, the 9th order modal shape is the longitudinal bending deformation of the horizontal plane. The deformation and displacement of the upper and middle layers are small, while the deformation of the lower discharge end is large, which will generate bending stress.
Table 1Natural frequencies of the first 12 orders of combined multilayer linear vibrating screen
Degree | 1 | 2 | 3 | 4 | 5 | 6 | 7 | 8 | 9 | 10 | 11 | 12 |
Frequency (Hz) | 2.40 | 2.45 | 3.12 | 4.07 | 4.63 | 4.87 | 9.88 | 11.68 | 17.41 | 19.61 | 21.86 | 30.03 |
Fig. 3The 9th order mode
5. Optimization of side plate parameters
At 17.40 Hz, resonance is likely to occur. From the modal shape, without affecting the main structure of the vibrating screen, increasing the thickness of the side plate can make the natural frequency of the vibrating screen stay away from the operating frequency. The mass of the vibrating body needs to be considered, increasing the quality will cause the excitation force to increase, causing other problems.
For the parameterization of side plate thickness, set the thickness of the three-layer side plate to be the same. The input parameter is the thickness of the middle side plate. The thickness of the upper and lower side plates changes with the middle plate, and the output parameter is the 7th, 8th, and 9th order frequencies. Set 7 levels, with the initial value of 14 mm increasing to 20 mm, increasing by 1 mm each time. After calculation, the side plate and the 7th, 8th, and 9th frequency response diagrams are obtained as shown in Fig. 4. After confirming the optimization objective and constraints, the two sets of results in Table 2 are obtained.
Table 2Results after optimization of the 7th, 8th and 9th orders
Side panel thickness (mm) | 7 | 8 | 9 |
14 | 9.88 | 11.68 | 17.41 |
18 | 10.18 | 12.59 | 19.07 |
19 | 10.22 | 12.72 | 19.18 |
Fig. 4Side plate thickness and frequency response diagram
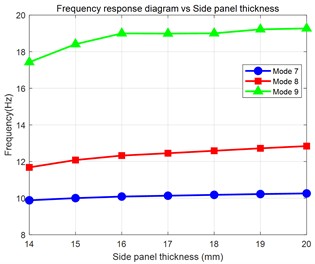
Fig. 5The optimized 9th order mode
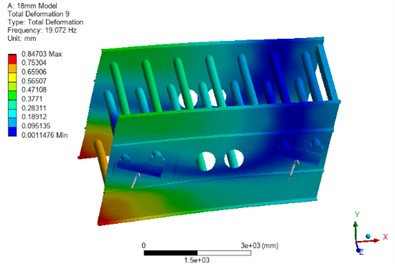
By analyzing, when the thickness of the appropriate side plate is increased to 4mm, the absolute value of the difference between the 9th order natural frequency and the operating frequency is 19.2 %, which fully meets the 10 % standard required for the design of the vibrating screen system. The absolute value of the error when increasing by 5 mm is 19.9 %, which can also avoid resonance. Considering the issues of mass and excitation force, the optimal method for improving the side plate structure of the vibrating screen is to increase the thickness by 4 mm. The optimized 9th order vibration mode is shown in Fig. 5, Optimize the frequency of the vibrating screen in Table 3.
Table 3Optimize the frequency of the vibrating screen
Degree | 1 | 2 | 3 | 4 | 5 | 6 | 7 | 8 | 9 | 10 | 11 | 12 |
Frequency (Hz) | 2.33 | 2.37 | 3.00 | 3.94 | 4.46 | 4.68 | 10.18 | 12.59 | 19.07 | 21.22 | 24.28 | 31.74 |
6. Comparison before and after harmonic response optimization analysis
After the modal analysis is completed, a harmonic response analysis is conducted based on it. The main purpose of the harmonic response analysis is to obtain the amplitude peak frequency from the frequency response graph, and then check the stress, deformation, etc. results at the corresponding frequency. Set the analysis parameters. The stress distribution and deformation distribution of the three-layer side plates of the vibrating screen at the working frequency of 16 Hz are obtained.
The results of the stress cloud diagrams before and after optimization are shown in Fig. 6. From the figures, it can be concluded that the stress of the three-layer side plates before and after optimization has decreased. Among them, the maximum stress of the upper side plate before and after optimization was 101.83 MPa and 65.09 MPa respectively, the maximum stress of the middle side plate before and after optimization was 91.61 MPa and 68.46 MPa respectively, and the maximum stress of the lower side plate before and after optimization was 171.38 MPa and 104.1 MPa respectively.
Fig. 6Optimized front and rear side panel stress cloud diagram
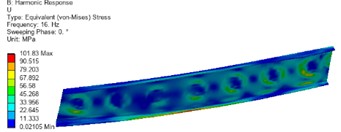
a) Stress of the upper side plate before optimization
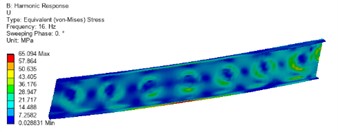
b) Stress of the upper side plate after optimization
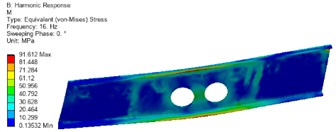
c) Stress of the middle side plate before optimization
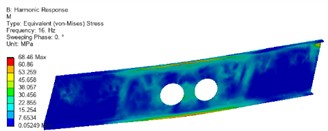
d) Stress of the middle side plate after optimization
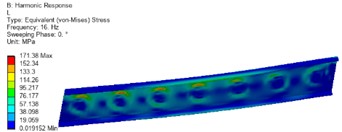
e) Stress of the lower side plate before optimization
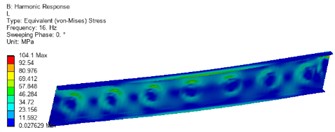
f) Stress of the lower side plate after optimization
Fig. 7Optimized front and rear side panel deformation cloud diagram
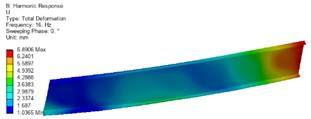
a) Optimized pre-configuration of the upper side plate strain
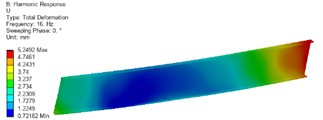
b) Optimized post-configuration of the upper side plate strain
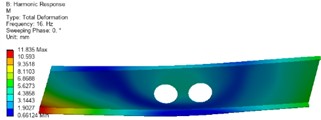
c) Optimized pre-configuration of the middle side plate strain
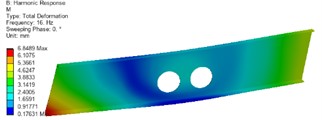
d) Optimized post-configuration of the middle side plate strain
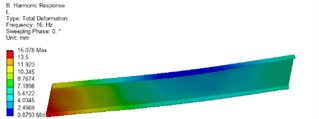
e) Optimized pre-configuration of the lower side plate strain
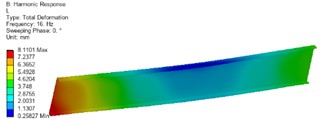
f) Optimized post-configuration of the lower side plate strain
The deformation results before and after optimization are shown in Fig. 7. The deformation degree of the three-layer side plates after optimization has decreased. Among them, the maximum deformation of the upper side plate before and after optimization was 6.89 mm and 5.24 mm respectively. Since the excitation force was applied to the middle side plate, after increasing the thickness of the side plate, the deformation significantly decreased. The maximum deformation of the middle side plate before and after optimization was 11.84 mm and 6.8489 mm respectively. Because the lower side plate has to bear the weight of the entire sieve body and the weight of the materials, increasing the thickness of the lower side plate would improve its performance. The maximum deformation of the lower side plate before and after optimization was 15.08 mm and 8.11 mm respectively. Through data comparison, it can be seen that the optimization effect of the middle side plate and the lower side plate is the most obvious.
7. Conclusions
In this study, the research object is different from the traditional vibrating screen. Instead, a multi-layer vibrating screen that can be combined vertically is selected as the research subject. A three-dimensional simplified model of a combined multi-layer linear vibrating screen was established using SolidWorks and SpaceClaim, and a dynamic simulation model was constructed based on the finite element method in Workbench. Through modal analysis of the screen, its natural frequencies and mode shapes were determined, and potential resonance risks were identified. Taking the thickness of the side plates as the design variable, the structure was improved using a parameter optimization method, and the dynamic performance before and after optimization was compared through harmonic response analysis, the following conclusions were drawn:
1) The modal analysis results indicated that the original structure’s 9th natural frequency was too close to the operating frequency, with a frequency difference of only 1.41 Hz, which did not meet the design requirement of avoiding the resonance zone by 10 %.The parameter optimization experiment results showed that the thickness of the side plates was a key factor affecting the dynamic characteristics of the vibrating screen. By uniformly increasing the thickness of the three-layer side plates by 4 mm, the 9th natural frequency was raised to 19.07 Hz, and the frequency difference with the operating frequency was expanded to 19.2 %, successfully avoiding the resonance zone.
2) The harmonic response analysis results indicated that the structural optimization significantly improved the mechanical performance and operational stability of the vibrating screen. At the operating frequency, the maximum stress of the upper, middle, and lower layer side plates was significantly reduced after optimization; among them, the maximum deformation of the middle and lower side plates decreased by approximately 42 % and 46 %, respectively. The study verified the effectiveness of the side plate thickening scheme in reducing alternating stress concentration and suppressing structural deformation.
References
-
Y. Li and R. Yang, “Analysis and optimization of vibrating screen structure based on modal simulation,” Vibroengineering Procedia, Vol. 55, pp. 97–103, Sep. 2024, https://doi.org/10.21595/vp.2024.24205
-
K. Qi, R. Li, and X. Sun, “Dynamic characteristic analysis and strength optimization of vibrating screen based on computer simulation technology,” Vibroengineering Procedia, Vol. 57, pp. 46–52, Dec. 2024, https://doi.org/10.21595/vp.2024.24583
-
Y. Wang, Z. Wang, M. Zhang, B. Xu, and Y. Song, “Dynamic characteristics analysis of a circular vibrating screen,” Vibroengineering Procedia, Vol. 48, pp. 22–28, Feb. 2023, https://doi.org/10.21595/vp.2022.23025
-
Z. Wang, C. Liu, J. Wu, H. Jiang, B. Song, and Y. Zhao, “A novel high-strength large vibrating screen with duplex statically indeterminate mesh beam structure,” Journal of Vibroengineering, Vol. 19, No. 8, pp. 5719–5734, Dec. 2017, https://doi.org/10.21595/jve.2017.18319
-
S. Zhou, L. Meng, Y. Du, and Z. Wang, “Dynamic analysis of a new type of linear vibrating screen with adjustable vibration direction angle,” Vibroengineering Procedia, Vol. 58, pp. 8–13, May 2025, https://doi.org/10.21595/vp.2025.24791
-
A. Daşdemir, “A modal analysis of forced vibration of a piezoelectric plate with initial stress by the finite-element simulation,” Mechanics of Composite Materials, Vol. 58, No. 1, pp. 69–80, Mar. 2022, https://doi.org/10.1007/s11029-022-10012-7
About this article

This research was supported by the Natural Science Foundation Project of Shandong Province (ZR2023ME211) and the Project for Enhancing the Innovation Ability of Shandong Province’s Technology-based Small and Medium-sized Enterprises (2023TSGC0387).
The datasets generated during and/or analyzed during the current study are available from the corresponding author on reasonable request.
The authors declare that they have no conflict of interest.

