Abstract
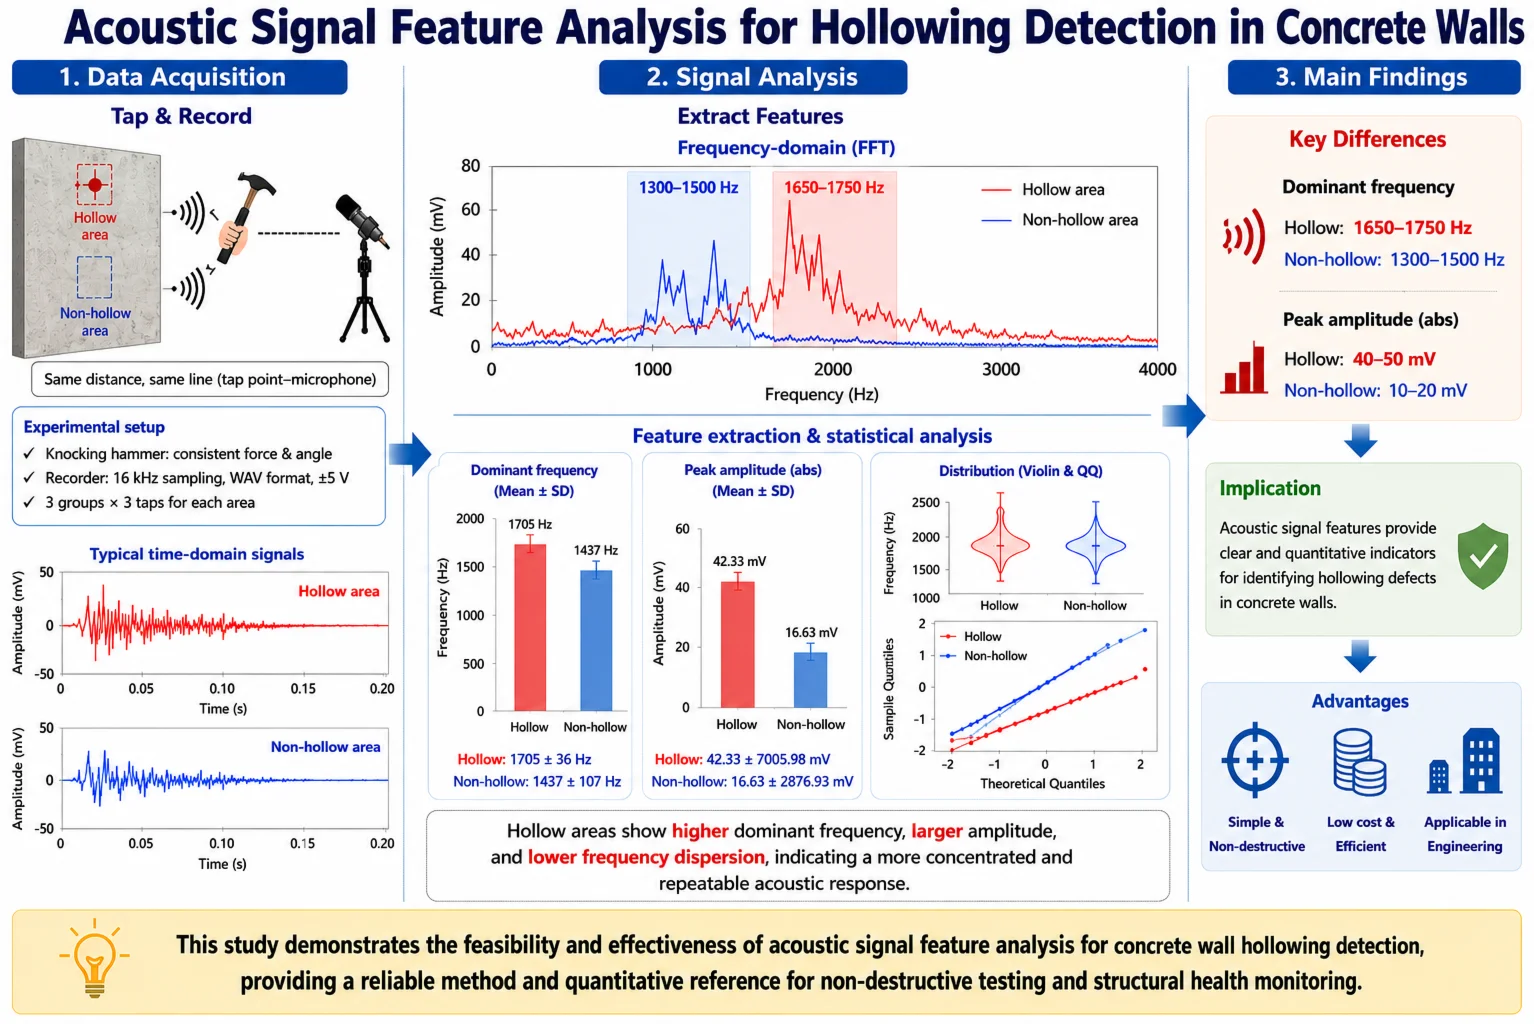
Concrete wall hollowing is a common defect affecting structural safety and durability, and its accurate identification is of great significance for ensuring the quality of construction projects. To achieve efficient and non-destructive detection of hollowing defects, this paper proposes a method for identifying the state of concrete wall hollowing using the characteristics of knock sound signals based on the principle of acoustic response. The study first collects acoustic signal data from hollowing and non-hollowing areas through standardized knocking experiments, and conducts systematic time-domain and frequency-domain feature analysis. By comparing signal waveform and spectral characteristics, the study explores the differences in acoustic response between hollowing and non-hollowing areas. The research results provide a reliable parameter basis for acoustic detection of concrete structures and verify the feasibility and effectiveness of the hollowing identification approach based on acoustic signal characteristics. This research method has the advantages of simplicity, low cost, and strong applicability, and can provide new technical support and application references for non-destructive testing and intelligent health monitoring of building structures. The results show that under the experimental conditions of this study, the dominant frequencies of hollow areas are mainly distributed in the range of 1650-1750 Hz, while those of non-hollow areas are concentrated within 1300-1500 Hz. The absolute values of peak amplitudes of hollow areas generally fall between 40-50 mV, whereas those of intact regions range from 10-20 mV, which provides quantitative reference criteria for hollow defect detection in practical engineering.
Highlights
- An acoustic signal feature analysis method was developed for quantitative hollowing detection in concrete walls.
- Controlled impact tests were conducted to collect acoustic responses from hollow and non-hollow wall areas.
- FFT analysis identified distinct dominant-frequency characteristics between hollow and non-hollow areas.
- Hollow areas showed higher dominant frequency and peak amplitude than non-hollow areas.
- Acoustic signal features provide a simple, non-destructive and quantitative approach for concrete wall hollowing detection.
1. Introduction
With the continuous advancement of urbanization and infrastructure renewal, concrete structures are increasingly widely used in fields such as construction, transportation, and water conservancy [1-3]. Their quality and durability are directly related to the safety and service life of the projects [4, 5]. However, during the construction and service processes, concrete structures are inevitably affected by material defects, construction techniques, and environmental factors, resulting in internal or interfacial defects such as hollowing and cracks [6, 7]. These defects are highly concealed and potentially harmful. If not identified and repaired in a timely manner, they may lead to structural performance degradation or even safety accidents [8, 9]. Therefore, developing efficient and reliable concrete defect detection technology holds significant engineering importance and application demand.
Among the defects in concrete structures, hollowing (delamination) is a typical concealed defect commonly found in walls and finishing layers [10, 11]. Its essence lies in the failure of bonding between the concrete and the mortar surface, resulting in a local void area [12, 13]. The formation of hollowing is often closely related to factors such as material shrinkage differences, non-standard construction, insufficient curing, or changes in environmental temperature and humidity [14-16]. In the early stages, the impact of hollowing defects on the overall performance of the structure is limited. However, under long-term loads, temperature and humidity cycles, and external disturbances, the hollowing area will gradually expand, leading to surface peeling and structural deterioration [17-19]. For exterior walls or decorative brick structures, hollowing may cause decorative tiles to fall off [20], posing serious threats to personnel safety in severe cases. Therefore, establishing accurate and efficient methods for hollowing identification and early detection holds practical engineering significance for building safety and structural health maintenance.
In the field of concrete hollowing detection, the existing non-destructive testing methods mainly include manual knocking and sound listening method, infrared thermal imaging method [21], ultrasonic impact echo method [22, 23], and geological radar method [24-26]. Infrared thermal imaging, ultrasonic, and geological radar technologies can accurately reflect the spatial distribution characteristics of internal defects in concrete, with high detection sensitivity and reliability. However, due to limitations in equipment cost, data processing complexity, and environmental adaptability, their application in specific scenarios is restricted. In contrast, the traditional manual knocking and sound listening method, with its advantages of simple equipment, low cost, and strong environmental adaptability, is still widely used in practical engineering inspections [27]. However, this method heavily relies on the auditory experience and subjective judgment of the inspector, and the detection results are greatly influenced by individual differences. The lack of unified quantitative standards and objective evaluation indicators makes it difficult to guarantee the accuracy and repeatability of the results.
In recent years, with the development of acoustic signal acquisition and digital signal processing technology, hollow detection based on acoustic response has gradually attracted research attention [28-30]. Compared with traditional methods relying on auditory perception, acoustic signal analysis can objectively characterize internal structural differences in concrete, providing a quantitative basis for hollow identification [31-33]. By analyzing parameters such as amplitude changes, spectral characteristics, and energy distribution of percussion acoustic signals, the inherent differences in acoustic characteristics between hollow and non-hollow areas can be revealed, laying the foundation for establishing an automated and intelligent hollow identification system [34-36]. However, current research on the relationship between acoustic signal characteristics and structural defects is still not sufficiently quantitative, unable to provide a data basis for analysis models and feature extraction. Therefore, it is still necessary to further carry out research on hollow identification based on acoustic signal characteristics.
Based on the principle of impact acoustic response, this paper proposes a quantitative acoustic analysis method for hollow areas identification in concrete walls for practical engineering applications. Impact acoustic signals from hollow areas and non-hollow areas are collected through standardized impact tests, and their response characteristics are obtained by combining time-domain analysis and Fast Fourier Transform (FFT). On this basis, a quantitative acoustic feature extraction and statistical discrimination framework based on repeated impact responses is constructed. Statistical features including mean frequency (Mean Frequency), standard deviation (SD) of frequency, coefficient of variation (CV) of frequency, mean amplitude (Mean Amplitude), and amplitude standard deviation (Amplitude SD) are extracted from both time and frequency domains to characterize frequency concentration, response stability, vibration intensity, and signal dispersion. Through multi-parameter joint analysis, the impact acoustic response characteristics and their statistical laws of hollow areas and non-hollow areas are investigated, and the application value of frequency stability and amplitude variation in hollow areas identification is discussed. This paper aims to verify the feasibility of the quantitative analysis method based on statistical features for identifying hollow areas in concrete walls under practical engineering conditions, and provides new research ideas and experimental evidence for the transformation of traditional percussion inspection from empirical judgment to objective quantitative evaluation.
2. Materials and methods
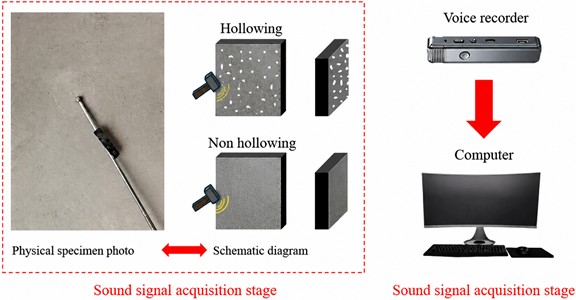
As shown in Fig. 1, this experiment mainly consists of two parts: sound signal acquisition and signal processing. Firstly, during the sound signal acquisition stage, a dedicated hollow detection hammer is used to conduct systematic tapping experiments on the surface of concrete walls, in order to obtain the acoustic responses of hollow and non-hollow areas. To ensure the reliability and reproducibility of the data, each set of samples undergoes three independent experiments, with three consecutive taps at the same location in each experiment, to minimize the impact of accidental errors. During the tapping process, the operating force and angle are strictly controlled to maintain consistent experimental conditions and ensure the comparability of signal acquisition. The sound signals are acquired using a portable voice recorder, with the recording format set to WAV and a sampling frequency of 16,000 Hz. The experimental environment is kept relatively quiet to reduce external noise interference. After recording, all sample signals are uniformly numbered and stored, providing a traceable data foundation for subsequent analysis.
In the signal processing stage, the acoustic signals collected by the digital voice recorder are imported into a computer for digital processing. Firstly, the original signals are preprocessed and visualized using audio analysis software (Audacity) to generate corresponding voltage waveform charts for subsequent feature extraction. In the experiment, the voltage range is set to ±5 V to cover the main variation range of acoustic wave energy. Subsequently, the preprocessed signals undergo time-domain and frequency-domain analysis. The dominant frequency information and frequency spectrum distribution of the signals are obtained through Fast Fourier Transform (FFT), and relevant feature parameters are extracted, including peak amplitude, frequency spectrum range, and signal dispersion degree. All data are organized in a unified format to provide basic data support for subsequent feature analysis.
The experiments were conducted on cast-in-place concrete walls in an unfinished building, with a wall thickness of 200 mm and a concrete strength grade of C30. Due to construction defects, naturally formed and irregularly distributed hollow areas exist inside the walls, whose geometry, dimensions, and depth cannot be accurately measured. Hollow areas were first identified through preliminary percussion tests, combined with their characteristic acoustic response features and surface observation; areas with stable responses and solid characteristics were selected as non-hollow control areas. During the testing process, the impact direction was kept as perpendicular to the wall surface as possible, and similar swing amplitudes and impact modes were adopted for all operations. The distance between the microphone and the wall surface was maintained at approximately 5 cm, and all tests were completed by the same experimenter using the same hollow detection hammer.
Fig. 1Diagrammatic sketch of experimental system
The field environment was relatively quiet, and the ambient background noise was measured to be low, resulting in a negligible impact on the acquisition results of impact acoustic signals. Each repeated test was conducted only after the sufficient attenuation of the previous vibration response to ensure the independence and comparability of the test results. This experimental strategy can well reflect the practical engineering inspection scenarios and verify the application potential of the proposed method under real engineering conditions.
3. Results
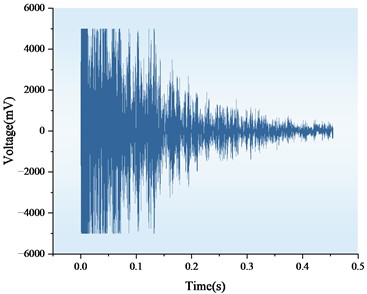
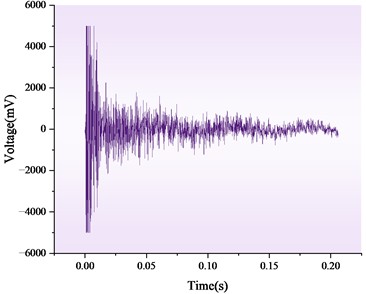
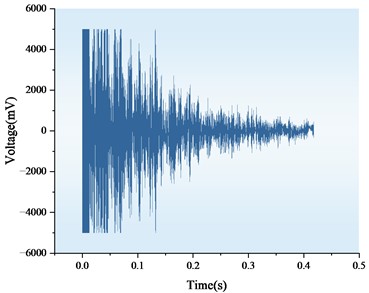
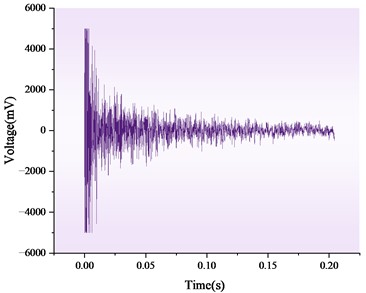
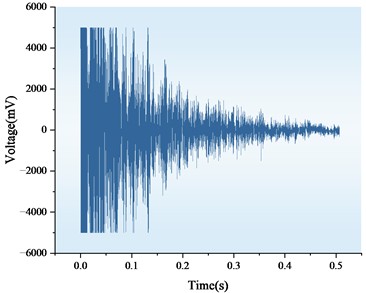
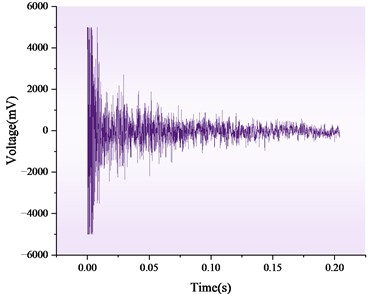
After completing data acquisition and processing according to the aforementioned method, acoustic response characteristics of hollow and non-hollow areas under different tapping conditions were obtained. Here, we present the processing results from one experiment, as shown in Fig. 2. The figure displays the time-domain response curves of acoustic signals from different structural areas. The graph illustrates the variation of voltage values after amplitude conversion with time. To maintain the comparability of each set of data, all signals underwent amplitude normalization and denoising processing. From the figure, it can be observed that the acoustic waves in the hollow area exhibit high-amplitude oscillations after excitation, with pronounced waveform fluctuations, small peak-to-valley spacing, and a prolonged main oscillation phase. The signal energy decays slowly after the initial impact, with residual waves persisting, and the vibration decay curve shows a nonlinear decreasing trend. In contrast, the acoustic wave response in the non-hollow area is relatively stable, with peak amplitudes significantly lower than those in the hollow area. Waveform changes are concentrated within a short time period, with rapid energy decay and a swift return to baseline levels. Additionally, it is noticeable that the hollow waveform morphology exhibits high consistency and stability, with minimal trend changes under repeated tapping. The non-hollow signals maintain a concentrated distribution in waveform morphology, displaying distinct characteristics of energy concentration and short-term decay, with a relatively narrow amplitude fluctuation range.
Fig. 2Waveform time-domain diagram of hollow and non-hollow areas
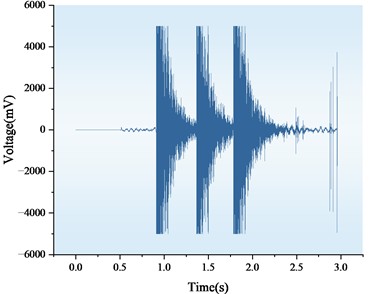
a) Hollow drum part
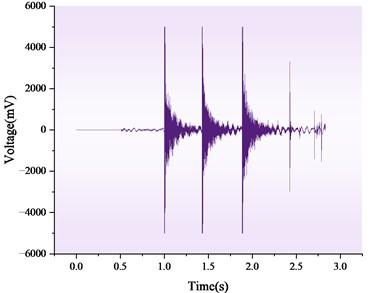
b) Non hollow drum part
c) The first strike of the hollow drum
d) The first strike of the Non hollow drum
e) The second strike of the hollow drum
f) The second strike of the Non hollow drum
g) The third strike of the hollow drum
h) The third strike of the Non hollow drum
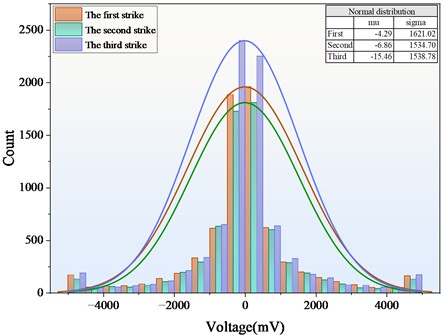
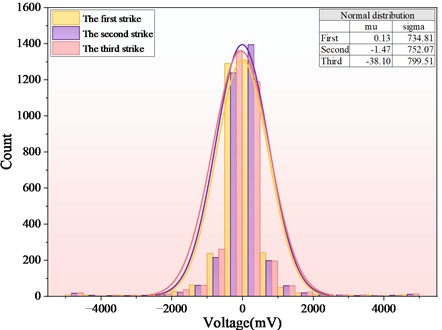
After statistical analysis of the collected acoustic signals, the occurrence frequencies of hollow and non-hollow samples under different voltage amplitudes are plotted as shown in Fig. 3. The figure presents the distribution pattern of counts corresponding to different voltage amplitudes, reflecting the occurrence probability of different amplitudes in the signals. It can be observed from the figure that the voltage distribution in the hollow area spans a larger range, with the curve exhibiting a broad shape in both positive and negative intervals, and the overall distribution is smooth. The frequency proportion in the high voltage range is significantly higher than that of non-hollow signals, indicating that their acoustic waves produce larger amplitude fluctuations after excitation. The frequency distribution curve of non-hollow signals is concentrated and steep, with samples mainly clustered in the low amplitude region near zero, and the curve peak is prominent, showing a high degree of distribution concentration. In addition, after statistical analysis of three sets of experimental data, the frequency curves can be drawn, revealing that the morphological differences of non-hollow signals are consistent. Compared with non-hollow signals, hollow signals have a higher occurrence frequency in the low amplitude range, exhibiting a more dense low amplitude distribution characteristic, and the curve width is significantly increased, with longer extensions at both positive and negative ends.
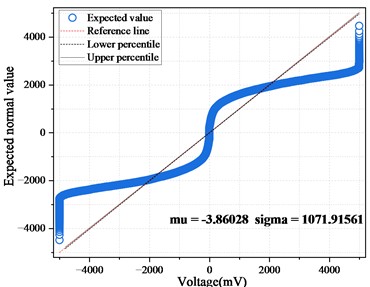
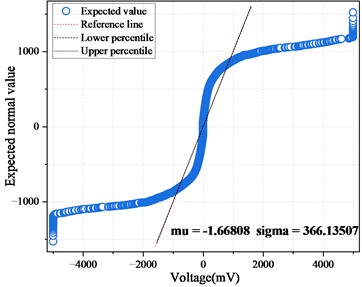
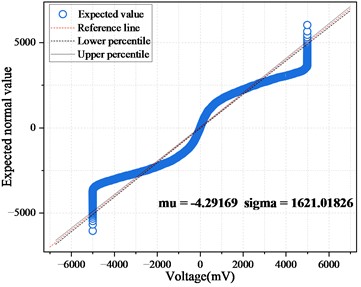
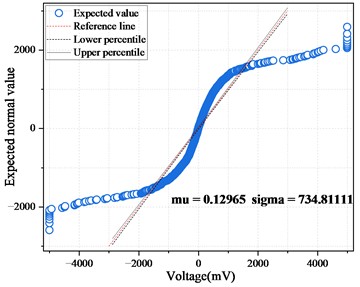
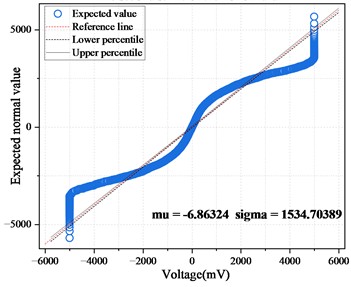
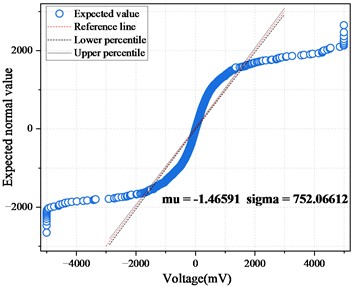
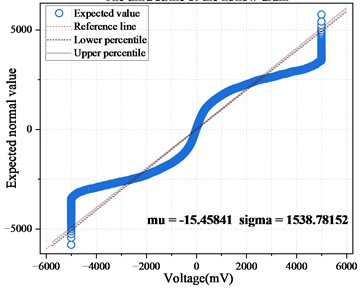
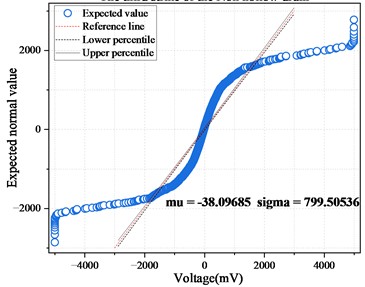
Fig. 4 illustrates the correspondence between the sample values of hollow and non-hollow signals and the theoretical normal distribution. The data is plotted using the average results from multiple experiments, with amplitude data extracted after normalization in the time domain for each set of signals. The horizontal axis represents theoretical quantiles, while the vertical axis represents measured quantiles. From the figure, it can be observed that the point distribution of hollow signals has a wider range, especially at both ends of the distribution, which significantly deviates from the reference line, exhibiting a band-like characteristic in scatter distribution. The data points in the middle region exhibit slight fluctuations, indicating an overall uneven trend, reflecting the randomness and variability of signal amplitudes. The scatter distribution of non-hollow signals is more concentrated, with a clear trend along the theoretical line, showing good overall linearity, with only slight deviations at extreme quantiles. The hollow sample points show an upward trend in the high quantile region, with strong dispersion and uneven inter-point distances, while the non-hollow sample points are arranged closely with low dispersion. The data structure of three strikes is stable, with clear distribution characteristics. The significant difference in scatter band width in the figure reveals the statistical characteristics of signal amplitude distribution under the two structural states.
Fig. 3Distribution diagram of hollow and non-hollow areas
a) Distribution diagram of hollow area
b) Distribution diagram of non-hollow areas
Fig. 5. presents the voltage distribution characteristics of hollow and non-hollow signals in the form of a violin plot combined with a box plot. The -axis represents the signal type, while the -axis represents the voltage amplitude. From the figure, it can be observed that the violin plot of the hollow signal has a broad outline, indicating a wide range of amplitude values. Meanwhile, its box plot has a large interval span, with obvious upper and lower whiskers extending, a large number of outliers, and a median line deviating from the zero point, reflecting the asymmetry of data distribution. The violin plot of the non-hollow signal is narrow and elongated, with a concentrated outline, a median line close to the zero point, a narrower box plot range, and data mainly concentrated in the low amplitude region, with fewer outliers. The symmetry difference in the violin plot intuitively reflects the differences in fluctuation range and concentration between the two types of signals.
Fig. 4QQ plot of amplitude data for hollow and non-hollow areas
a) The whole hollow drum part
b) The whole Non hollow drum part
c) The first strike of the hollow drum
d) The first strike of the Non hollow drum
e) The second strike of the hollow drum
f) The second strike of the Non hollow drum
g) The third strike of the hollow drum
h) The third strike of the Non hollow drum
Fig. 5Violin plus box plot of amplitude data for hollow and non-hollow areas
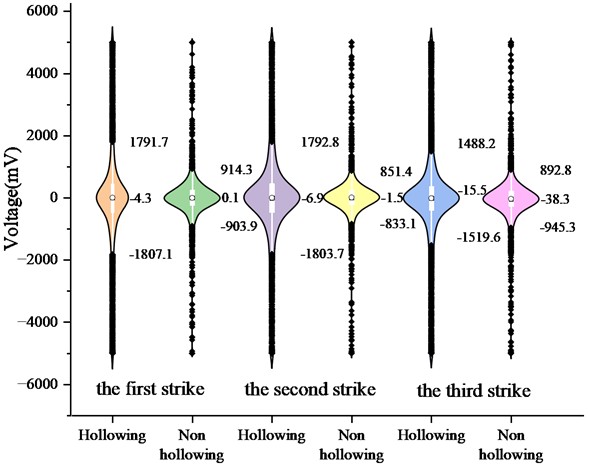
Fig. 6Ridge line diagram of hollow and non-hollow areas
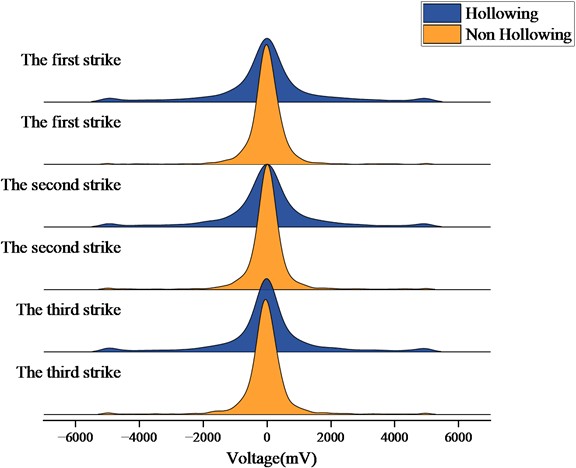
To further enhance the identifiability of hollow and non-hollow signals in terms of amplitude distribution characteristics, Fig. 6 presents a ridge plot formed based on experimental data from three taps, illustrating the probability distribution of different voltage amplitudes in the form of continuous density curves. It can be observed from the figure that the three density curves for hollow signals exhibit a significantly wide distribution range, showing elongated tails in both positive and negative amplitude intervals, with a relatively flat peak shape, indicating a large coverage range of vibration response amplitudes, high dispersion, and good consistency in distribution across multiple taps. In contrast, the density curves for non-hollow signals are highly concentrated, with steep and narrow main peaks formed near zero in all three trials, reflecting that the signal amplitude is mainly clustered in the low-value interval, with rapid vibration attenuation and a relatively compact distribution. The trend presented in the ridge plot further verifies the statistical rule in Fig. 3: hollow signals not only have a higher probability of occurrence in the low-amplitude interval but also exhibit a larger overall distribution span; whereas non-hollow signals are dominated by a single-peak structure with high concentration and low variance.
4. Discussion
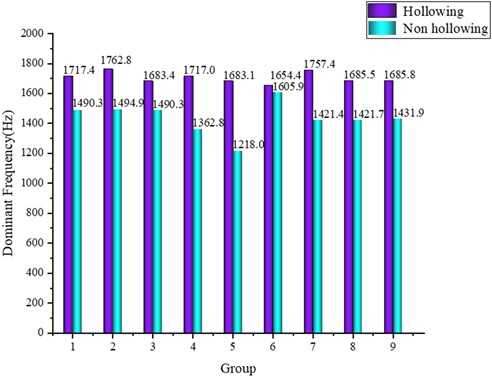
Based on the statistical analysis of the aforementioned experimental data, significant differences in vibration amplitude and time-domain response between hollow and non-hollow areas have been preliminarily identified, providing important evidence for the effective distinction between the two types of structures. To further reveal their differences from the perspective of the frequency domain, this paper obtains the complete frequency spectrum distribution of the sample signals collected from hollow and non-hollow areas through Fast Fourier Transform (FFT), and selects the frequency corresponding to the maximum amplitude as the dominant frequency feature for each strike. The relevant statistical results are presented in the form of bar charts in Fig. 7. Groups 1, 2, and 3 represent the three strikes in the first strike experiment, groups 4, 5, and 6 represent the three strikes in the second strike experiment, and groups 7, 8, and 9 represent the three strikes in the third strike experiment. The results show that the dominant frequencies of the hollow area samples are concentrated in higher frequency bands, with a relatively concentrated frequency distribution range, and individual sample peaks exhibit slight shifts but overall differences are small; the dominant frequencies of the non-hollow area samples are mainly distributed in the low-frequency range, except for a few individual data points, with lower peak amplitudes and narrower frequency variation ranges. This visually reflects the significant differences in frequency distribution characteristics between different structural areas.
Fig. 7Histogram of main frequencies for three sets of data of hollow and non-hollow areas
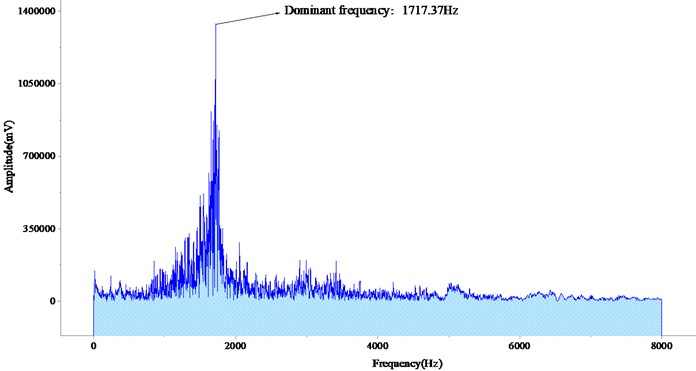
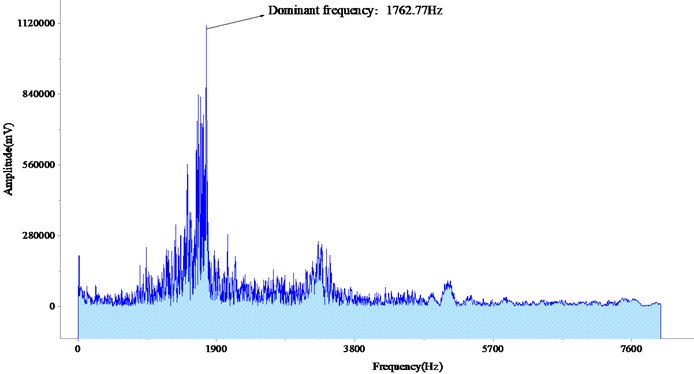
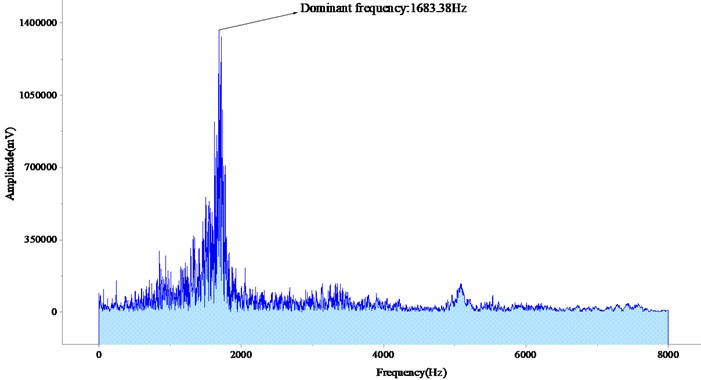
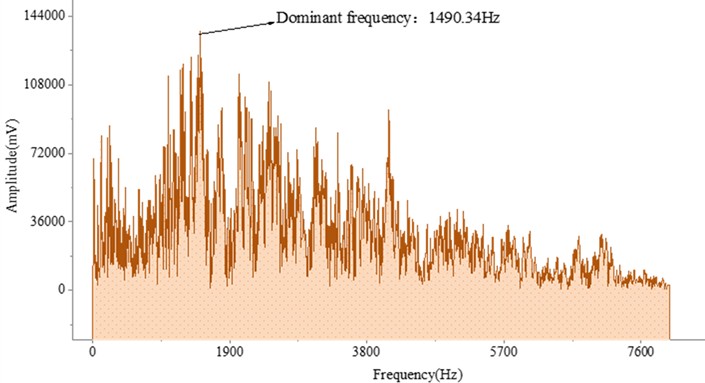
The time-domain signal of the acoustic data obtained from the first striking experiment was converted to the frequency domain using the Fast Fourier Transform (FFT), resulting in a graph of the relationship between amplitude and frequency, as shown in Fig. 8. The horizontal axis represents frequency (Hz), and the vertical axis represents amplitude (mV). The signal sampling frequency is 16 kHz. From the graph, it can be observed that the signal curve in the hollow area exhibits a significant peak near approximately 1700 Hz, where the amplitude is significantly higher than in other frequency bands, indicating a clear energy concentration phenomenon. In contrast, the frequency spectrum curve in the non-hollow area is generally smoother, with fewer peaks and lower amplitudes, indicating a more dispersed energy distribution without obvious concentrated peaks.
Fig. 8Amplitude-frequency diagram of the first set of data of hollow and non-hollow areas
a) The first strike of the first group of hollow drums
b) The second strike of the first group of hollow drums
c) The third strike of the first group of hollow drums
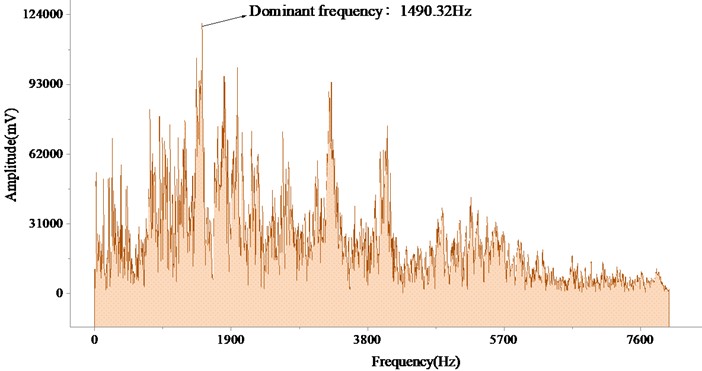
d) The first strike of the first group of Non hollow drums
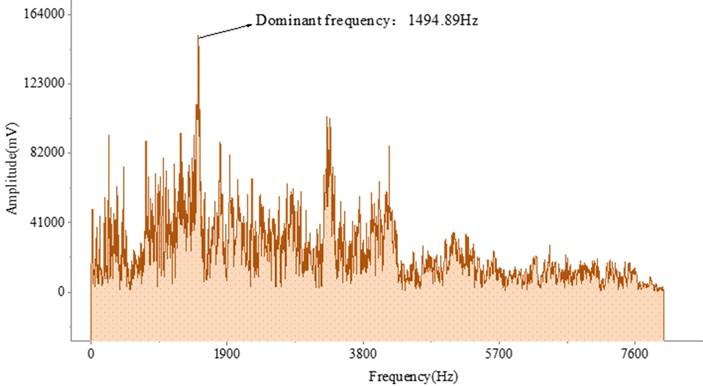
e) The second strike of the first group of Non hollow drums
f) The third strike of the first group of Non hollow drums
This difference may be due to characteristic resonant responses near the frequency points. Furthermore, by comparing the spectral shapes of the two types of signals, it can be seen that the spectral peak amplitude at the dominant frequency of the hollow signal is higher than that of the non-hollow signal, indicating that the acoustic response intensity generated by the hollow after being struck is greater. In contrast, the dominant frequency amplitude of the non-hollow signal is lower, and the overall energy level is relatively stable. From the above results, it can be found that there is a significant difference in amplitude between hollow and non-hollow signals in specific frequency bands. Perhaps the difference in amplitude peak at the dominant frequency can be used to distinguish between these two types of structural signals.
The observed difference in dominant frequency between hollow areas and non-hollow areas may be attributed to the change in vibration propagation mode resulting from the alteration of the wall’s internal state; in non-hollow concrete regions, vibrations generated by percussion can generally propagate to the surroundings through the relatively continuous concrete medium, and vibration energy dissipates gradually during the propagation process, which leads to relatively rich frequency components, a dispersed frequency distribution, and a relatively low concentration of dominant frequency.
Fig. 9Schematic diagram of frequency-domain mechanism analysis for hollow and non-hollow areas
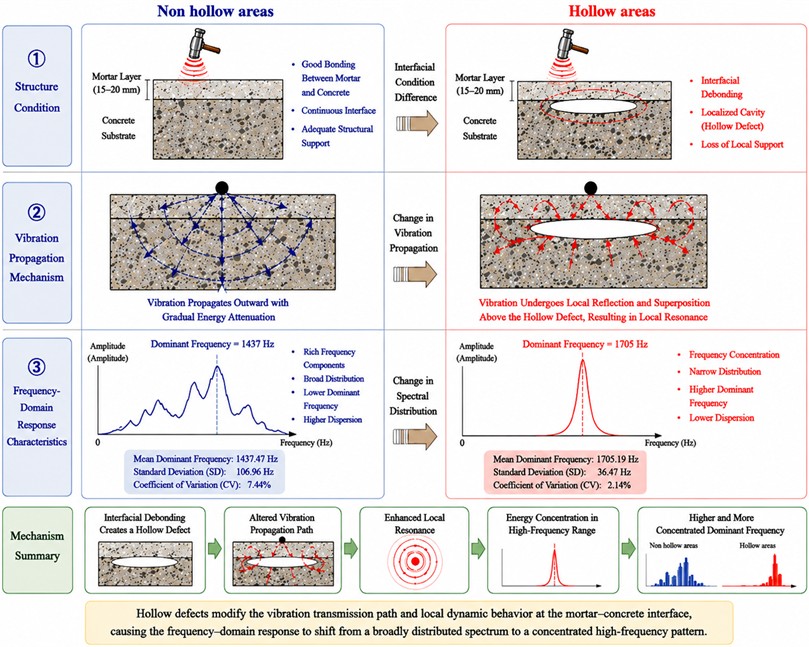
In contrast, when hollow defects exist inside the wall, the originally continuous concrete is interrupted by internal air cavities, and the concrete layer above the hollow areas loses partial support from the underlying solid material; upon impact, this region is more prone to generate localized vibrations with vibration modes distinct from those in intact regions, and in this case, vibration energy tends to concentrate within a specific frequency range rather than dispersing over a broad frequency band, therefore hollow areas usually exhibit a higher dominant frequency response compared with non-hollow regions; on the other hand, due to the relatively fixed internal state of hollow areas, their vibration patterns show good repeatability under identical impact conditions, resulting in a narrow variation range of dominant frequency and a more concentrated frequency distribution.
The formation of hollow areas is usually accompanied by interface debonding and the generation of local void structures, and their effects on vibration modes and acoustic propagation paths may be explained by the wave propagation mechanism in void-containing media; voids formed after interface debonding will destroy the continuity of the medium, alter local boundary conditions and mass-stiffness distribution, leading to the redistribution of vibration energy and inducing localized vibration modes; combined with relevant studies [37-39], void structures will cause reflection, scattering and mode conversion of waves at boundaries, thereby changing propagation paths and energy transfer characteristics; meanwhile, the coupling effect between the air inside the voids and the surrounding solid medium may produce local resonance effects and enhance the acoustic-vibration response in specific frequency bands; relevant studies have shown [40, 41] that the size, shape and distribution of voids will further affect wave field characteristics; therefore, the abnormal acoustic-vibration response of hollow defects is closely related to the void structures formed after interface debonding and their reconstruction of vibration modes and acoustic propagation paths.
To verify the above theory, a quantitative analysis framework is supplemented as shown in Fig. 9, where subgraph (a) compares the mean dominant frequency and its standard deviation between hollow and non-hollow areas; (b) presents the comparison of the coefficient of variation of dominant frequency; (c) shows the comparison of mean amplitude; (d) displays the comparison of amplitude standard deviation; and (e) illustrates the comparison of the coefficient of variation of amplitude; it can be observed from the figure that the mean dominant frequency of hollow areas is 1705.19 Hz, which is approximately 18.6 % higher than the 1437.47 Hz of non-hollow areas, and its standard deviation of dominant frequency is only 36.47 Hz with a coefficient of variation of 2.14 %, both remarkably lower than the 106.96 Hz and 7.44 % of non-hollow areas, indicating that hollow areas feature more concentrated and stable frequency responses with better consistency in repeated tests; in terms of amplitude characteristics, the mean amplitude of hollow areas is –42.33 mV, whose absolute value is obviously larger than the –16.63 mV of non-hollow areas, and meanwhile the amplitude standard deviation reaches 7005.98 mV, significantly higher than the 2876.93 mV of non-hollow areas, which reveals that hollow areas can generate stronger responses with more obvious fluctuations under identical percussion conditions, possibly attributed to the lack of solid support in hollow zones that enables impact energy to be more easily concentrated locally; by contrast, the coefficients of variation of amplitude for hollow and non-hollow areas are –0.60 % and –0.58 % respectively with little discrepancy, demonstrating that the relative dispersion degree of amplitude remains basically consistent; therefore, the dominant frequency and its statistical parameters can better reflect the differences in frequency stability between the two types of structures, while the mean amplitude and amplitude standard deviation are more capable of characterizing response intensity and fluctuation features; comprehensive analysis manifests that the dominant frequencies of hollow areas are mainly distributed within 1650-1750 Hz, whereas those of non-hollow areas fall in the range of 1300-1500 Hz, and the absolute values of peak amplitudes of hollow areas generally concentrate at 40-50 mV, in contrast to the 10-20 mV range for non-hollow areas; the above results prove that distinct differences exist in both frequency and amplitude responses between hollow and non-hollow areas, which can provide objective quantitative references for rapid screening and preliminary identification of hollow defects on engineering construction sites.
Compared with the traditional manual auditory inspection method, the main contribution of this study lies not in changing the percussion mode, but in transforming the detection process that originally relied on empirical judgment into a quantitative evaluation process based on data analysis; experimental results show that hollow areas exhibit a higher dominant frequency (1705.19 Hz) and lower frequency dispersion (SD = 36.47 Hz, CV = 2.14 %), while non-hollow areas show a lower dominant frequency (1437.47 Hz) and greater frequency fluctuation (SD = 106.96 Hz, CV = 7.44 %), and these statistical features can provide an objective basis for on-site detection, thereby reducing the impact of human empirical differences on detection results.
Fig. 10Statistical indicator comparison of dominant frequency and amplitude (hollowing vs. non-hollowing)
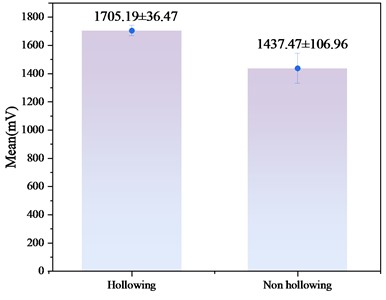
a) Mean parameter comparison of hollowing vs. non-hollowing concrete; error bars denote standard deviation (SD)
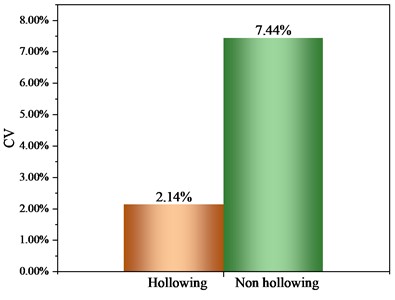
b) Variation coefficient of dominant frequency for hollowing and non-hollowing areas
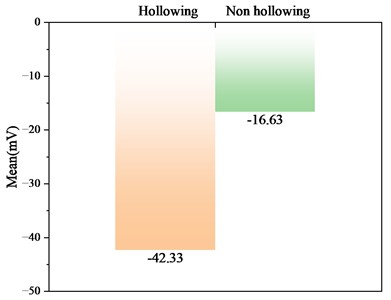
c) Comparison of overall average amplitude between hollowing and non-hollowing regions (9 groups of samples)
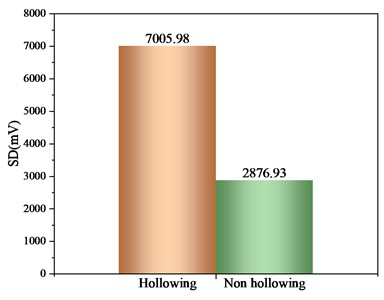
d) Comparison of average standard deviation of amplitude for hollowing and non-hollowing areas (9 groups)
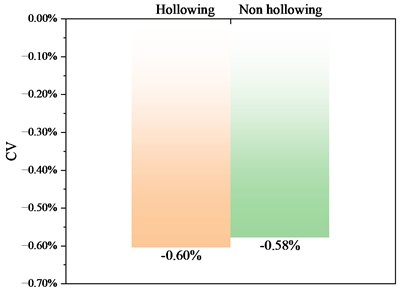
e) Comparison of amplitude coefficient of variation (CV) between hollowing and non-hollowing areas based on averaged mean and SD of 9 groups
This study carried out impact acoustic detection and analysis based on cast-in-place concrete walls in practical engineering, and the hollow defects originated from naturally occurring defects during the construction process, whose specific sizes, depths and internal morphologies were difficult to be accurately measured; therefore, this paper focuses more on verifying the feasibility of identifying hollow defects using statistical features of impact acoustics under real engineering conditions, rather than establishing a precise correspondence between hollow parameters and acoustic features; in addition, the data in this study were mainly derived from the same engineering object, and the obtained statistical laws still need to be further verified in more structural types and engineering scenarios; meanwhile, this paper adopted the statistical features of dominant frequency and amplitude to conduct quantitative analysis on hollow areas and non-hollow areas, and although good discrimination effects were achieved, an automatic identification and intelligent discrimination model has not yet been established.
Nevertheless, the experimental results demonstrate that through the joint analysis of the statistical features of dominant frequency and amplitude, the response differences between hollow areas and non-hollow areas can be effectively characterized, providing an objective basis for rapid on-site engineering detection; future work will further expand the sample size, construct standard specimens with known defect parameters, systematically investigate the variation laws of acoustic response characteristics under different defect conditions, and establish a more comprehensive hollow identification model combined with intelligent identification methods such as machine learning, so as to further improve the stability, applicability and engineering application value of the proposed method.
5. Conclusions
Taking hollow areas and non-hollow areas in cast-in-place concrete walls of practical engineering as the research objects, this paper acquired impact acoustic signals through percussion using a hollow detection hammer, and investigated the response characteristics of the two types of regions combined with time-domain analysis, Fast Fourier Transform (FFT) and statistical feature extraction methods, the main conclusions are as follows:
1) There are significant differences in both time-domain and frequency-domain response characteristics between hollow areas and non-hollow areas; hollow areas exhibit larger amplitude responses, slower attenuation rates and higher dominant frequency characteristics, while non-hollow areas, due to their intact structure, allow vibration energy to dissipate rapidly, resulting in smaller amplitudes, faster attenuation and lower dominant frequencies.
2) The quantitative analysis framework constructed based on the statistical parameters of mean, standard deviation and coefficient of variation of dominant frequency and amplitude can effectively characterize the differences between hollow areas and non-hollow areas; the dominant frequency and amplitude of hollow areas are significantly lower than those of non-hollow areas, indicating that the joint analysis of statistical parameters of dominant frequency and amplitude can effectively realize the quantitative characterization of hollow defects.
3) Under the conditions of this study, the dominant frequencies of hollow areas are mainly concentrated in the range of 1650 to 1750 Hz, and the absolute amplitude values are mainly distributed in 40 to 50 mV, while those of non-hollow areas are mainly distributed in the range of 1300 to 1500 Hz, showing obvious interval differences in both time-domain and frequency-domain between the two; this result indicates that the dominant frequency and its statistical characteristics can be used as important reference indicators for distinguishing hollow areas from non-hollow areas.
This study conducted experiments based on naturally occurring hollow defects in unfinished buildings, verifying the applicability of the proposed method under real engineering conditions; however, since the specific sizes, depths and geometric shapes of hollow defects cannot be accurately obtained, future work will further expand the sample size, construct standard specimens with known defect parameters, and conduct more systematic research combined with machine learning and intelligent identification algorithms, so as to further improve the stability, universality and engineering application value of the proposed method.
References
-
Z. Lan, X. Ma, H. Zhang, W. Huang, C. He, and X. Xu, “Detection of concrete bridge surface damage using wavelet-based multiband channel attention mechanism,” (in English), Measurement, Vol. 258, p. 119255, Oct. 2025, https://doi.org/10.1016/j.measurement.2025.119255
-
M. Siahkouhi, M. Rashidi, F. Mashiri, F. Aslani, and M. S. Ayubirad, “Application of self-sensing concrete sensors for bridge monitoring – a review of recent developments, challenges, and future prospects,” (in English), Measurement, Vol. 245, p. 116543, Mar. 2024, https://doi.org/10.1016/j.measurement.2024.116543
-
Z. Zuo et al., “Experimental research on remote real-time monitoring of concrete strength for highrise building machine during construction,” (in English), Measurement, Vol. 178, p. 109430, Apr. 2021, https://doi.org/10.1016/j.measurement.2021.109430
-
H. R. Ahmadi, F. Daneshjoo, and N. Khaji, “New damage indices and algorithm based on square time-frequency distribution for damage detection in concrete piers of railroad bridges,” Structural Control and Health Monitoring, Vol. 22, No. 1, pp. 91–106, Apr. 2014, https://doi.org/10.1002/stc.1662
-
X. Zhang, R. Zhou, X. Zha, and Y. Liao, “Study on the vibration comfort of a high-rise industrial building,” Buildings, Vol. 14, No. 11, p. 3676, Nov. 2024, https://doi.org/10.3390/buildings14113676
-
T. Ma, Q. Zou, Q. Ran, and F. Kong, “Compaction and re-crushing characteristics of sandstone granules with different gradations under cyclic loading,” (in English), Advanced Powder Technology, Vol. 35, No. 9, p. 104611, Sep. 2024, https://doi.org/10.1016/j.apt.2024.104611
-
Q. Ran et al., “Deterioration mechanisms of coal mechanical properties under uniaxial multi-level cyclic loading considering initial damage effects,” (in English), International Journal of Rock Mechanics and Mining Sciences, Vol. 186, p. 106006, Feb. 2024, https://doi.org/10.1016/j.ijrmms.2024.106006
-
L.-M. Wu et al., “Vibration performance of steel fiber concrete tunnel lining by adjacent tunnel blasting construction,” Applied Sciences, Vol. 13, No. 7, p. 4201, Mar. 2023, https://doi.org/10.3390/app13074201
-
Q. Yan et al., “Detection and diagnosis of concrete void defect using percussion-based method combined with convolutional neural network,” Measurement, Vol. 231, p. 114585, Mar. 2024, https://doi.org/10.1016/j.measurement.2024.114585
-
A. Abasi, B. Banting, and A. Sadhu, “Experimental evaluation of compressive properties of early-age mortar and concrete hollow-block masonry prisms within construction stages,” (in English), Materials, Vol. 17, No. 16, p. 3970, Aug. 2024, https://doi.org/10.3390/ma17163970
-
M. Mesa-Lavista, P. Romo-Letechipía, J. Álvarez-Pérez, R. González-Alcorta, J. H. Chávez-Gómez, and G. Fajardo-San Miguel, “Shear strength dataset of hollow concrete block masonry with different mortar bedding,” (in English), Data in Brief, Vol. 57, p. 111144, Dec. 2024, https://doi.org/10.1016/j.dib.2024.111144
-
H. Noshahri, Y. Wijnant, C. Cernat, E. Dertien, and L. O. Scholtenhuis, “Comparison of sensors for contactless detection of void behind concrete using stress waves,” in 2021 IEEE Sensors Applications Symposium (SAS), pp. 1–6, Aug. 2021, https://doi.org/10.1109/sas51076.2021.9530111
-
J. Qiao, Y. Sun, J. Hu, and W. Zhang, “Mechanical behavior of secondary lining vault void and mold grouting repair considering contact effect,” Structures, Vol. 47, pp. 385–395, Nov. 2022, https://doi.org/10.1016/j.istruc.2022.11.053
-
C. Cheng and Z. Shen, “Semi real-time detection of subsurface consolidation defects during concrete curing stage,” Construction and Building Materials, Vol. 270, p. 121489, Nov. 2020, https://doi.org/10.1016/j.conbuildmat.2020.121489
-
D. Jiang, L. Kong, H. Wang, D. Pan, T. Li, and J. Tan, “Precise control mode for concrete vibration time based on attention-enhanced machine vision,” Automation in Construction, Vol. 158, p. 105232, Dec. 2023, https://doi.org/10.1016/j.autcon.2023.105232
-
Y. Quan, X. Wang, Y. Liu, H. Sun, and F. Wang, “Real-time monitoring of concrete vibration depth based on RFID scales,” Buildings, Vol. 14, No. 4, p. 885, Mar. 2024, https://doi.org/10.3390/buildings14040885
-
J. Chen, C. Yang, Q. Wang, N. Xu, and T. Zhang, “Nonlinear ultrasonic second harmonic assessment of concrete defects based on embedded piezoelectric sensors,” Research in Nondestructive Evaluation, Vol. 31, No. 4, pp. 254–270, Jul. 2020, https://doi.org/10.1080/09349847.2020.1797255
-
L. Lu, X. Zhang, X. Li, and Y. Lu, “Application of advanced multi-parameter monitoring in concrete structure defect detection: integrating thermal integrity profiling and strain analysis,” Buildings, Vol. 15, No. 8, p. 1350, Apr. 2025, https://doi.org/10.3390/buildings15081350
-
M. Muramatsu, S. Uchida, and Y. Takahashi, “Noncontact detection of concrete flaws by neural network classification of laser doppler vibrometer signals,” Engineering Research Express, Vol. 2, No. 2, p. 025017, Jun. 2020, https://doi.org/10.1088/2631-8695/ab8ba4
-
B. Zima and R. Kędra, “Baseline-free debonding detection in reinforced concrete structures by elastic wave propagation,” (in English), Measurement, Vol. 172, p. 108907, Dec. 2020, https://doi.org/10.1016/j.measurement.2020.108907
-
J. Chen, Y. Song, F. Xiong, and T. Ai, “A thermal effects-based method for void detection in concrete face rockfill dams,” IEEE Transactions on Instrumentation and Measurement, Vol. 71, pp. 1–7, Nov. 2021, https://doi.org/10.1109/tim.2021.3127638
-
J. Chakraborty, X. Wang, and M. Stolinski, “Damage detection in multiple RC structures based on embedded ultrasonic sensors and wavelet transform,” Buildings, Vol. 11, No. 2, p. 56, Feb. 2021, https://doi.org/10.3390/buildings11020056
-
L. Cheng, J. Yang, D. Zheng, B. Li, and J. Ren, “The health monitoring method of concrete dams based on ambient vibration testing and kernel principle analysis,” Shock and Vibration, Vol. 2015, pp. 1–11, Jan. 2015, https://doi.org/10.1155/2015/342358
-
D. Chen, V. Montano, L. Huo, and G. Song, “Depth detection of subsurface voids in concrete-filled steel tubular (CFST) structure using percussion and decision tree,” Measurement, Vol. 163, p. 107869, May 2020, https://doi.org/10.1016/j.measurement.2020.107869
-
N. Dhingra, N. Saluja, R. Garg, and V. Kanwar, “Radio frequency as a non-destructive approach to concrete structure health monitoring,” Iranian Journal of Science and Technology, Transactions of Civil Engineering, Vol. 47, No. 5, pp. 2581–2589, Mar. 2023, https://doi.org/10.1007/s40996-023-01056-3
-
C. Li, J. Yang, X. Zhang, and M. Fu, “Research on non-destructive testing technology in renovating projects of Mukden Palace,” The International Archives of the Photogrammetry, Remote Sensing and Spatial Information Sciences, Vol. XLII-2/W11, pp. 721–726, May 2019, https://doi.org/10.5194/isprs-archives-xlii-2-w11-721-2019
-
G. Wang, M. Wang, L. Luo, Z. Liu, and Y. Zhong, “Acoustic detection of lining void: realization with light-weight algorithms and edge devices,” in 2024 5th International Conference on Artificial Intelligence and Computer Engineering (ICAICE), pp. 961–966, Nov. 2024, https://doi.org/10.1109/icaice63571.2024.10864219
-
I. Torigoe, K. Mori, and A. Spagnoli, “Signal processing procedure for non-destructive test of concrete structure integrity,” NDT and E International, Vol. 38, No. 7, pp. 575–581, 2005, https://doi.org/10.1016/j.ndteint.2005.02.006
-
C. van Steen, L. Pahlavan, M. Wevers, and E. Verstrynge, “Localisation and characterisation of corrosion damage in reinforced concrete by means of acoustic emission and X-ray computed tomography,” Construction and Building Materials, Vol. 197, pp. 21–29, Nov. 2018, https://doi.org/10.1016/j.conbuildmat.2018.11.159
-
E. Verstrynge, C. van Steen, E. Vandecruys, and M. Wevers, “Steel corrosion damage monitoring in reinforced concrete structures with the acoustic emission technique: a review,” Construction and Building Materials, Vol. 349, p. 128732, Aug. 2022, https://doi.org/10.1016/j.conbuildmat.2022.128732
-
Y. Ma, Z. Tian, X. Xu, H. Liu, J. Li, and H. Fan, “Research on response parameters and classification identification method of concrete vibration process,” Materials, Vol. 16, No. 8, p. 2958, Apr. 2023, https://doi.org/10.3390/ma16082958
-
Y. Nakagawa, T. Sugimoto, K. Sugimoto, and I. Uechi, “Research on improvement of defect detection accuracy by resonance judgment for noncontact acoustic inspection method by acoustic irradiation-induced vibration,” Japanese Journal of Applied Physics, Vol. 61, No. SG, p. SG1035, Jul. 2022, https://doi.org/10.35848/1347-4065/ac51bd
-
A. Sharma, S. Sharma, S. Sharma, and A. Mukherjee, “Monitoring invisible corrosion in concrete using a combination of wave propagation techniques,” Cement and Concrete Composites, Vol. 90, pp. 89–99, Mar. 2018, https://doi.org/10.1016/j.cemconcomp.2018.03.014
-
Y. Sonoda, C. Lu, and Y. Yin, “Basic research on usefulness of convolutional autoencoders in detecting defects in concrete using hammering sound,” Structural Health Monitoring, Vol. 22, No. 4, pp. 2231–2250, Sep. 2022, https://doi.org/10.1177/14759217221122296
-
E. Vandecruys, M. van de Velde, E. Reynders, G. Lombaert, and E. Verstrynge, “Experimental study on acoustic emission sensing and vibration monitoring of corroding reinforced concrete beams,” Engineering Structures, Vol. 293, p. 116553, Jul. 2023, https://doi.org/10.1016/j.engstruct.2023.116553
-
H. Zobel and P. Żółtowski, “Monitoring system for determination of vibrations of different building structures during driving in reinforced concrete pre-cast piles and sheet piles,” Key Engineering Materials, Vol. 518, pp. 217–227, 2012, https://doi.org/10.4028/www.scientific.net/kem.518.217
-
C. Li, G. Xu, H. Yao, C. Xin, and F. Liu, “Changes in pore structure and gas adsorption-desorption characteristics of coal under high-voltage electric pulses,” Processes, Vol. 13, No. 6, p. 1662, May 2025, https://doi.org/10.3390/pr13061662
-
Q. Liu, Q. Huang, G. Wang, S. Xie, and E. Wang, “Experimental study on the effects of ultrasonic excitation on pore structure of water-bearing coal,” International Journal of Rock Mechanics and Mining Sciences, Vol. 170, p. 105548, Jul. 2023, https://doi.org/10.1016/j.ijrmms.2023.105548
-
X. Wu et al., “Potential impact of macromolecular structure and nanoscale pore on coal matrix subjected to Microwave-LN2 freeze-thaw cycles,” Natural Resources Research, Vol. 35, No. 3, pp. 1925–1944, Jun. 2026, https://doi.org/10.1007/s11053-026-10640-z
-
F. Yan et al., “Effects of HCl and HNO3 solutions on the functional groups and pore structure of coal cracked by controlled electric pulse,” Powder Technology, Vol. 476, p. 122356, Mar. 2026, https://doi.org/10.1016/j.powtec.2026.122356
-
M. Yi, Y. Cheng, C. Wang, Z. Wang, B. Hu, and X. He, “Effects of composition changes of coal treated with hydrochloric acid on pore structure and fractal characteristics,” Fuel, Vol. 294, p. 120506, Mar. 2021, https://doi.org/10.1016/j.fuel.2021.120506
About this article

This work was supported by Qingdao Huanghai University Doctoral Research Fund Project (2022boshi02) (by Wenlong Zhang 15615516665) and Foundation of Beijing Key Laboratory of Super Intelligent Technology for Urban Architecture (Beijing University of Civil Engineering and Architecture) (BKL-SITUA-202504).
The datasets generated during and/or analyzed during the current study are available from the corresponding author on reasonable request.
Jiaqi Wang: Writing – original draft preparation. Shibin Teng: methodology. Shushu Ge: visualization. Wenlong Zhang: software. Fang Zhao: conceptualization.
The authors declare that they have no conflict of interest.

