Abstract
The automatic sorting system is presented in this work which is based on expert knowledge and high resolution visual sensor. Proposed system was tested for natural amber sorting task. Five types of amber have been explored in this research. Experimental investigation involves amber classification in three different color spaces (RGB, HSV and Grayscale). The results have shown that the highest classification accuracy is reached using the combination of the most essential features sets acquired from different color spaces.
1. Introduction
The automatic sorting is complex and important task in many industrial applications. The sorting task becomes more complex when it is applied to similar by its psychical properties objects. Amber is highly appreciate in Lithuania and has a wide use of purpose as decorative component for jewelry, souvenirs, crockery and art paintings. Namely for art manufactures the smallest pieces of amber, combining their color tones, transparency, variegation and other interface features are used mostly. At this time, sorting of ambers according to the color and type class is complicated and time consuming process performed by “the eye of human being” as well as possible human errors. The automated amber type identification could reduce the time of sorting process.
For practical investigation it is reasonable to use color pictures of different ambers. A lot of researches are developed to explore automated recognition techniques for color images. The classification of color images become an important role ensuring quality and high-speed processing in food industry [7], solving the problems in security sector [10], robotics [5] and others. Employing histogram thresholding techniques, pixels counting, different types of lighting, excluding edges or color tones of searched objects it is possible to obtain good enough results of classification accuracy [1, 3, 17, 6]. However, it is obvious that classification of one type objects is more complicated task than identification/separation of similar objects in the same image (i.e. recognition of human face [8, 17], different regions of photo [11]). With such problem deals food industry, when it is necessary to determine quality, breed, ripeness level of the product driven on conveyor [2, 14]. In most of suggested methodologies products are captured by one or few cameras which allow to classify images according to values of RGB, CMYK, HIS, CIELAB color space [12, 3, 15, 16]. Developing both commercial and academic classification systems RGB color model is applied mostly neglecting fact that the RGB color space is nonlinear. The successful techniques based on RGB color are developed to identify various food products (mostly fruits and grains). The classification task is facilitated when is possible to sort items distinguishing one or two features of color. For instance, separating good popcorn kernels from blue-eye damaged, it is enough to obtain gray image displaying only red pixel and to define threshold value of red pixels intensity [13]. Such approach enables to achieve good classification results (91 % accuracy recognizing good popcorns, and 74 % removing blue-eye damaged), since in the image damaged kernel has lower gray level intensity than the good one. Using gray-level images obtained from NIR camera identification of apple stem and calyx archives achieved 98.4 % of accuracy [2]. Counting pixels and using color thresholding the ripeness of banana can be recognized with an accuracy of 96 % [9].
However the most complicated classification becomes when it is necessary to group objects which are very similar and it takes a time to distinguish them even by “the eye of human being”. In this study investigated ambers are exact examples of such objects. It is essential to exclude the set of color features, according which it is possible to identify differences between objects. T. Pearson has shown that the use of multiple features of RGB color histogram for grains separation enables to achieve 95-99 % accuracy depending on the grains varieties (wheat, flax, barley) [12, 14]. Whereas in this paper a set of various interface characteristics of ambers’ images are taken into account and the new technique for ambers classification is presented. The purpose of this paper is to explore and highlight the most essential color features for each amber class allowing to achieve accurate sorting results.
The rest of this paper is structured as follows: in Section 2, materials and methods are prescribed, presenting detail description of explored ambers and automatic classification system. Experimental results are presented in Section 3 and Section 4 concludes the paper.
2. Materials and methods
2.1. Types of objects used for classification
Amber can be classified according to various aspects: chemical constituents, inclusions, bubbliness, color, ornamentation and texture. The most essential feature is color with its variegation and tone, because in industry so sorted ambers are used mostly. Amber is appearing in a range of different colors. As well as the usual yellow, orange, brown that is associated with the color “amber”, amber itself can range from a whitish color through a pale lemon yellow, to brown and almost black. Other, more uncommon and extremely rare only 0.2 % of all ambers include red, green, and even blue colors.
In this work proposed automatic sorting algorithm analyses and classifies the image of the modified and natural Baltic amber. Modified Baltic amber is a gemstone subjected only to thermal or high-pressure treatment, which changed its physical properties, including the degree of the transparency and color, or shaped according template.
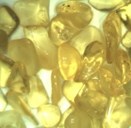
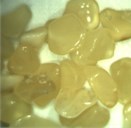
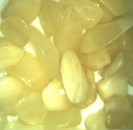
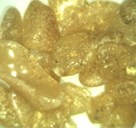
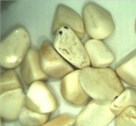
One method to classify amber is sorting by color and degree of transparency. The degree of transparency varies in amber from clear to cloudy. Clear amber is transparent and usually ranges from pale yellow to dark reddish yellow. In this research five classes of amber are analyzed (Fig. 1):
a. Crystal – transparent with a yellowish shade;
b. Semi-crystal – combination of clear and cloudy tones;
c. Mat – cloudy (opaque) with small transparent areas;
d. Sugary – clear (bright yellow) with many dark color spots;
e. White – white with “colorful intrusions” (black, brown, yellow color).
All ambers are on an average 0.19 g and 0.62 cm diameter. Currently ambers were classified manually. It’s a tedious process because ambers are very small and sometimes it’s confusing to determine exact color class. In addition both sides of amber have to be considered, which can signify diverse results as well. Mostly in different sub-colors come ambers of second and third classes and it is the subject of human errors. The same human expert during the repeated classification may classify the one class amber to the different one. Excellent professional expertise is required for correct and sure human decisions.
Fig. 1Types of amber: a) crystal, b) semi-crystal, c) mat, d) sugary, e) white
a)
b)
c)
d)
e)
2.2. Automatic sorting line
2.2.1. The hardware of the automated sorting line
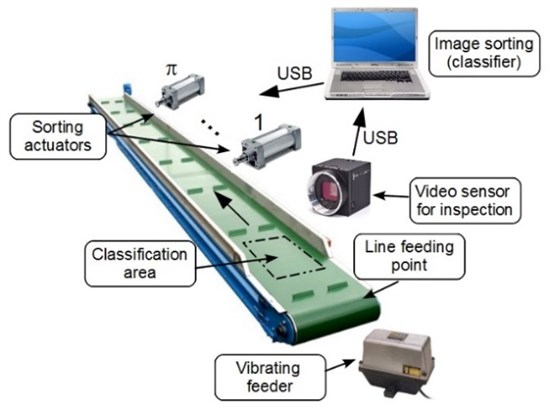
Automatic sorting line consists of three main modules: line feeding, object classification and object selection modules. All three modules are mounted on the conveyer (see Fig. 2). Each part is custom made and adapted to solve complex amber sorting task. The pieces of the amber are placed using vibration and gravity. The amber pieces travels throughout three cascades which lines the pieces in one straight line with gaps between each piece at the distance (approx. 4 cm). Classification part consists of fast IEEE 1394 video camera, personal computer, special lightening module and position sensor (photocell). The camera is able to capture 100 frames per second. Therefore, depending on structure of classifier and computer CPU, it is possible to classify more than 20 amber pieces per second. The video camera is triggered using position sensor. The digital image of the amber is captured all the time in the almost the same position. Computer runs image processing and classification program, controls selection of amber sorting actuators. Sorting actuators consist of pneumatic cylinders which pushes the classified object in to different containers. The decision in which container the amber must be collected decides the user based on classification result and configuration. LED projector from eight white diodes is used in the work. The surface of the conveyer under the video camera is evenly illuminated with almost homogeneous light.
Fig. 2Hardware of the automatic amber sorting line
2.2.2. Vibrating amber feeder
Electromagnetic vibrating feeder provides the most efficient and economical method of conveying bulk materials and it ensures the simplest and easiest way of controlling the rate and flow of the amber pieces. Vibrating feeder is operated by employing pulsating current. This current when passed through stator, creates a series of interrupted pulls on the armature. The proposed diagram of the vibrating feeder is shown in the Fig. 3.
Fig. 3Electromagnetic vibrating feeder of the automated sorting system
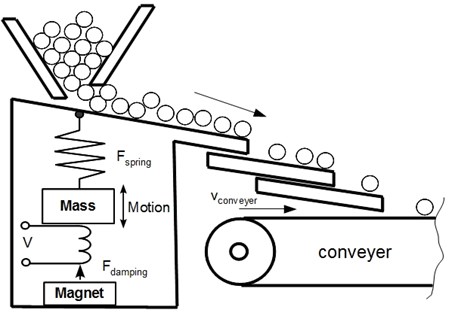
Vibrating feeder consist of vibrating tray fitted to a power unit of considerable weight (mass). The electromagnetic unit is mounted inside the heavy power unit. The power unit also houses the spring bars which consist of a number of leaf springs clamped at the two ends of the power unit. A heavy fabricated center piece carries the magnet armature at one end and the vibrating feeder tray at the other end. The center piece is tightly clamped around the middle of the spring system. The feed tray is of heavy welded construction with stiffeners and gussets to provide rigidity. A vibratory feeder is an instrument that uses vibration to transfer the material to a process or machine. Proposed vibratory feeder use both vibration and gravity to move material to the conveyer belt. Gravity is used to determine the direction, either down, or down and to a side, and then vibration is used to move the material.
2.3. Amber color identification algorithm
The presented classification method uses color features of objects in corresponding color space. During the experimental investigation we have noticed, that it is very hard to make correct classification by one specific color feature. Therefore the set of color features in different color models have been composed to the three like classifier. Bellow presented algorithm analyses three types of digital images, i.e., grayscale, RGB and HSV color images. The image can be expressed in general form as , where – is the number of color channels, and is the coordinates of the pixel. The amber classification by transparency problem is solved where each class has unique identification number . The is the number of predefined classes.
2.3.1. RGB color features
Each amber class has their own color features which discriminates best them from different amber classes. Therefore, experimentally founded, the most critical combinations of different RGB features are used in this work:
where is mean value of the color channel. is the number of the rows in the image, is the number of the columns.
Table 1Meanings of RGB characteristics
The mean value of red color channel | |
The mean value of green color channel | |
The mean value of blue color channel | |
The value of grayscale pixel | |
The difference between red and blue color channels | |
The gain value of the red color in the image | |
The difference between red and green color channels | |
The amount of pixels from specific intensity range of the red color channel | |
The amount of pixels from specific intensity range of the green color channel | |
The mean value of the blue color channel |
The set of fitting conditions is different for each class and the classification procedure is based on the conditioning or weighing the features of new amber image. It is like computing each class fitting membership value. The class label for unknown amber instance is assigned in accordance to maximum fitness value :
where is mean value of the feature of the object class , is the number of derived feature and is the total number of samples per class . The classification of new amber instance is done by finding the class number with the highest fitness value:
2.3.2. HSV color features
HSV (Hue, Saturation and Value) – defines a type of color space. It is similar to the modern RGB and CMYK models. The HSV color space has three components: hue, saturation and value. The HSV color space is quite similar to the way in which humans perceive color. The other models, define color in relation to the primary colors. The colors used in HSV can be clearly defined by human perception, which is not always the case with RGB. The formula for translation of RGB color image to the HSV color image is:
The combination of different HSV color features is used in this work:
The set of class fitting conditions according HSV color space:
Table 2Meanings of HSV characteristics
The intensity value of the HSV image | |
The saturation value of the HSV image | |
The hue value of the HSV image | |
The mean hue value of the object image | |
The mean saturation value of the object image | |
The mean intensity value of the object image |
2.3.3. Gray color features
The luminosity method is a more sophisticated version of the average method for converting color images to grayscale image. It also averages the values, but it forms a weighted average to account for human perception. Humans are more sensitive to green than other colors, so green is weighted most heavily. The formula for luminosity is:
The combination of different gray color features is used in this work:
Table 3Meanings of grayscale characteristics
Grayscale image | |
The mean value of grayscale image | |
Standard deviation of the grayscale intensity | |
The amount of white pixels | |
The amount of black pixels |
The set of class fitting conditions according to HSV color space:
where is the mean value of the feature of the object class, is the number of features and is the total number of samples per class.
2.3.4. Class identification rule
Each new amber image is classified based on selection of maximal fitting value :
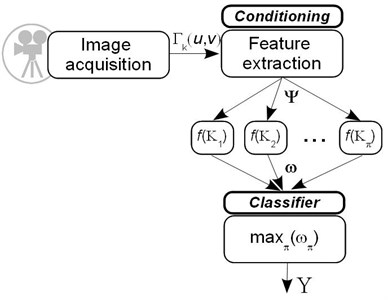
The classification rule of automatic sorting line is presented in the Fig. 4. Each new amber image is processed by main three steps: feature extraction, weighting based on predefined conditions and selection of maximum weight.
Fig. 4The functional algorithm of the classification rule
3. Experimental results
3.1. Sorting in separeted color spaces
For evaluation of proposed algorithm three experiments have been carried out. In all experiment cases the same 120 pieces of amber have been used. The study was performed using digital images of ambers in three color models (RGB, HSV and grey scale).
In Fig. 5 classification results of ambers according to RGB features are presented. Using the set of appropriative features, the most accurate are separated ambers of “crystal” 95.83 % (using five features) and “sugary” 98.33 % (using three features) classes. However, the classification accuracy of “semi-crystal” and “mat” class reaches only 68.33 % and 59.17 % respectively. Furthermore, “mat” ambers constitute the majority of “wrong” ambers of “semi-crystal” class 14.17 % and otherwise, “semi-crystal” ambers constitute the majority of “wrong” ambers of “mat” class 26.67 %.
Sorting ambers using HSV features (see Fig. 6) highest accuracy achieved distinguishing “sugary” ambers 98.33 % (two ambers were taken as “semi-crystal”). The lowest accuracy, as well as in first experiment, gained with the “mat” ambers 50.83 %.
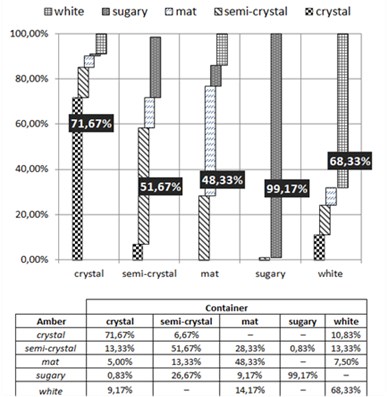
Classifying ambers from their grey scale images the best results (see Fig. 7) are gained separating sugary ambers 99.17 % (only one amber was assigned as semi-crystal). As in the two experiments above, it is most difficult to distinguish ambers of mat class (48.33 % accuracy).
Experimental results have shown that highest accuracy of each amber class is achieved in different color spaces. “Crystal”, “semi-crystal” and “mat” ambers with the highest accuracy are separated using RGB features, “white” ambers using HSV features and “sugary” using grayscale color features. Such results allow us to presume that combining the set of features of different color spaces will give the best score. For this purpose the tree classifier is composed which denotes amber sorting process considering to gained classification results in Section 3.1.
Fig. 5Ambers classification results according to RGB color features
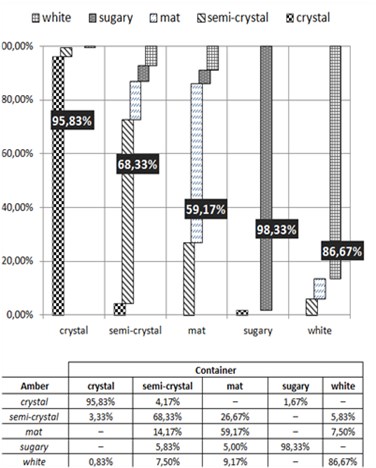
Fig. 6Ambers classification results according to HSV color features
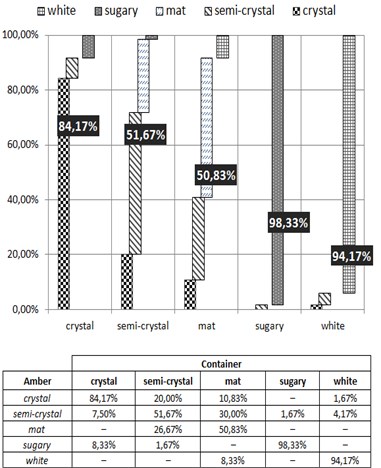
Fig. 7Ambers classification results according to grey scale features
3.2. Automatic sorting process based on tree classifier
The algorithm of automatic amber sorting based on tree classifier is shown in the Fig. 8. Ambers of class, {crystal, semi-crystal, sugary, mat, white}, are classified using features from , {RGB, HSV, Grayscale} color space at a first step. An amber image which has fitting value equal to 10 is classified as , , therefore, this amber is moved to the container. The set of ambers classes is sorted by highest accuracy. Amber in each class is inspected in the most efficient color space by classification accuracy. If an amber gets value it is moved to container according to its maximum value . Remaining amber pieces which have fitting value equal or less than 3.5 are placed in unrecognized ambers container and returned on the conveyer and additionally processed. Returned amber piece may be dropped on conveyer in a different position and orientation, therefore there is a possibility that amber piece will be classified correctly.
Fig. 8General algorithm of automatic amber sorting
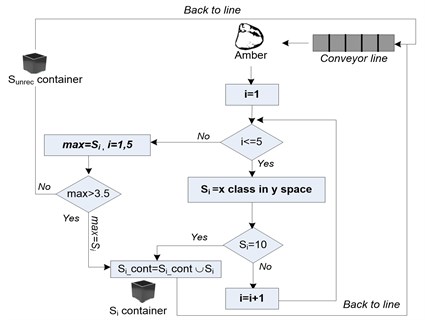
Fig. 9Scheme of automatic amber sorting
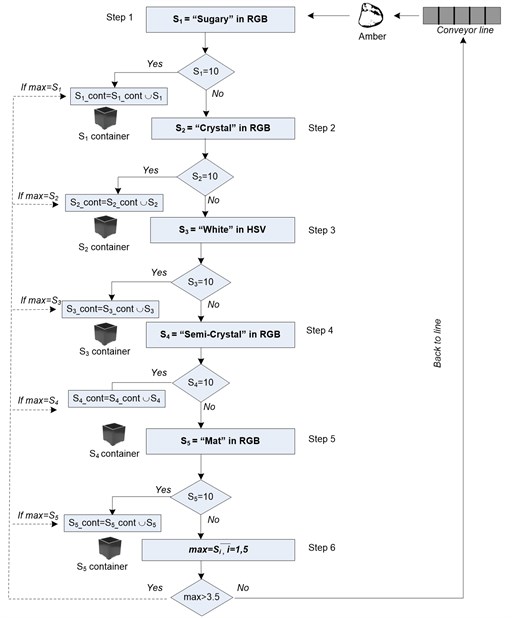
According to the previous results automatic sorting process is presented in Fig. 9. The “sugary” type ambers are classified using RGB features at a first step, since they have the highest classification score. In fact the highest score is gained in grayscale color 99.17 %, but during this experiment we notice that in the Step 6 selected grayscale features for “sugary” ambers decrease classification accuracy of other classes and it has a negative impact for overall classification results. That’s why RGB features for “sugary” ambers were selected. At a second step the “crystal” type ambers are classified using RGB features. If counted fitting value is equal to 10 the amber piece is moved in second container that stores “crystal” type ambers. “White” ambers are classified using HSV features in the third step. “Semi-crystal” amber pieces are classified using RGB features in the fourth step. “Mat” type ambers are classified using RGB features in the fifth step.
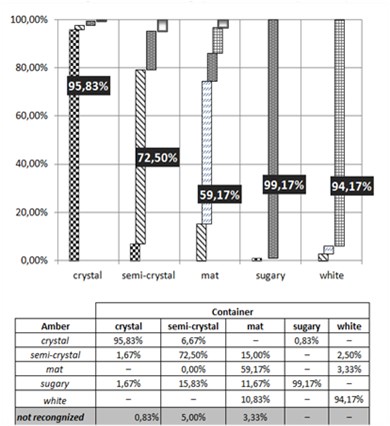
In Fig. 10 classification results of ambers according to tree classifier are presented. Using the set of appropriative features, the most accurate are separated ambers of “sugary” 99.17 % (using RGB features), “crystal” 95.83 % (using RGB features) and “white” 94.17 % (using HSV features) classes. However, the classification accuracy of “semi-crystal” and “mat” class reaches only 72.50 % and 59.17 % respectively.
Fig. 10Ambers classification results according to tree classifier
4. Conclusions
Experimental results presented in this paper indicate that “semi-crystal” and “mat” ambers are very similar and it is hard to distinguish them from each other. The results have shown that 13.33 % – 26.67 % of “semi-crystal” ambers are taken as “mat”, and 26.67 % – 30 % of “mat” ambers are taken as “semi-crystal”. Therefore, it would be reasonable to consider about conjunction of these classes. The highest accuracy in all experiments is achieved with the “sugary” ambers. In general, the usage of RGB color images allows us to compose the set of most efficient features, which increased the average classification accuracy to 81.77 %, (7.26 % and 10.93 % higher than using corresponding HSV and grey color features respectively). Proposed ambers’ sorting algorithm includes combination of features in different color spaces that allows us to improve the average classification accuracy 2.39 % (84.16 %).
Our future work will involve the usage of dedicated computational hardware that allows achieving higher classification rate. Higher classification accuracy could be reached using the combination of expert knowledge and fuzzy logic method. Employment of fuzzy logic with its possibility to use a wide range of inputs may solve the problem of “semi-crystal” and “mat” ambers separation.
References
-
Balasubramanian G. P., Saber E., Misic V., Peskin E., Shaw M. Unsupervised color image segmentation using a dynamic color gradient thresholding algorithm. Proc. of SPIE (6806), 68061H, 2008.
-
Bennedsen B. S., Peterson D. L. Identification of apple stem and calyx using unsupervised feature extraction. Transactions of the ASAE, Vol. 47, Issue 3, 2004, p. 889-894.
-
Chitade A. Z., Katiyar S. K. Color based image segmentation using k-means clustering. International Journal of Engineering Science and Technology, Vol. 2, Issue 10, 2010, p. 5319-5325.
-
Dutta S., Chaudhuri B. B. A color edge detection algorithm in RGB color space. International Conference on Advances in Recent Technologies in Communication and Computing, ARTCom '09, 2009, p. 337-340.
-
Hai-Bo L., Yu-Mei W., Yu-Jie D. Fast recognition based on color image segmentation in mobile robot. Proceedings of the Third International Symposium on Computer Science and Computational Technology (ISCSCT’10), 2010, p. 1-4.
-
Yajing L., Fan Y., Ruixia Y., Kejin J., Hongtao Z. Research on segmentation of weed images based on computer vision. Journal of Electronics, Vol. 2, Issue 24, 2007, p. 285-288.
-
Yang X. H., Tang J. Advances in Bioprocessing Engineering. World Scientific, 2002, p. 172.
-
Lin C., Su C. H., Huang H. S., Fan K. C. Colour image segmentation using the relative values of RGB in various illumination circumstances. International Journal of Computers, Vol. 2, Issue 5, 2011, p. 252-261.
-
Murugesapandian P., Radhakrishnamurthy M. C., Pranesh K. R., Siti S., Radzi M. Color recognition algorithm using a neural network model in determining the ripeness of a banana. Proceedings of the International Conference on Man-Machine Systems (ICoMMS), 2008, p. 2B71-2B74.
-
Mustafah Y. M., Bigdel A., Azman A. W., Lovell B. C. Smart cameras enabling automated face recognition in the crowd for intelligent surveillance system. Proceedings of the 2007 RNSA Security Technology Conference, 2007, p. 310-318.
-
Ozden M., Polat E. A color image segmentation approach for content-based image retrieval. Pattern Recognition, Vol. 40, 2007, p. 1318-1325.
-
Pearson T. C. High-speed sorting of grains by color and surface texture. Engineering in Agriculture, Vol. 26, Issue 3, 2010, p. 499-505.
-
Pearson T. C. Hardware-based image processing for high-speed inspection of grains. Computers and Electronics in Agriculture, Vol. 69, Issue 1, 2009, p. 12-18.
-
Pearson T. C., Brabecand D. L., Haley S. Color image based sorter for separating red and white wheat. Sensing and Instrumentation for Food Quality and Safety, Vol. 2, 2008, p. 280-288.
-
Peng T. S., Fuh C. S. Color-Based Printed Circuit Board Solder Segmentation 2010. Electronic library at http://www.smtnet.com
-
Rital S., Cherifi H., Miguet S. K-way hypergraph partitioning and color image segmentation. International Symposium on Communications Control and Signal Processing, 2006, p. 525-529.
-
Villegas M., Paredes R. Face recognition in color using complex and hypercomplex representations. Proceedings of the 3rd Iberian Conference on Pattern Recognition and Image Analysis, Part I, 2007, p. 217-224.
-
Zhaoa Y., Zhang L., Zhan D., Pan Q. Object separation by polarimetric and spectral imagery fusion. Journal Computer Vision and Image Understanding, Vol. 113, Issue 8, 2009, p. 855-866.
About this article

