Abstract
One dimensional model for the investigation of longitudinal vibrations of polymeric film is investigated. Comparison of stroboscopic and time averaged intensities in the photo-elastic images is performed. Results about the required number of images for performing time averaging are provided. Recommendations for simultaneous application of both stroboscopic and time averaged photo-elasticity for measurement of stresses are given. One dimensional model for the investigation of vibrations of polymeric film having two nodal degrees of freedom (longitudinal displacement and displacement of the upper surface, assuming that displacement of the lower surface is of the same value but in the opposite direction) is investigated. This model is applied for the interpretation of results of thermo-elastic analysis. Recommendations for the interpretation of the stress field by using photo-elastic and thermo-elastic methods are provided.
1. Introduction
In the process of motion of polymeric materials through the printing machine or during other technological operations various dynamic and static loadings take place: tension, vibrations, varying temperatures and etc. Such loadings may cause the increase of stresses in polymeric films. Also after manufacturing polymeric films themselves may have residual stresses. Those factors directly affect the final quality of the printing product. Thus measurement of stresses is especially important for improvement of quality of printed materials [1, 2].
Many methods for measurement of the residual stresses were developed during last decades. They all may be classified into three main groups: destructive (contour method, sectioning technique), semi destructive (hole drilling method, deep hole method) and non-destructive (X-ray diffraction, ultrasonic, photo-elastic methods) [3, 4]. Some aspects of distribution of residual stresses in the process of testing of polymeric parts using destructive methods are discussed in [5-9]. But most of polymeric films are thin monolayer or multilayered materials, thus non-destructive methods are of greatest interest. The method of photo-elasticity is one of the classical techniques for stress measurement. It can be applied for measurement of the stress distribution of various materials [10, 11], including transparent polymeric films that are often used for printing and packaging purposes.
But there is still lack of studies concerning measurement of stresses of vibrating polymeric films in printing devices using the method of photo-elasticity. Thus this paper is a continuation of investigations about time averaged photo-elasticity presented in the paper entitled “On interpretation of fringe patterns produced by time average photoelasticity” (Experimental Techniques, Vol. 29, No. 3, 2005, p. 48-51).
For better interpretation of the stress field of a vibrating polymeric film used in printing devices thermo-elastic analysis should be performed [12]. In this case one dimensional model of vibrations of polymeric film having two nodal degrees of freedom (longitudinal displacement and displacement of the upper surface, assuming that displacement of the lower surface is of the same value but in the opposite direction) is investigated in detail. The investigation is applied for the interpretation of results of thermo-elastic analysis. It is shown that the displacement of the upper surface is proportional to the sum of principal stresses in the problem of plane stress, which is being obtained from thermo-elastic experimental image of a vibrating structure.
Models used in this paper are based on the material presented in [13, 14]. The aim of the presented models is application of the obtained results in the process of interpretation of stress measurements in the investigations of polymeric films used in the process of printing.
2. Investigation of time averaged photo-elastic measurements
The numbering of photo-elastic fringes on the basis of time averaged image is investigated. Also the number of images which is to be used for time averaging is discussed.
2.1. Model for the analysis of vibrations of a polymeric film
Further denotes the axis of the system of coordinates. The finite element has one nodal degree of freedom, the displacement in the direction of the axis.
The mass matrix has the form:
where is the density of the material of the polymeric film, is the thickness of the polymeric film and:
where are the shape functions of the one dimensional finite element.
The stiffness matrix has the form:
where is the modulus of elasticity of the polymeric film, is the Poisson’s ratio of the polymeric film and:
Intensity of the stroboscopic photo-elastic image is expressed as:
where is a constant which depends on the thickness of the polymeric film and material from which it is produced and is longitudinal stress in the polymeric film in the status of maximum displacement according to the eigenmode.
Intensity of the time averaged photo-elastic image is expressed as:
where is a large integer number.
2.2. Results of analysis of vibrations of a polymeric film
Length of the analyzed structure is 0.2 m. On the left and the right ends of the structure the displacements are assumed equal to zero. The following parameters of the polymeric film are assumed: modulus of elasticity , Poisson’s ratio , thickness , density of the material .
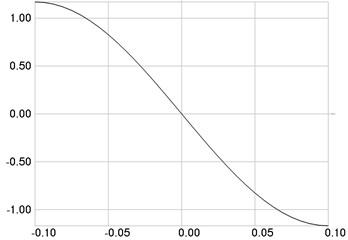
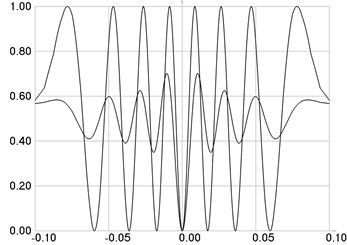
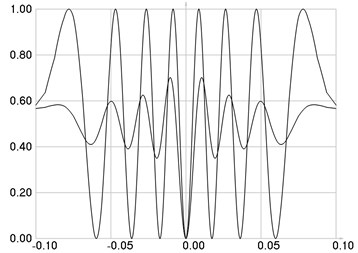
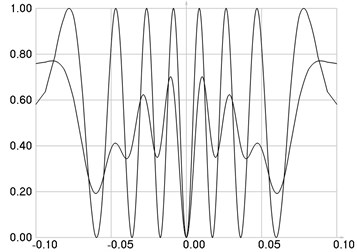
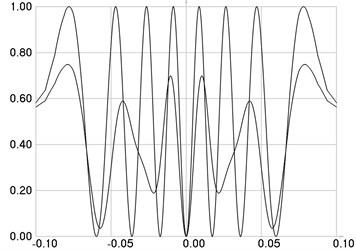
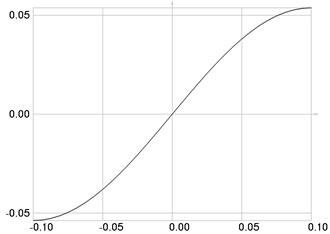
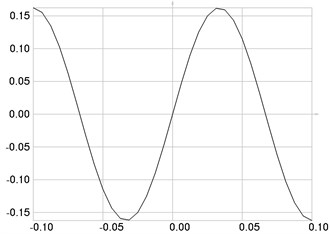
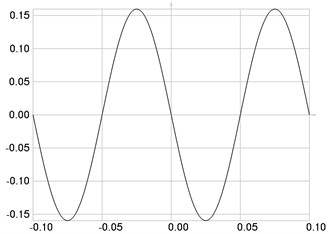
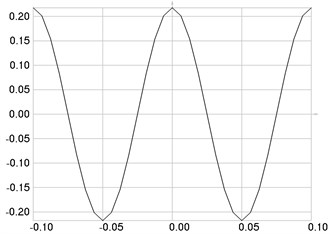
The first eigenmode is investigated. Stresses are presented in Fig. 1a, intensities of the stroboscopic and time averaged photo-elastic images when in Fig. 1b, when in Fig. 1c, when in Fig. 1d, when in Fig. 1e.
Fig. 1The first eigenmode: a) stresses, b) intensities of the stroboscopic and time averaged photo-elastic images when n= 64, c) when n= 32, d) when n= 16, e) when n= 8
a)
b)
c)
d)
e)
From Fig. 1b and Fig. 1c it is observed that the images look identical and thus the used values of may be considered acceptable. In Fig. 1d higher fringes are distorted and thus for them the result of averaging is unacceptable. In Fig. 1e substantial distortions of fringes are evident and the result of averaging is unacceptable.
From the presented results it is seen that the number of images used for time averaging is to be sufficiently large. Otherwise incorrect results for higher photo-elastic fringes are obtained.
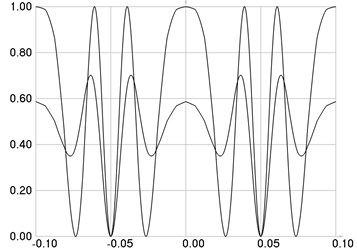
The second eigenmode is investigated. Stresses are presented in Fig. 2a, intensities of the stroboscopic and time averaged photo-elastic images when 64 in Fig. 2b.
Fig. 2The second eigenmode: a) stresses, b) intensities of the stroboscopic and time averaged photo-elastic images when n= 64
a)
b)
The presented results also indicate that for precise measurement of stresses it is advantageous to have both stroboscopic and time averaged images. The time averaged image is useful for numbering of fringes in the stroboscopic image. As seen from Fig. 1b and Fig. 2b the intensities of stroboscopic and time averaged fringes coincide where the stress is equal to zero. Going further from those places contrast of the time averaged images decays and on the basis of this direction of decay the photo-elastic fringes are numbered. It is impossible to perform this numbering on the basis of the stroboscopic images only.
3. Simultaneous use of thermo-elastic and photo-elastic measurements
The advantages of using both thermo-elastic and photo-elastic images for interpretation of the stresses in a vibrating polymeric film are investigated.
3.1. Model for thermo-elastic analysis of vibrations of a polymeric film
Further , , denote the axes of the system of coordinates. The finite element has two nodal degrees of freedom, the displacement in the direction of the axis and the displacement of the upper surface in the direction of the axis. The displacements are represented as:
where is the semi thickness of the polymeric film, is the vector of nodal displacements and:
where are the shape functions of the one dimensional finite element.
The mass matrix has the form:
where is the density of the material of the polymeric film and it was taken into account that:
The strains are represented as:
where:
The stiffness matrix has the form:
where:
where , , and is the modulus of elasticity of the polymeric film, is the Poisson’s ratio of the polymeric film and it was taken into account that:
3.2. Results of thermo-elastic analysis of vibrations of a polymeric film
Length of the analyzed structure is 0.2 m. On the left and the right ends of the structure the longitudinal displacements are assumed equal to zero. The following parameters of the polymeric film are assumed: modulus of elasticity 6·108 Pa, Poisson’s ratio 0.3, semi thickness 0.00005 m, density of the material 785 kg/m3.
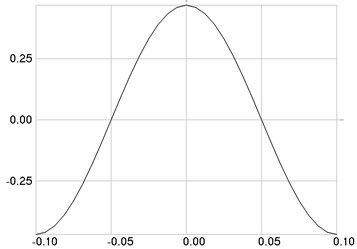
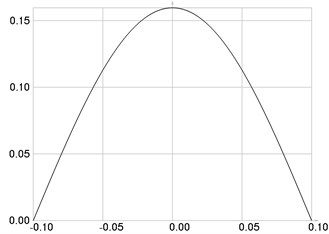
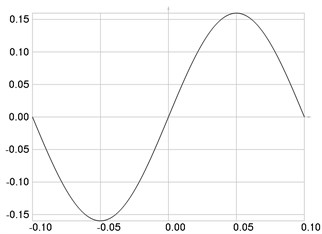
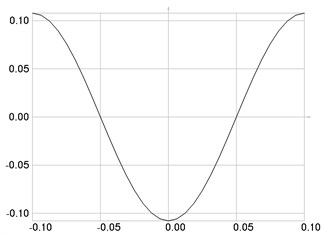
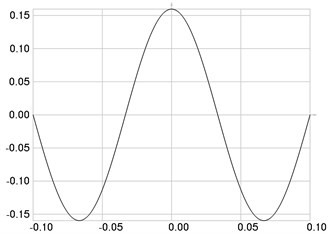
For the first eigenmode the variation of is presented in Fig. 3a and of in Fig. 3b. For the second eigenmode the variation of is presented in Fig. 4a and of in Fig. 4b. For the third eigenmode the variation of is presented in Fig. 5a and of in Fig. 5b. For the fourth eigenmode the variation of is presented in Fig. 6a and of in Fig. 6b. In all of the figures the values of multiplied by 1000 are indicated.
Fig. 3The first eigenmode: a) u, b) w multiplied by 1000
a)
b)
Fig. 4The second eigenmode: a) u, b) w multiplied by 1000
a)
b)
Fig. 5The third eigenmode: a) u, b) w multiplied by 1000
a)
b)
Fig. 6The fourth eigenmode: a) u, b) w multiplied by 1000
a)
b)
For the problem of plane stress:
where is the longitudinal strain in the direction of the axis and , are the longitudinal stresses in the directions of the and axes. Thus the sum of the principal stresses , is expressed as:
By taking into account that:
it is obtained:
A vibrating structure experiences temperature variations proportional to the change of the sum of the normal stresses. The change of temperature for the problem of plane stress where is the thermo-elastic constant of the material, is the absolute ambient temperature, is the change of the sum of the normal stresses.
For precise measurement of stresses it is advantageous to have both thermo-elastic and photo-elastic images. From the thermo-elastic image the sum of principal stresses which is proportional to is obtained. From the photo-elastic image in a circular polariscope the difference of principle stresses is obtained. Thus having both images it is much easier to determine both principle stresses. From the photo-elastic image of the plane polariscope isoclinics which determine the directions of principle stresses are available. Thus the interpretation of the stress field in the vibrating plane stress problem can be performed more precisely when all the mentioned experimental images can be used.
4. Conclusions
One dimensional model for the investigation of longitudinal vibrations of polymeric film is used. Comparison of stroboscopic and time averaged intensities in the photo-elastic images when the structure performs vibrations according to the eigenmode is performed.
Results about the required number of images for performing time averaging are provided. From the presented results it is seen that the number of images used for time averaging is to be sufficiently large. Otherwise incorrect results for higher photo-elastic fringes are obtained. This fact is illustrated by the graphical relationships obtained for the first eigenmode.
Recommendations for simultaneous application of both stroboscopic and time averaged photo-elasticity for measurement of stresses are given. The presented results also indicate that for precise measurement of stresses it is advantageous to have both stroboscopic and time averaged images. The time averaged image is useful for numbering of fringes in the stroboscopic image. Then the values of stresses can be obtained by counting fringes in the stroboscopic image, because this image is of higher contrast and thus provides more precise results.
One dimensional model for the investigation of vibrations of polymeric film having two nodal degrees of freedom is investigated and applied for the interpretation of results of thermo-elastic analysis. The displacement of the upper surface is proportional to the sum of principal stresses in the problem of plane stress, which is being obtained from thermo-elastic experimental image of a vibrating structure.
For precise measurement of stresses it is advantageous to have both thermo-elastic and photo-elastic images. From the thermo-elastic image the sum of principal stresses is obtained. From the photo-elastic image in a circular polariscope the difference of principle stresses is obtained. Thus from both images the principle stresses are obtained. From the photo-elastic image of the plane polariscope isoclinics which determine the directions of principle stresses are available. Thus the interpretation of the stress field in the vibrating plane stress problem can be performed more precisely with all the mentioned experimental images.
The obtained results are used in the process of interpretation of stress measurements of polymeric films.
References
-
Gamage P., Xie S. Q. A real-time vision system for defect inspection in cast extrusion manufacturing process. The International Journal of Advanced Manufacturing Technology, Vol. 40, Issue 1-2, 2009, p. 144-156.
-
Soroka W. Fundamentals of Packaging. Institute of Packaging Professionals, Second Edition, Herndorn, Virginia, 1999, p. 589.
-
Rossini N. S., Dassisti M., Benyounis K. Y., Olabi A. G. Methods of measuring residual stresses in components. Materials & Design, Vol. 35, Issue 3, 2012, p. 572-588.
-
Parlevliet P., Bersee H. E. N., Beukers A. Residual stresses in thermoplastic composites – a study of the literature – Part II: Experimental techniques. Composites Part A: Applied Science and Manufacturing, Vol. 38, Issue 3, 2007, p. 651-665.
-
Pak S. Y., Kim S. Y., Kim S. H., Youn J. R. Measurement of residual stresses in polymeric parts by indentation method. Polymer Testing, Vol. 32, Issue 5, 2013, p. 946-952.
-
Kim S. Y., Kim Ch. H., Kim S. H., Oh K. J., Youn J. R. Measurement of residual stresses in film insert molded parts with complex geometry. Polymer Testing, Vol. 28, Issue 5, 2009, p. 500 507.
-
Metehri A., Serier B., Bachir B., Belhouari M., Mecirdi M. A. Numerical analysis of the residual stresses in polymer matrix composites. Materials & Design, Vol. 30, Issue 7, 2009, p. 2332-2338.
-
Postawa P., Kwiatkowski D. Residual stress distribution in injection molded parts. Journal of Achievements in Materials and Manufacturing Engineering, Vol. 18, Issue 2, 2006, p. 172-174.
-
Kamal M. R., Lai-Fook R. A., Hernandez-Aguilar J. R. Residual thermal stresses in injection moldings of thermoplastics: a theoretical and experimental study. Polymer Engineering & Science, Vol. 42, Issue 5, 2002, p. 1098-1114.
-
Colombo C., Guagliano M. Photoelastic analysis of cylindrical elements with internal cracks under Hertz contact loading. Fatigue & Fracture of Engineering Materials & Structures, Vol. 33, Issue 12, 2010, p. 885-896.
-
Aben H., Anton J., Errapart A. Modern photoelasticity for residual stress measurement in glass. Strain, Vol. 44, Issue 1, 2008, p. 40-48.
-
Ragulskienė J., Maciulevičius J., Vasiliauskas R., Daučanskienė K. Experimental – numerical techniques for thermoelastic analysis of structural vibrations. Ultragarsas, Vol. 4, Issue 57, 2005, p. 37-39.
-
Zienkiewicz O. C. The Finite Element Method in Engineering Science. Moscow: Mir, 1975, (in Russian).
-
Bathe K. J. Finite Element Procedures in Engineering Analysis. New Jersey: Prentice-Hall, 1982.
About this article

The work has been supported by the Lehigh University and Kaunas University of Technology common project “Development of Novel Optical Methods for Defectoscopy of Polymer Films for Polygraphic and Packaging Manufacturing” (Partnership Agreement No. F4-90-87, 2012-2014).
