Abstract
The article describes a concept of a non-invasive method for diagnosing the size of the valve clearance of combustion engines based on an analysis of engine surface vibration signal using artificial neural networks. The applicability of the method was tested on a single-cylinder compression-ignition engine with a low power rating, which had an OHV timing gear acting indirectly on the valves and manual adjustment of valve clearance. The method uses as diagnostic signals the readings of vibration sensors, recording the acceleration of engine head movement as a function of the angle of rotation of its crankshaft, with pre-set values of valve lash measured in a cold condition. From among the recorded signals, components corresponding to the impact of rocker arms on valve stems were identified, and then these components were subjected to low-pass filtering in order to eliminate measurement interference. Using artificial neural networks, a classifier of selected measures of the processed signals was constructed, which recognizes signals generated by engines with correct valve clearance as well as those with too much and too little valve clearance.
1. Introduction
Most timing gear mechanisms of internal combustion engines are equipped poppet valve cam drives. The popularity of this solution is not so much due to its advantages but rather results from a lack of effective alternatives. In engines which do not reach speeds exceeding 5,500 rev/min, timing gear mechanisms acting indirectly on the valves are commonly used. An indirect valve drive consists of a cam shaft, shaft bearings in the motor housing, a follower, a push rod, a rocker arm, a poppet valve with a spring, and rocker arm bearings. Due to their mass, the parts of the mechanism which are in motion during engine operation cause high loads to kinematic joints with forces of inertia. On the other hand, the indirect drive has a relatively low stiffness, which is largely dependent on the length of the push rod. The timing gear mechanism, therefore, possesses its own dynamic characteristics, which manifest themselves during engine operation. These characteristics are also influenced by the so-called valve clearance (valve lash).
Valve lash is the total clearance in the timing gear. In indirect drive mechanisms, the numerical value of the clearance is measured between the valve stem and the sliding surface of its mating rocker arm. The need for valve clearance is due to the changing linear dimensions of timing gear mechanisms caused by their thermal expansion. Clearance values depend on engine type, the mode of its cooling, timing gear design, and numerous other factors. Ideal valve clearance is usually determined experimentally. Valve clearance measurements do not give reliable results because of the difficulty involving the prediction of actual temperature distributions in different parts of a running engine. The general rule is that valve clearance should be as small as possible, but still large enough for the valves to close tightly during engine operation. Excessive valve clearance can be the cause of: reduced engine power (caused by the deteriorated filling of cylinder space due to the dislocation of the beginnings and ends of valve opening and closing, and as a result of a reduction in actual valve stroke), the occurrence of additional impact forces of inertia, causing rapid wear of the mating surfaces (especially valve faces and valve seats), consequently leading to an uncontrolled increase in clearance values, increasingly noisy operation of the timing gear, and valve bounce during closing of the valves. Diagnostics of valve clearances of timing gear mechanisms in internal combustion engines is, therefore, important from a practical point of view and can be carried out by the vibroacoustic method. When testing engines by vibroacoustic methods, it is important to adequately interpret complex measurement signals through the use of increasingly sophisticated methods of their processing [1-4]. Information about faults in the timing gear mechanism can be obtained through signals of engine head vibration [5]. These signals contain information about the operation of valves, their excessive clearance, burning of valve seats, or fractured valve springs. The possibility of diagnosing the operation of a timing gear using vibrational signals recorded on the head has been noticed and investigated by many scientists, because vibration signals are relatively simple and convenient to measure [6].
2. The concept of a non-invasive method for assessing valve clearance
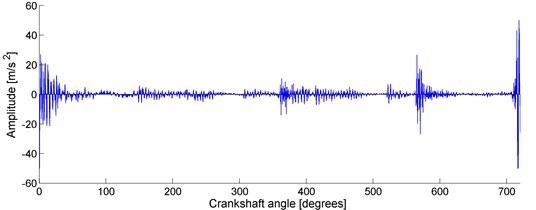
The primary forces affecting the internal combustion engine during operation are gas forces, the character of which results from the cyclic occurrence of combustion processes. Since the engine block provides support for all mechanisms making up the engine, it is subjected to dynamic interactions in all kinematic pairs. The vibrations of the block are a response to the total forces acting in the places of its contact with moving parts of the engine (Fig. 1). In the case of a prolonged period of operation of a single-cylinder four-stroke engine with a fixed load, the vibration signal of its block shows a periodicity corresponding to the periodicity of the occurrence of ignitions.
Fig. 1Example of the acceleration of the vibration of RUGGERINI RY125 engine head as a function of the crank angle between two successive ignitions when idling (registered by the authors at the test stand)
In particular, some components of the block vibrations are caused by the elements of the timing gear mechanism, whose vibrations depend on the size of valve clearance. To use the vibration of the block to assess valve clearance, components of the vibrations coming from other engine parts need to be separated. In this case, the application of filtering in a given frequency band does not solve the problem due to the fact that the same frequency of vibrations of the block can be forced by various engine components. One of the possible solutions, which also forms the basis of the diagnostic method proposed in the present article, is temporal selection. It requires information on the exact moments of opening and closing the valves. This information is obtainable, since those moments are determined by the shape and arrangement of the cams of the camshaft, while the angular position of the camshaft depends on the position of the engine crankshaft (variable valve timing is not considered here). The application of a sensor of the angular position of the crankshaft allows the separation of the moment of opening and closing of the valves from the vibration signal.
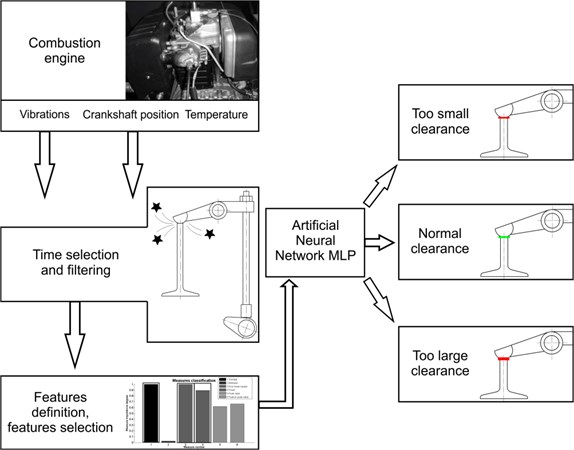
The non-invasive diagnostic method of engine valve clearance assessment proposed by the present authors is based on the aforementioned premises. The procedure involves four stages, schematically depicted in Fig. 2. In the first stage, signals of engine block vibrations are registered. The second stage consists in separating from this signal those vibrations which have been caused by opening of the valves (the rocker arm striking the valve stem) and filtering of the processed signal to eliminate inference. In the third stage, a special algorithm is used to select optimum signal measures from among typical measures used in technical diagnosis. The fourth stage involves classification of the signals using a multilayer perceptron (MLP) artificial neural network. The task of the MLP network is to assign the engine valve clearance, on the basis of the signal supplied, to one of three classes: too little clearance, correct clearance, or too much clearance.
Fig. 2Stages of the proposed diagnostic method of assessment of the size of combustion engine valve clearance
3. Experimental
In recent years, there has been continuous development of diagnostic inference algorithms and signal processing methods [7-14]. Various techniques have been used to increase the ratio of signal to noise, such as noise reduction using the wavelet transform [15, 16]. The methods of artificial intelligence, mainly neural networks [5, 17], or less known methods such as recurrence plots [18, 19] are often used as inference algorithms.
The valve-clearance diagnosis method proposed by the present authors is a comparative method. Its main limitation is the need for the development of a database of experimental results before the actual experiments are carried out in order to select the best neural classifiers. The selection of such classifiers is preceded by training and testing procedures aimed at teaching a network to recognize specific characteristics and to empirically estimate the accuracy of recognition. These procedures require the preparation of three data sets: a training set, a test set and a validation set. The accuracy of a classification, and hence the performance of a given neural network is determined by the ratio of the number of accurately recognized cases to the total number of cases. To use a neural network to evaluate the size of a valve clearance, first, engine vibration signals with a pre-programmed (known) valve clearance must be registered and the neural classifier must be taught to recognize the size of this clearance. The classifier can then be asked to evaluate vibration signals recorded in the same engine in the future, but in conditions analogous to those for training signals.
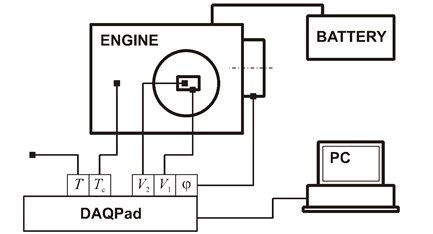
To verify the applicability of the proposed approach to diagnosing the valve clearance of combustion engines, an experiment was conducted on a test bench in the Institute of Transport, Internal Combustion Engines and Ecology, of the Lublin University of Technology. The bench is equipped with a RUGGERINI RY125 four-stroke diesel engine and an apparatus for recording the vertical and lateral components of acceleration of engine head vibration, the crankshaft position angle, and engine cylinder temperature and ambient temperature. A schematic diagram of the test bench is shown in Fig. 3.
Fig. 3A schematic diagram of the test bench for recording vibrations of the head of a RUGGERINI RY125 engine (DAQPad – measurement card, V1,V2 – components of acceleration of engine head vibrations, Tc – temperature of the cylinder, T – ambient temperature, φ – position of the crankshaft)
The RUGGERINI RY125 engine is a single-cylinder unit with a displacement of 505 cm3 (85 mm stroke, 87 mm bore), air-cooled, capable of developing a rated power of 8.8 kW at 3600 rpm and a maximum torque of 31 Nm at 2000 rpm. It has an OHV timing gear mechanism with an indirect valve drive (one intake valve and one exhaust valve) and manual adjustment of valve clearance. The rocker arms are double-sided and equipped with adjusting screws. The assembly valve clearances recommended by the manufacturer are the same for both valves and are 0.20 mm for a cold condition and 0.15 mm for a hot condition.
On the test bench, information about the position of the engine's crankshaft is read from the Kübler 8.5820.1312.3600 incremental encoder. Vibrations of the cylinder head are measured using ICP 338B34 piezoelectric accelerometers (adhesive-mounted on the head) and 482A16 amplifier from PCB PiezotronicINC. The temperature of the cylinder and ambient temperature are measured using TP-371 and TP-372 sensors with a single processing unit (a Pt100 platinum resistor). All measurement signals are recorded using a DAQPad-607 measurement card (16 inputs, 1.25 MS/s, 12 bit, multifunction ± 5 V) from national instruments.
To collect the data necessary for the preparation of the neural classifier, head vibration signals were registered at four preset valve clearances: 0.10, 0.20, 0.30 and 0.40 mm in a cold condition, for four cylinder temperatures: 28, 35, 40 and 45°C. Signal was recorded under no-load idle conditions at a rotational speed of 980 rpm, with the crankshaft making 200 complete revolutions.
4. Results
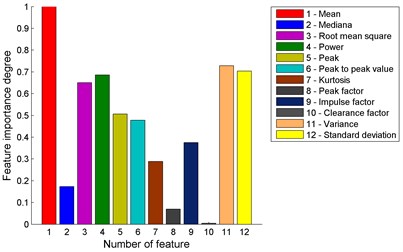
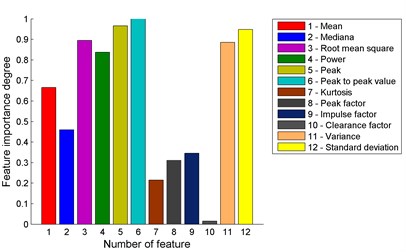
In the present experiment, multilayer perceptron (MLP) networks were studied as neural classifiers of valve clearance. Firstly, vibrations caused by rocker arms striking the valve stems were separated from the recorded signals, and the signals processed in this way were filtered. A low-pass filter was used to remove high-frequency components, which were mostly interference noise. Because different valve clearance values can cause changes in the amplitude of the vibration signal and its distribution, suitable signal measures should be found so that those that carry little information about the change of state are eliminated. Of the twelve measures considered, seven with the highest significance level were selected for further processing using a selection algorithm; they included arithmetic mean of the absolute values of the signal, effective value, signal strength, peak value, inter-peak value, empirical variance and standard deviation of the sample (Fig. 4).
The usefulness of MLP networks for classification of valve clearance was verified using the STATISTICA® Neural Networks module.In the case of sensor 1, when the procedure shown in Fig. 2 was followed, a 90 % classification accuracy was achieved for the test data and approximately 95 % for the validation data. Better results were achieved for sensor 2, for which almost all of the cases were classified correctly (100 % and 99.25 %). Much worse results were obtained by processing data without temporal selection and filtration. For both sensors, the classification accuracy was slightly over 80 %.
Fig. 4Comparison of significance levels for signal measures for a) vibration sensor 1 and b) vibration sensor 2
a)
b)
5. Conclusions
In the light of the results obtained in the study, the proposed method for evaluating the size of valve clearance is worthy of attention, though undoubtedly many details still need to be worked out. Further experimental studies on a larger scale are needed which would include theoretical modelling of the physical processes taking place in the timing gear of an internal combustion engine. Also, other signal measures, filtration methods and methods for recording measurement signals should be considered [20-23], as well as a change of the vibration measurement method (for example, using a laser vibrometer or a recorder of acoustic frequencies).
References
-
Charles P., Sinha J. K., Gu F., Lidstone L., Ball A. D. Detecting the crankshaft torsional vibration of diesel engines for combustion related diagnosis. Journal of Sound and Vibration, Vol. 321, Issue 3-5, 2009, p. 1171-1185.
-
Jianmin L., Yupeng S., Xiaoming Z., Shiyong X., Lijun’a D. Fuel injection system fault diagnosis based on cylinder head vibration signal. Procedia Engineering, Vol. 16, 2011, p. 218-223.
-
Yen G. G., Leong W. F. Fault classification on vibration data with wavelet based feature selection scheme. ISA Transactions, Vol. 45, Issue 2, 2006, p. 41-151.
-
Zhang Z., Mathew J., Ma L., Sun Y. Best basis-based intelligent machine fault diagnosis. Mechanical Systems and Signal Processing, Vol. 19, Issue 2, 2005, p. 357-370.
-
Wu J. D., Liu C. H. An expert system for fault diagnosis in internal combustion engines using wavelet packet transform and neural network. Expert Systems with Applications, Vol. 36, Issue 3, 2009, p. 4278-4286.
-
Chengdong W., Youyun Z., Zhenyuan Z. Fault diagnosis for diesel valve trains based on time – frequency images. Mechanical Systems and Signal Processing, Vol. 22, 2008, p. 1981-1993.
-
Antoni J., Randall R. B. Unsupervised noise cancellation for vibration signals: part I-evaluation of adaptive algorithms. Mechanical Systems and Signal Processing, Vol. 18, 2004, p. 89-101.
-
Hong L., Dhupia J. S. A time domain approach to diagnose gearbox fault based on measured vibration signals. Journal of Sound and Vibration, Vol. 333, Issue 7, 2014, p. 2164-2180.
-
Droździel P. The influence of the vehicle work organization conditions on the engine start-up parameters. Maintenance and Reliability, 2008, p. 72-74.
-
Droździel P., Krzywonos L. The estimation of the reliability of the first daily diesel engine start-up during its operation in the vehicle. Maintenance and Reliability, 2009, p. 4-10.
-
Łazarz B., Wojnar G., Czech P. Early fault detection of toothed gear in exploitation conditions. Maintenance and Reliability, 2011, p. 68-77.
-
Fenga Z., Zuo M. J. Vibration signal models for fault diagnosis of planetary gearboxes. Journal of Sound and Vibration, Vol. 331, Issue 22, 2012, p. 4919-4939.
-
Kronast M. Theory and application of modal analysis in vehicle noise and vibration refinement. Vehicle Noise and Vibration Refinement, 2010, p. 117-141.
-
Wang Y., Zuo M., Lei Y., Fan X. Improvement of local mean approximation in empirical mode decomposition for gear fault detection. Maintenance and Reliability, Vol. 2, 2010, p. 59-66.
-
Geng Z., Chen J., Hull B. Analysis of engine vibration and design of an applicable diagnosing approach. International Journal of Mechanical Sciences, Vol. 45, Issue 8, 2003, p. 1391-1410.
-
Gajewski J., Jedliński Ł., Jonak J. Classification of wear level of mining tools with the use of fuzzy neural network. Tunnelling and Underground Space Technology, Vol. 35, 2013, p. 30-36.
-
Jedliński Ł. Multi-channel registered data denoising using wavelet trans form. Maintenance and Reliability, Vol. 14, Issue 2, 2012, p. 145-149.
-
Hunicz J., Gęca M., Rysak A., Litak G., Kordos P. Combustion timing variability in a light boosted controlled auto-ignition engine with direct fuel injection. Journal of Vibroengineering, Vol. 15, Issue 3, 2013, p. 1093-1101.
-
Syta A., Jonak J., Jedliński Ł., Litak G. Vibration of a gear box and wear effect monitoring by recurrences. Journal of Vibration and Acoustics, Vol. 134, 2012, p. 041006-1-041006-8.
-
Antoni J., Bonnardot F., Raad A., El Badaoui M. Cyclostationary modelling of rotating machine vibration signals. Mechanical Systems and Signal Processing, Vol. 18, 2004, p. 1285-1314.
-
Pillac V., Gendreau M., Guéret C., Medaglia A. L. A review of dynamic vehicle routing problems. European Journal of Operational Research, Vol. 225, Issue 1, 2013, p. 1-11.
-
Dauksevicius R., Kulvietis G., Ostasevicius V., Milasauskaite I. Finite element analysis of piezoelectric microgenerator – towards optimal configuration. Procedia Engineering, Vol. 5, 2010, p. 1312-1315.
-
Mažeika D., Kulvietis G., Tumasoniene I., Bansevicius R. New cylindrical piezoelectric actuator based on traveling wave. Mechanical Systems and Signal Processing, Vol. 36, Issue 1, 2013, p. 127-135.
About this article

